


- TradingFinder
- Education
- Forex Education
- Technical analysis Education
Technical analysis Education
Technical analysis is a method for evaluating price movements in financial markets, emphasizing price charts, chart patterns, trends, trading volume, and indicators. Unlike fundamental analysis, which assesses an asset’s intrinsic value based on economic and financial factors, technical analysis relies on historical price behavior and structured patterns to identify high-probability trading opportunities. Classical technical analysis tools include trendlines, support and resistance levels, price channels, oscillators, and momentum indicators. These tools assist traders in defining market direction, measuring trend strength, and pinpointing precise entry and exit points. Modern technical analysis extends beyond conventional tools, incorporating market structure, liquidity dynamics, and order flow. Advanced methodologies such as price action, the Smart Money Concept (SMC), Inner Circle Trader (ICT) strategies, harmonic patterns, Elliott Waves, and the Read the Market (RTM) approach enable traders to identify institutional liquidity zones, track price manipulation, and refine execution strategies with greater accuracy. TradingFinder offers a comprehensive suite of educational content and analytical tools, bridging classical and modern technical analysis. It equips traders with specialized insights into liquidity models, market structure interpretation, and price movement assessments, enhancing their ability to navigate complex market conditions.
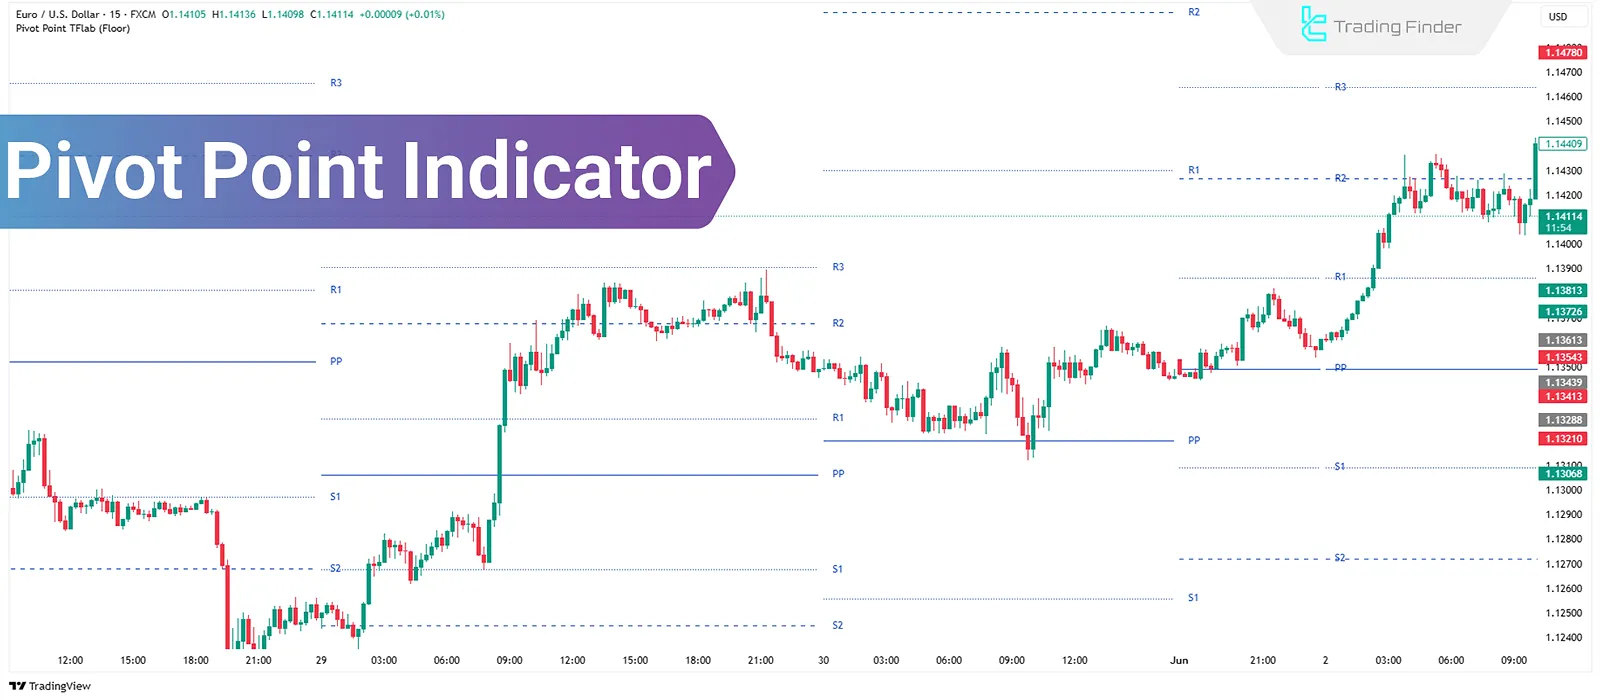
Pivot Point Indicator: Calculation Via Floor, Camarilla, Woodie, and Fibonacci
In technical analysis, trading requires defined levels where price behavior is predictable. The Pivot Point Indicator is designed...
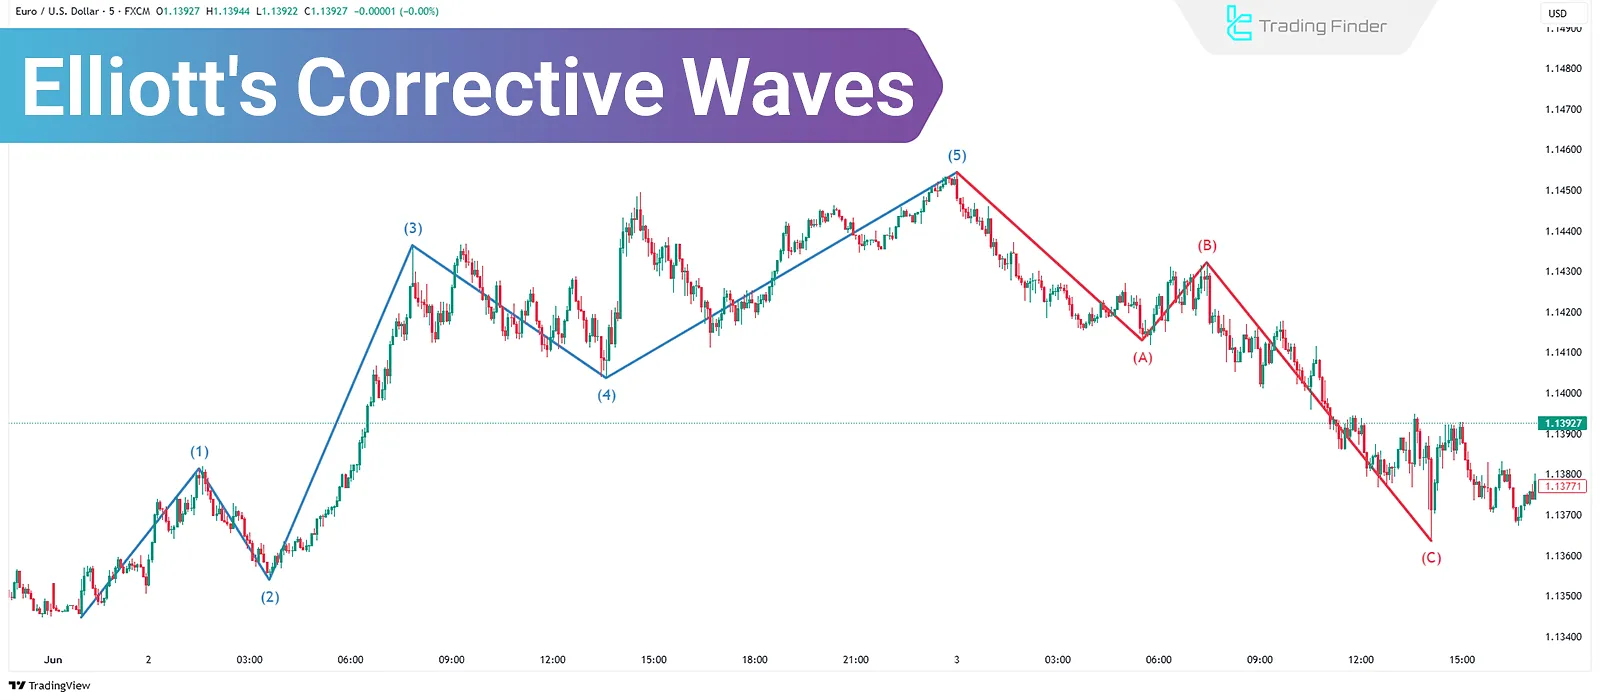
Corrective Waves in Elliott Theory; Training on the Rules of Corrective Waves
Corrective Waves in Elliott Wave Theory are composed of three sub-waves and move against the prevailing trend. Unlike motive...
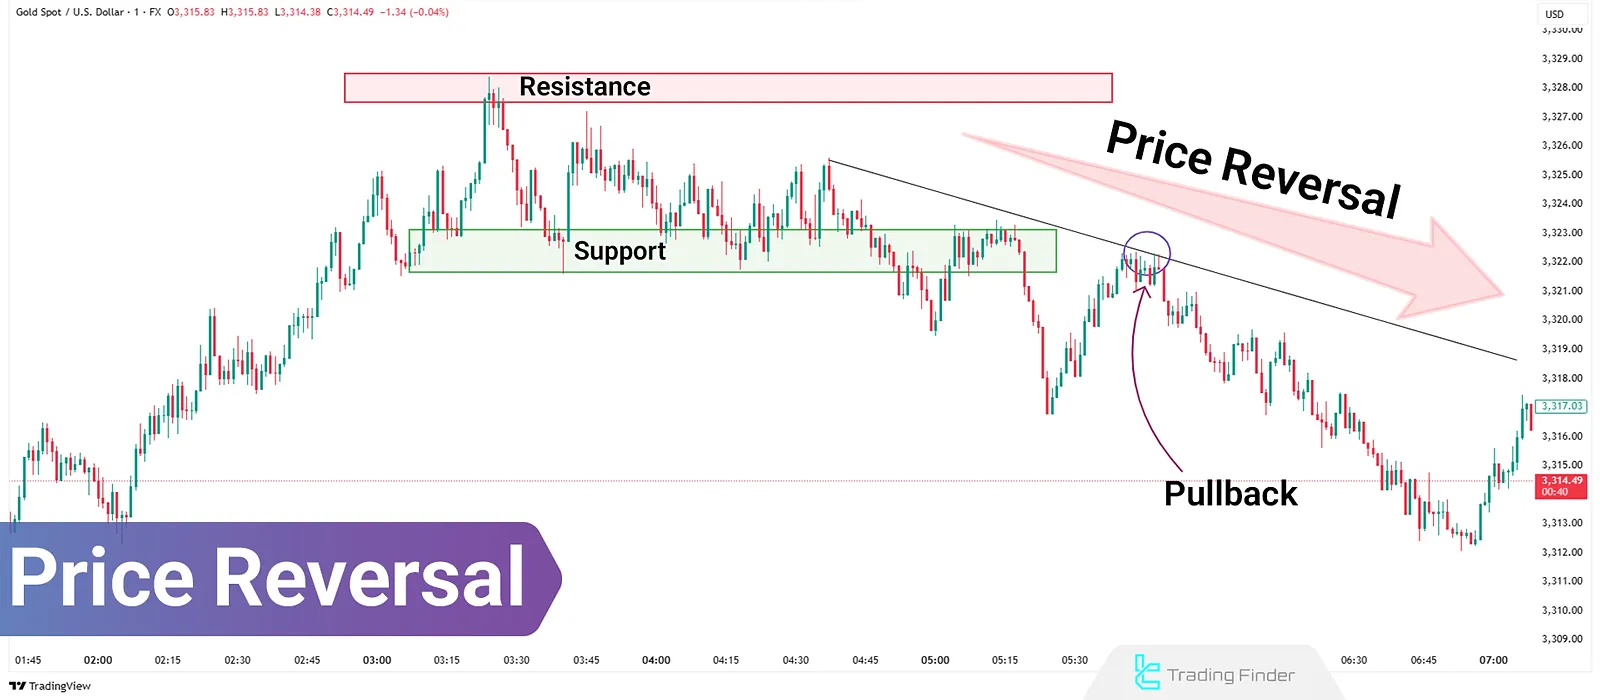
Reversal Trading in Price Action: Candlestick Confirmation and Divergence
In technical analysis, price is constantly changing sometimes moving in a clear direction, sometimes reversing. One of the most...
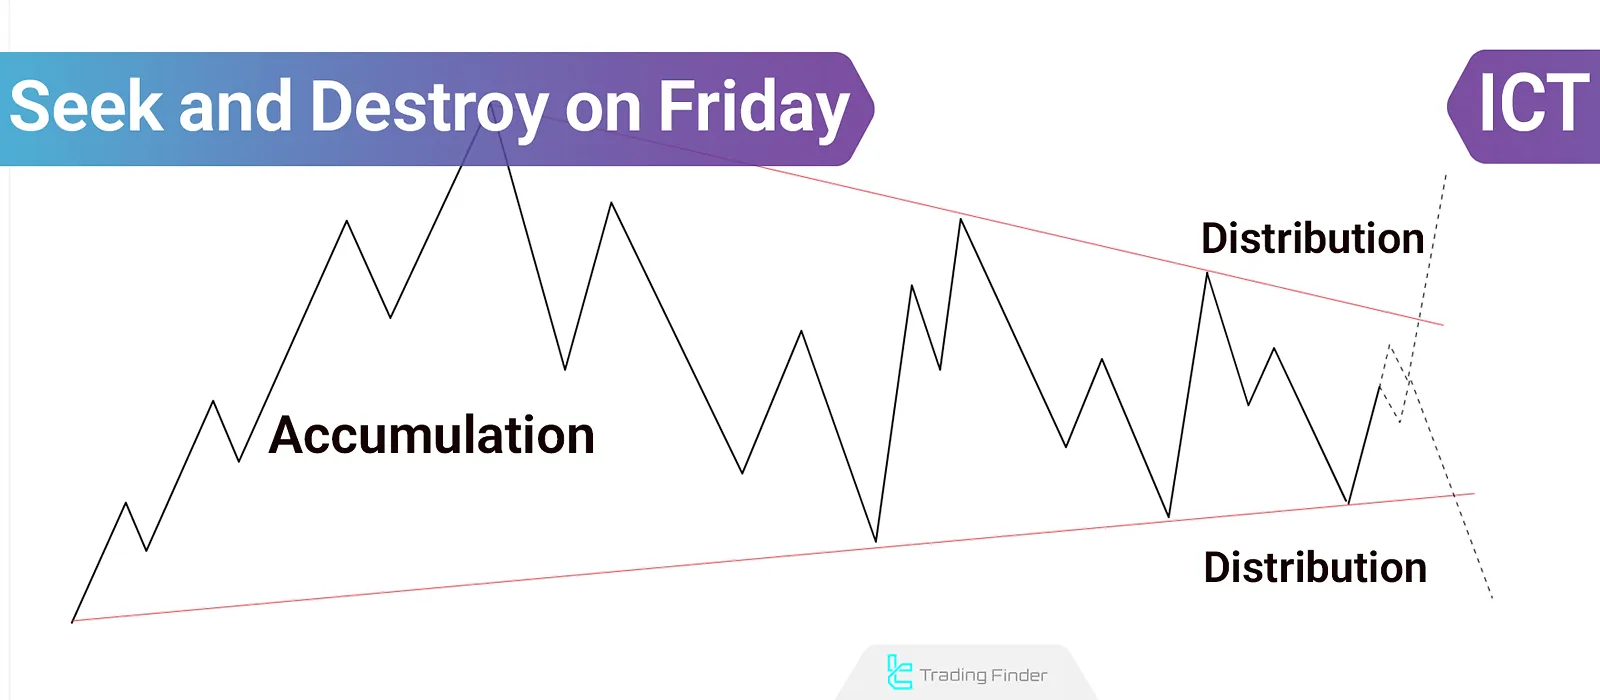
Friday Seek and Destroy Strategy in ICT: Accumulation and Distribution Explained
In the Friday Seek and Destroy strategy within the ICT methodology, the market typically enters an accumulation or distribution...
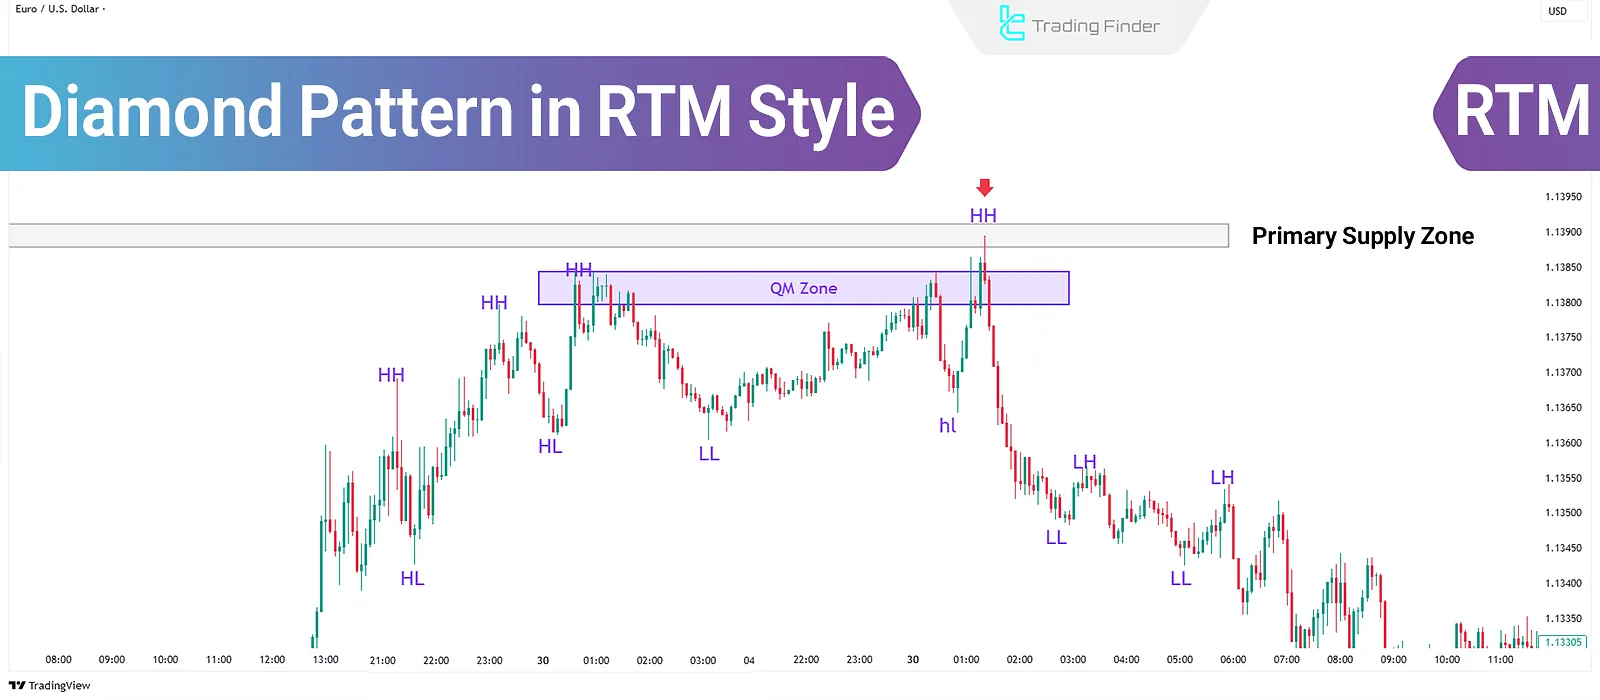
What Is the RTM Diamond Pattern? Trading the Diamond Pattern in the RTM Style
The RTM Diamond Pattern is one of the main patterns in the RTM style that deceives both buyers and sellers. This pattern appears...
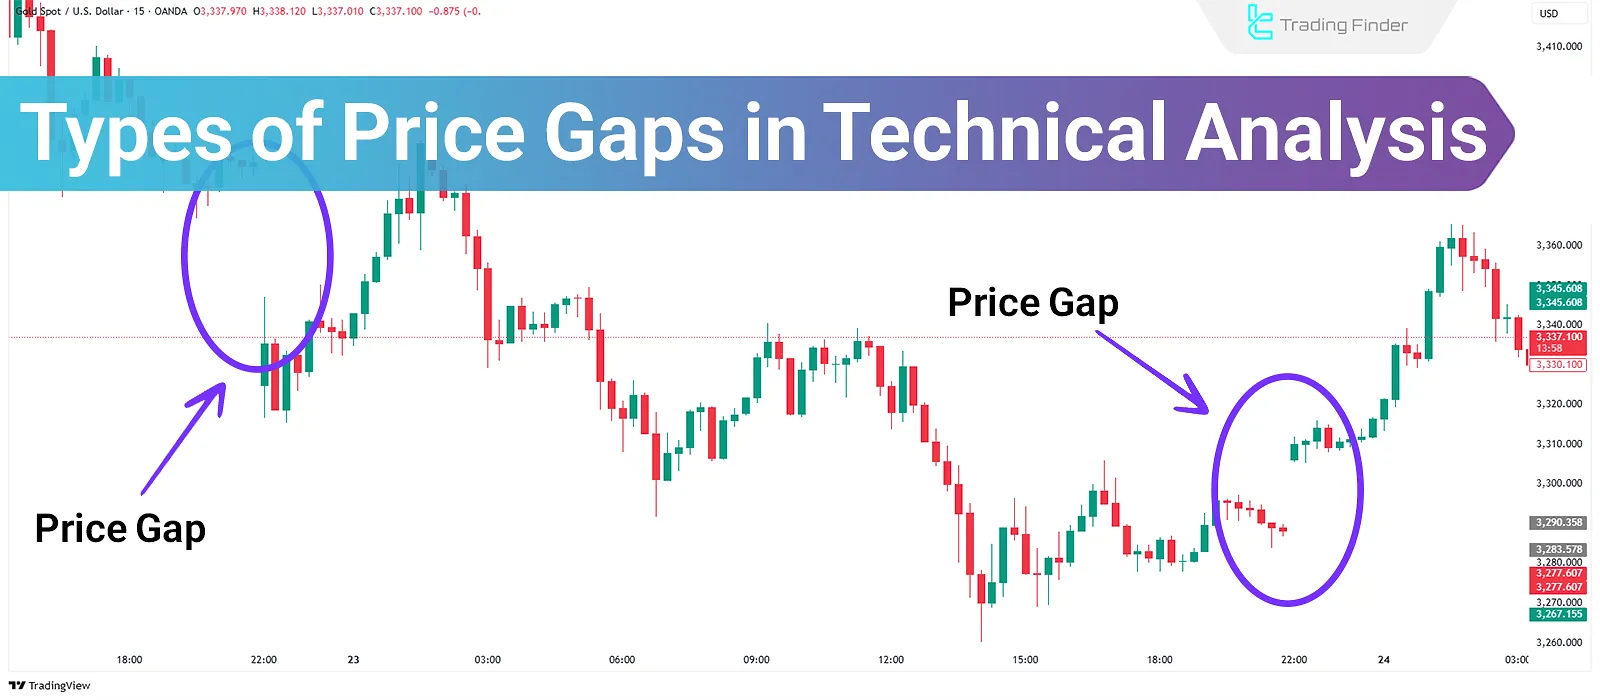
Types of Price Gaps in Technical Analysis – 4 Major Types of Price Gaps
Types of price gaps refer to discontinuities on a price chart where no trading activity has occurred. These types of gaps in...
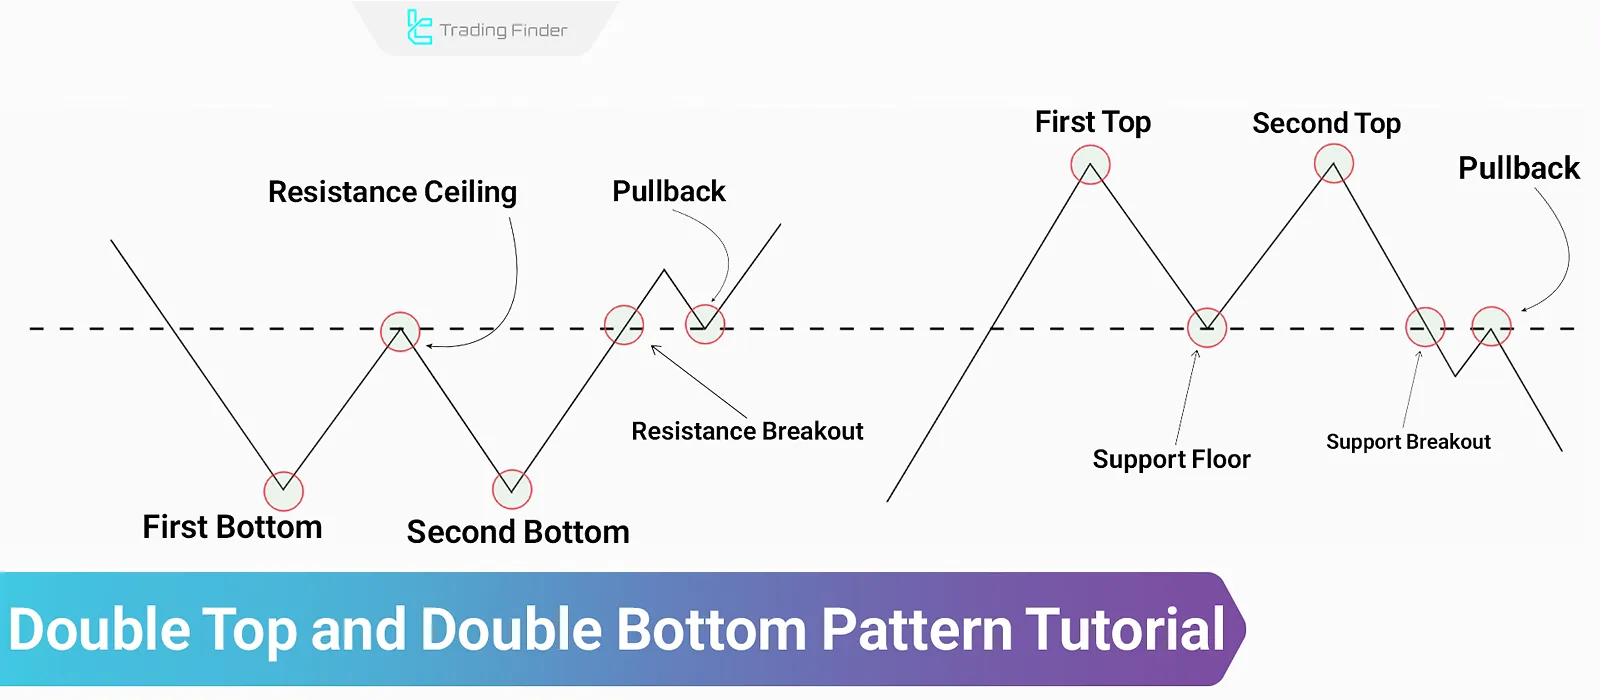
Double Top and Double Bottom – Classic Reversal Pattern
The double top and double bottom patterns are classified under classic reversal patterns in technical analysis. These patterns are...
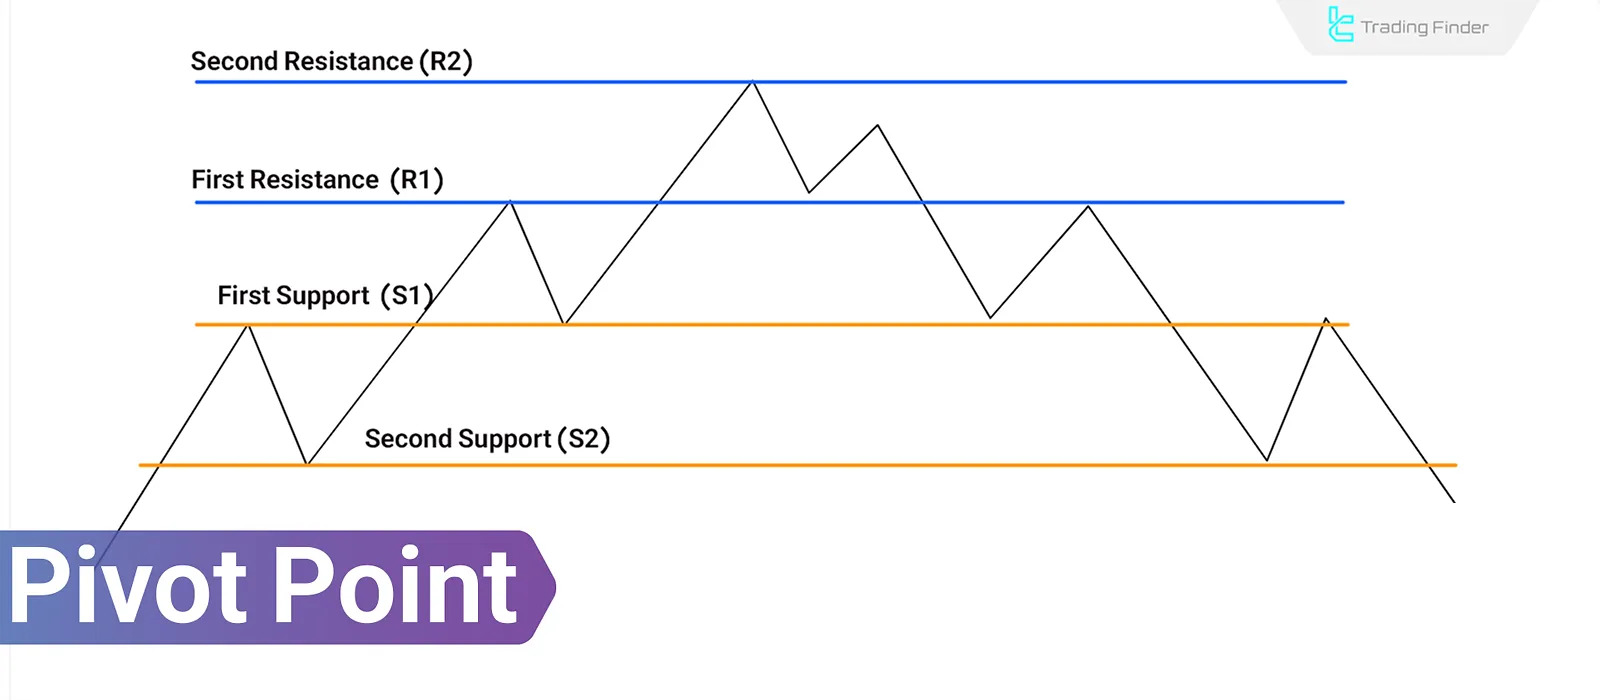
Pivot Point in Technical Analysis: Entry, Exit, Stop-Loss, and Price Targets
A Pivot Point in Technical Analysis is a computational method that identifies key market levels for the next trading day based on...
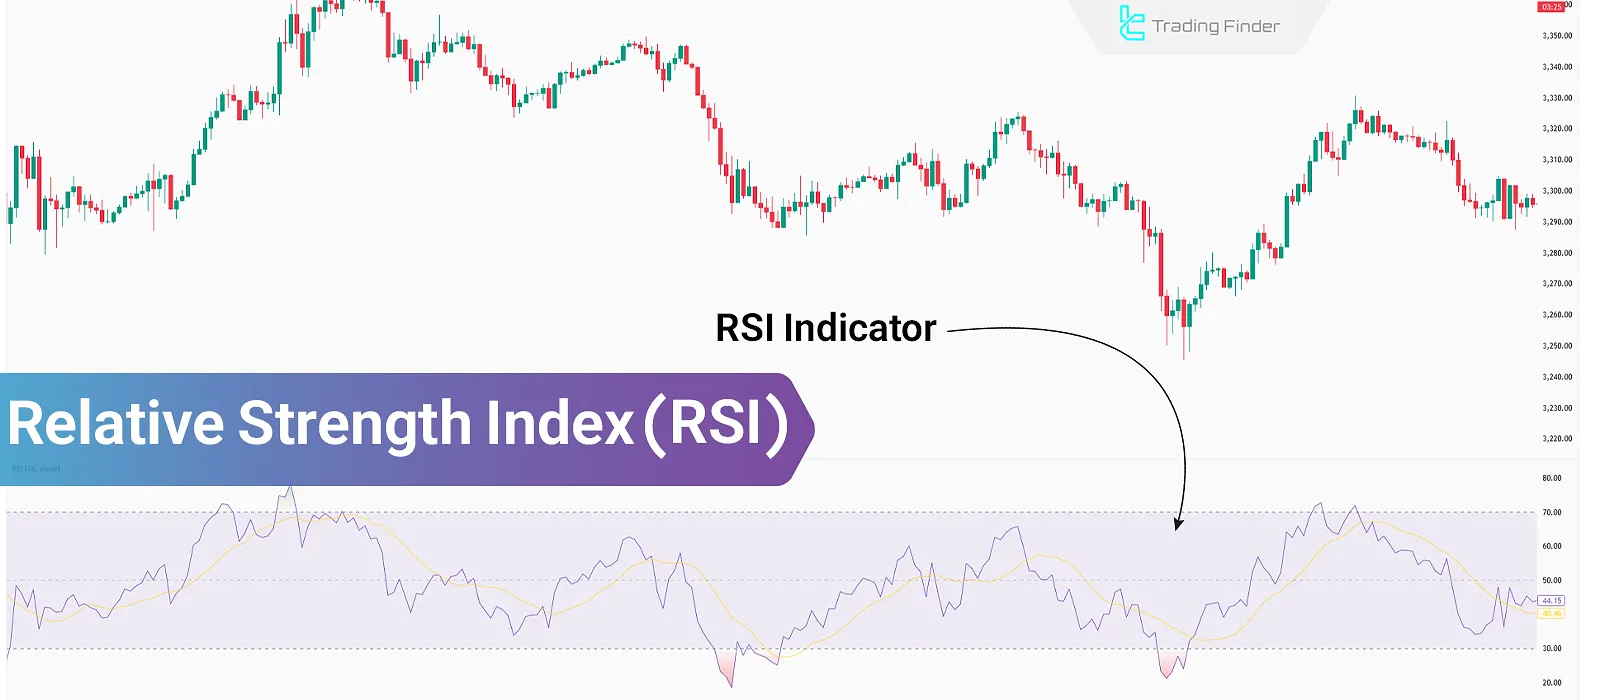
What Is the RSI Indicator? Its Applications and How to Trade It Across Different Markets
The Relative Strength Index (RSI) evaluates the strength of a trend by analyzing the open and close prices of candles over...
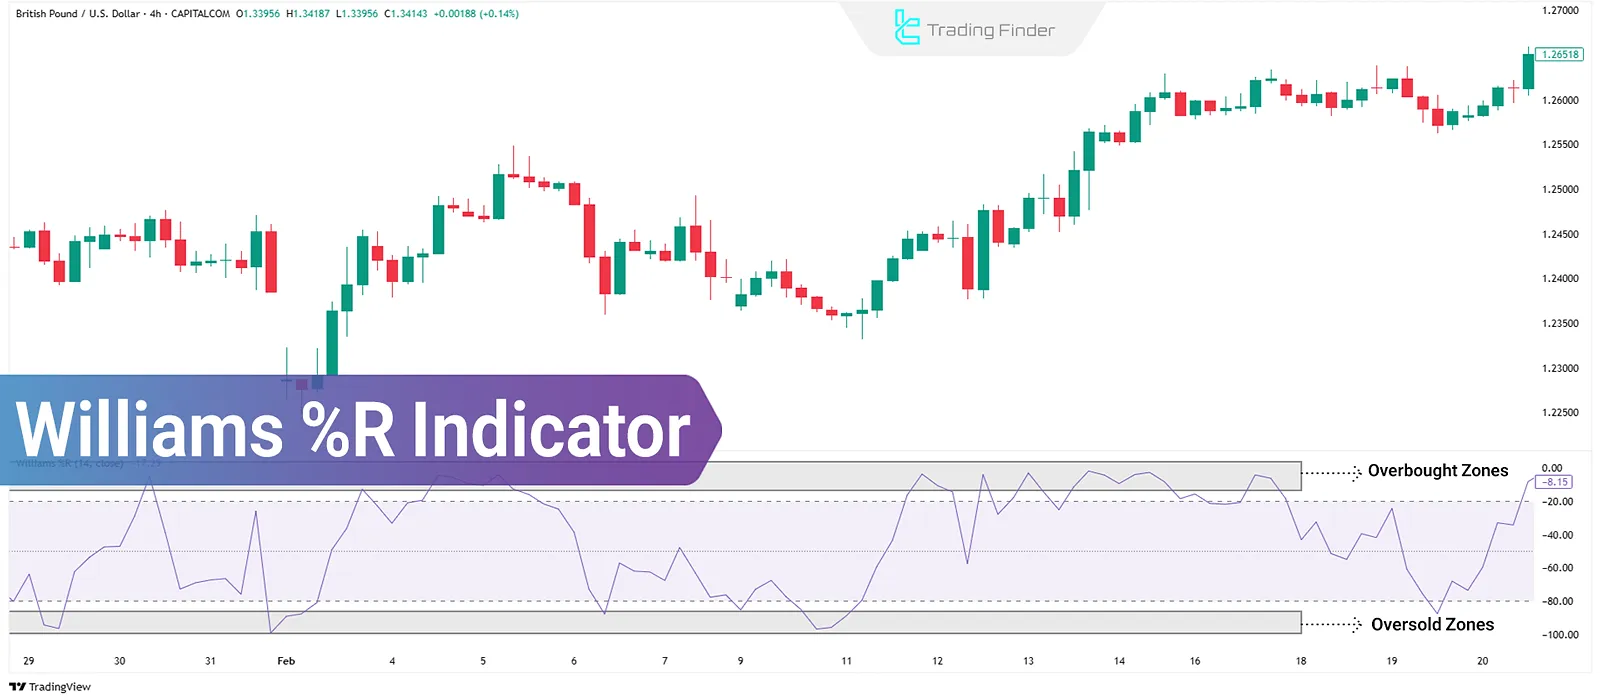
Williams %R Indicator: Overbought/Oversold Detection, Reversal Signals
Indicators are computational tools based on price and volume data, used for technical analysis and generating trading signals....
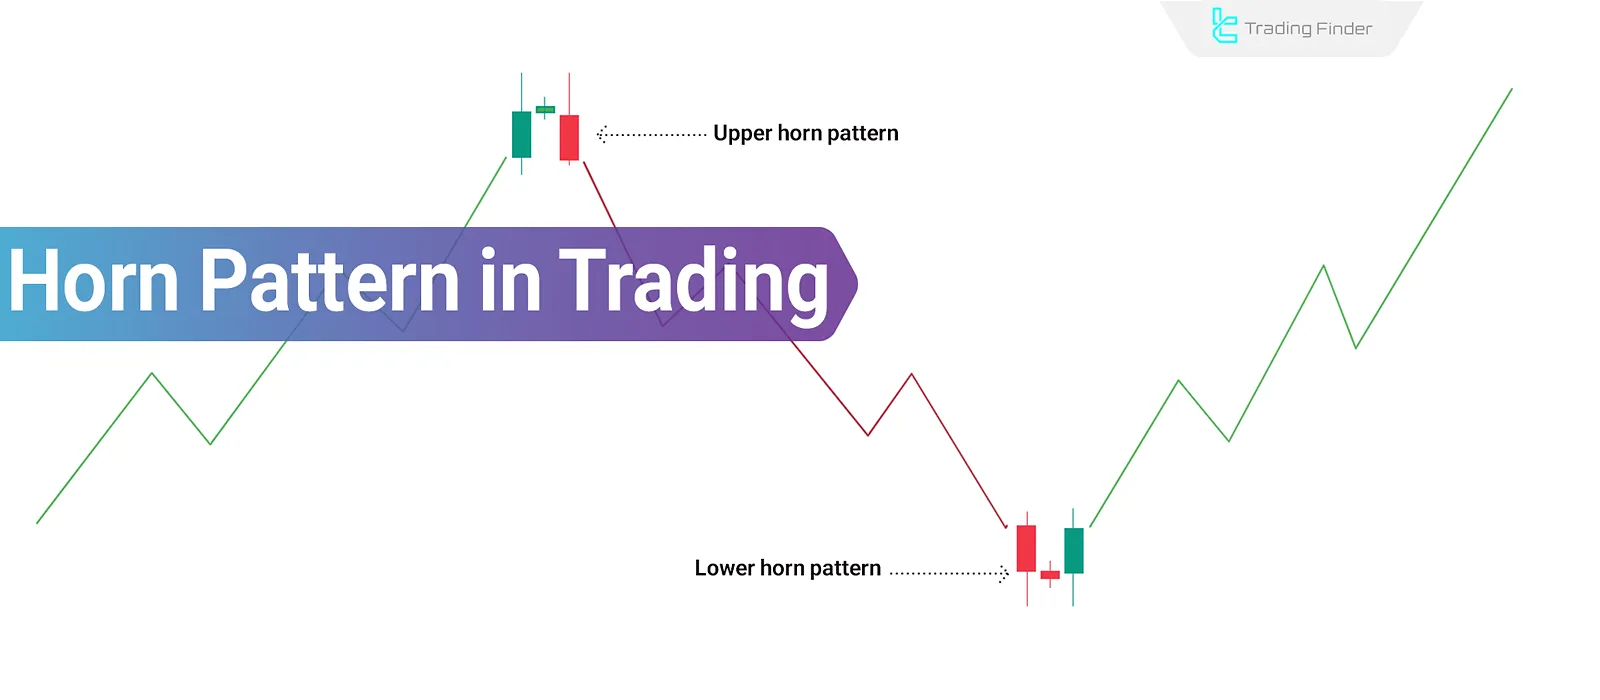
Horn Pattern Trading in Technical Analysis; Horn Top and Bottom
The Horn Pattern in technical analysis is one of the lesser-known reversal patterns that, unlike classical patterns, is based...
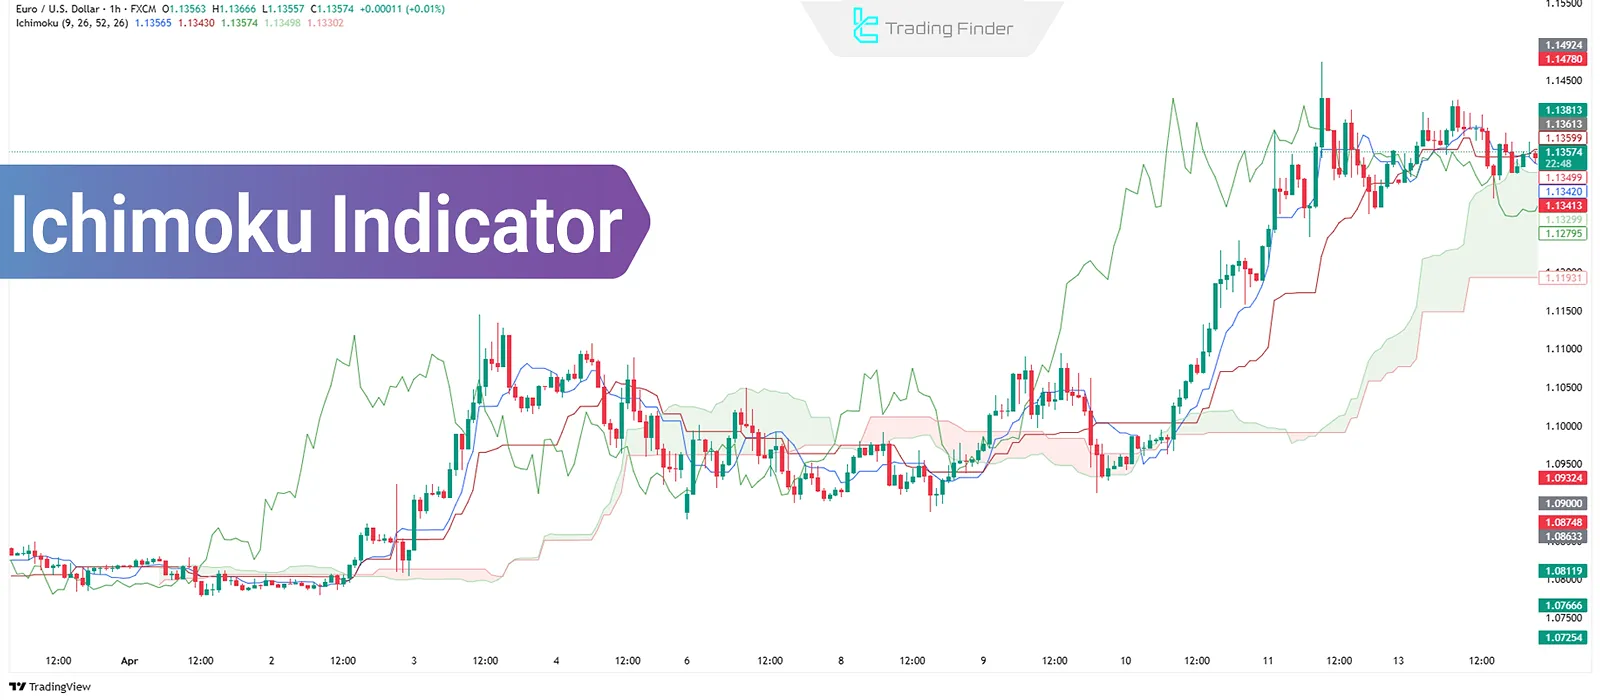
What is Ichimoku? Tenkan-sen, Kijun-sen, Chikou Span, Senkou Span A & B
Ichimoku, as both an indicator and a complete trading system in technical analysis, simultaneously provides information about the...


