


- TradingFinder
- Education
- Forex Education
- Trading Education
Trading Education
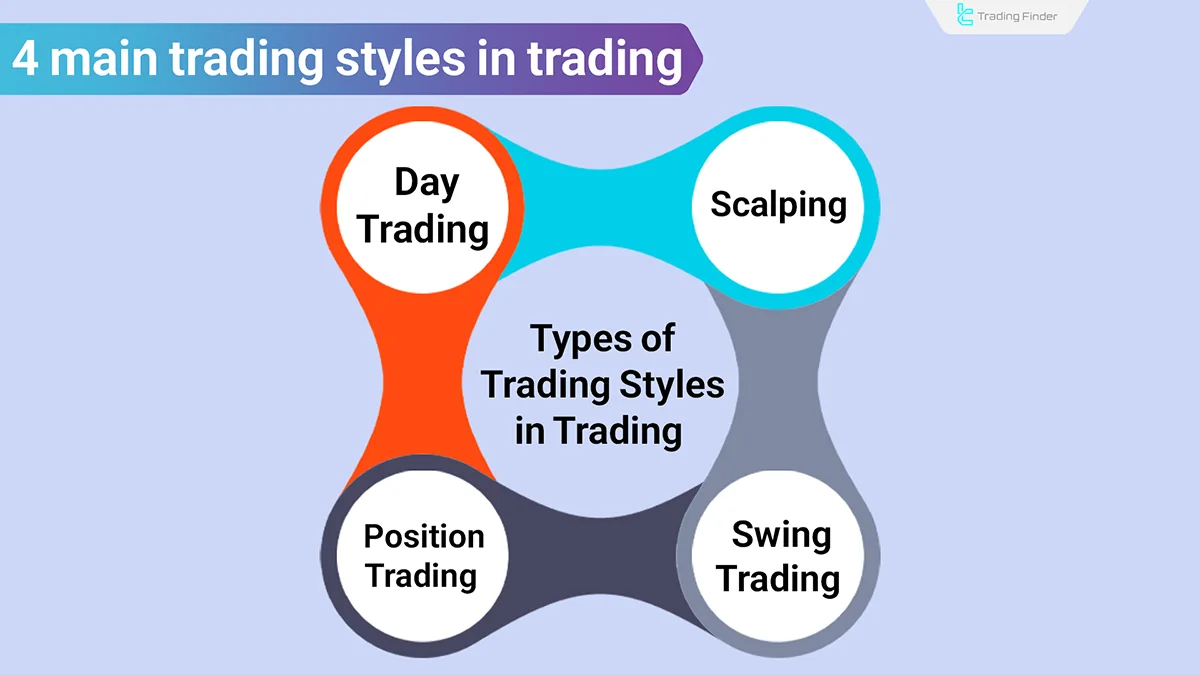
Trading refers to the buying and selling of financial assets with the aim of making a profit from price fluctuations. This activity is based on three main pillars: market analysis, risk management, and selecting a trading style suited to market conditions and individual goals. Market analysis in TradingFinder is divided into two categories: technical analysis and fundamental analysis. In technical analysis, the focus is on price behavior, and the trader identifies trend structures, support and resistance zones, and uses charts, price patterns, indicators, and tools such as price action. In fundamental analysis, TradingFinder utilizes economic data such as interest rates, inflation reports, central bank monetary policies, and corporate financials to analyze the intrinsic value of an asset. Trading styles include scalping, day trading, swing trading, and position trading. The trading style is selected by considering the timeframe used, risk tolerance, available time for trading and type of target market.
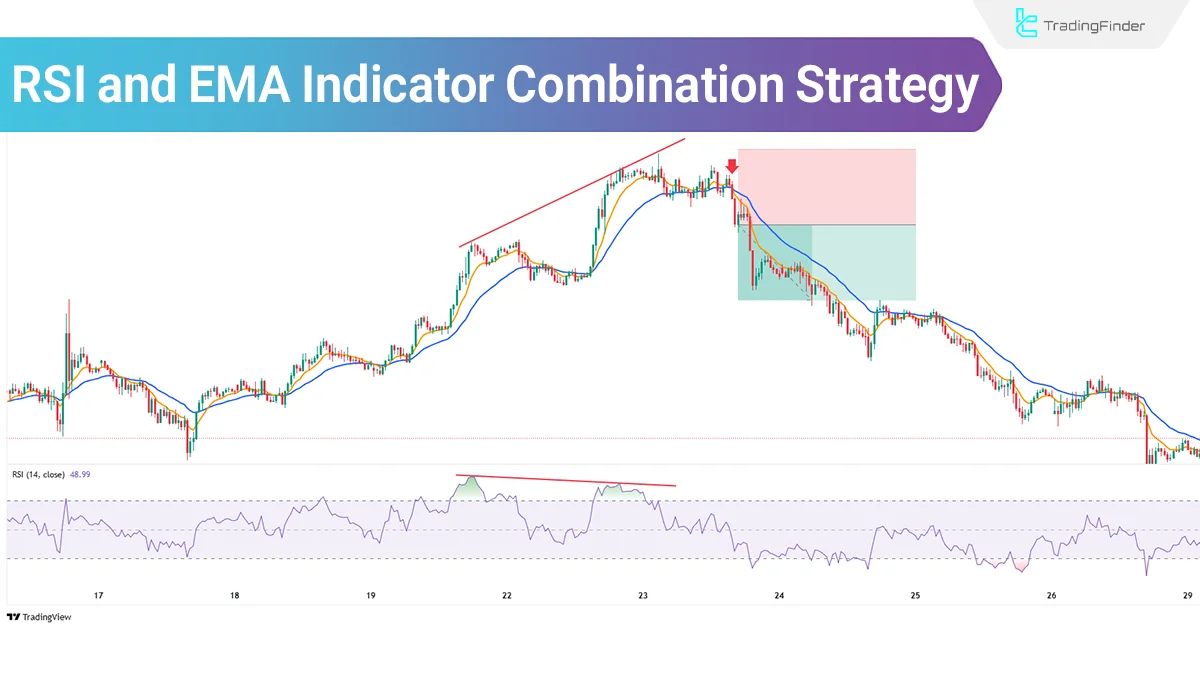
RSI and EMA Strategy: A Trend-Confirmed Momentum Setup
In the strategy combining RSI and EMA, the RSI indicator, by displaying overbought and oversold zones, and the EMA indicator, by...
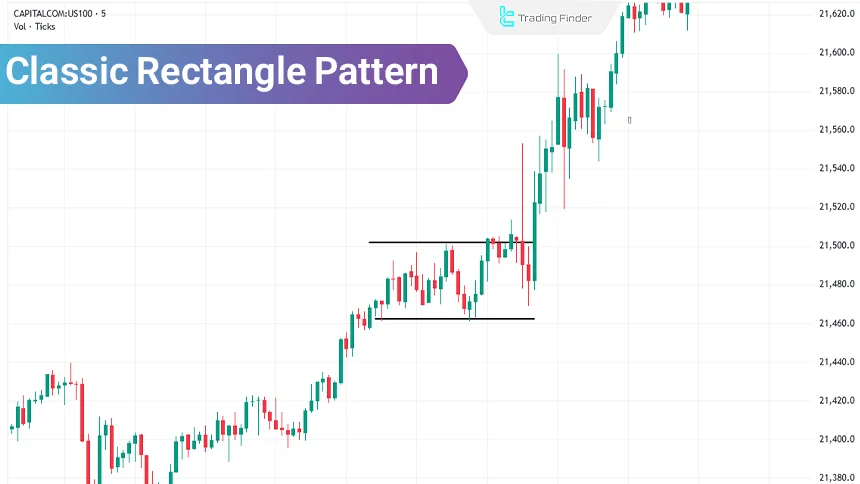
Classic Rectangle Pattern - Trading Strategy Using the Classic Range Pattern
The classic rectangle pattern represents market indecision and an equal balance between buyers and sellers. As a result, this...
Trading Psychology - How to Develop a Winning Trader Mindset
Trading psychology has a direct connection with a set of specific emotions and behavioral patterns. Emotional behaviors in the...
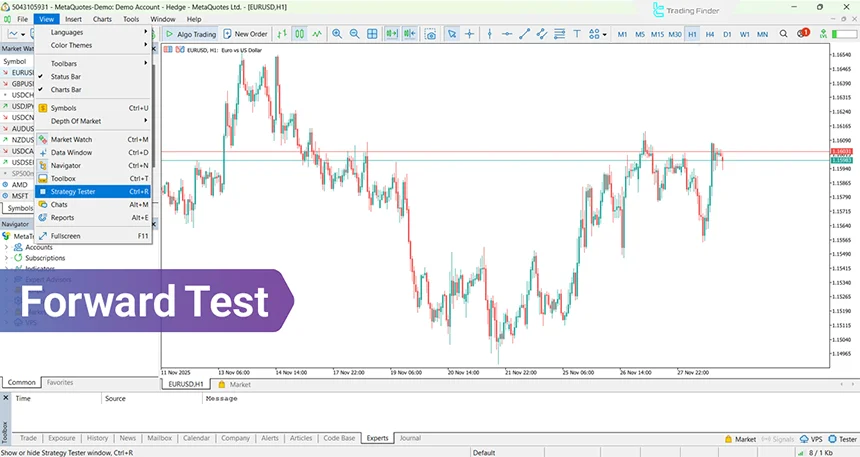
Forward Test: How to Forward Test Trading Strategies
Forward Test is a method for live evaluation of a trading strategy’s performance on real future data; a method that shows how...
What Is a Trading Style? Types of Trading Styles in Financial Markets
Choosing a trading style helps establish discipline in trading and improves the success rate of a trading strategy. Therefore,...
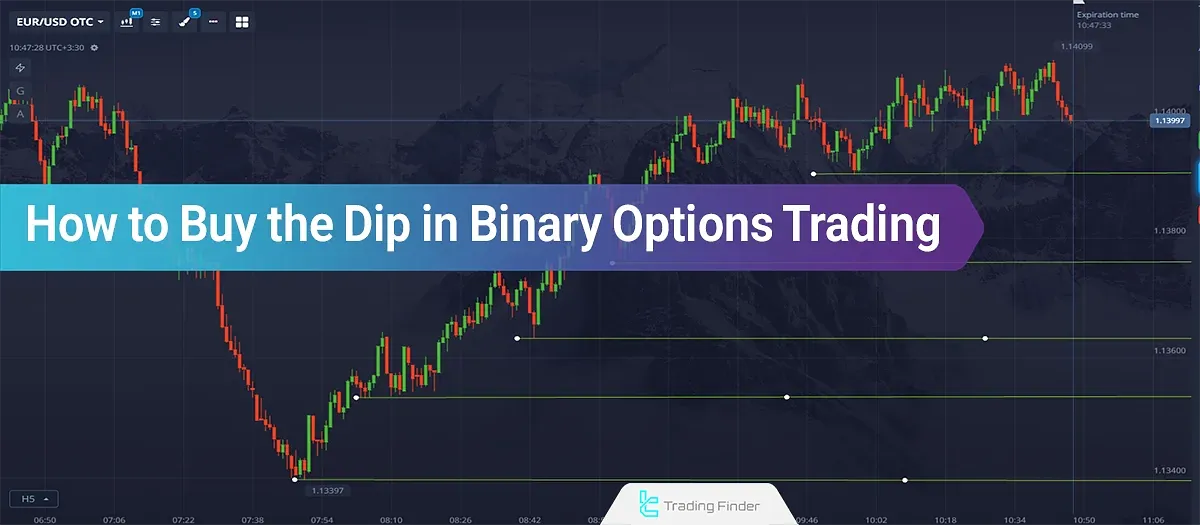
How to Buy the Dip in Binary Options Trading – Dip Buying Strategy
Analyzing price corrections in binary options begins with identifying the market trend and interpreting price behavior within its...
Binary Trading Volume-How to Use Volume in Binary Options
Trading volume in binary options visualizes the intensity of market participation and reports the number of contracts exchanged and...
Prop Trading Journal: Steps for Creation and Periodic Trade Review
In prop systems, every trader operates under the scrutiny of data and discipline. The goal, in addition to profit, is the ability...
Compounding Strategy in Binary Options; Reinvesting Profits in Trades
The Compounding Strategy in Binary Options is a method where the trader does not withdraw profits from each trade. Instead, they...

Automated Trading; Decision-Making with Predefined Logic in Financial Markets
In the Forex market, speed, accuracy, and emotional control are three factors that directly determine a trader’s profit or loss....
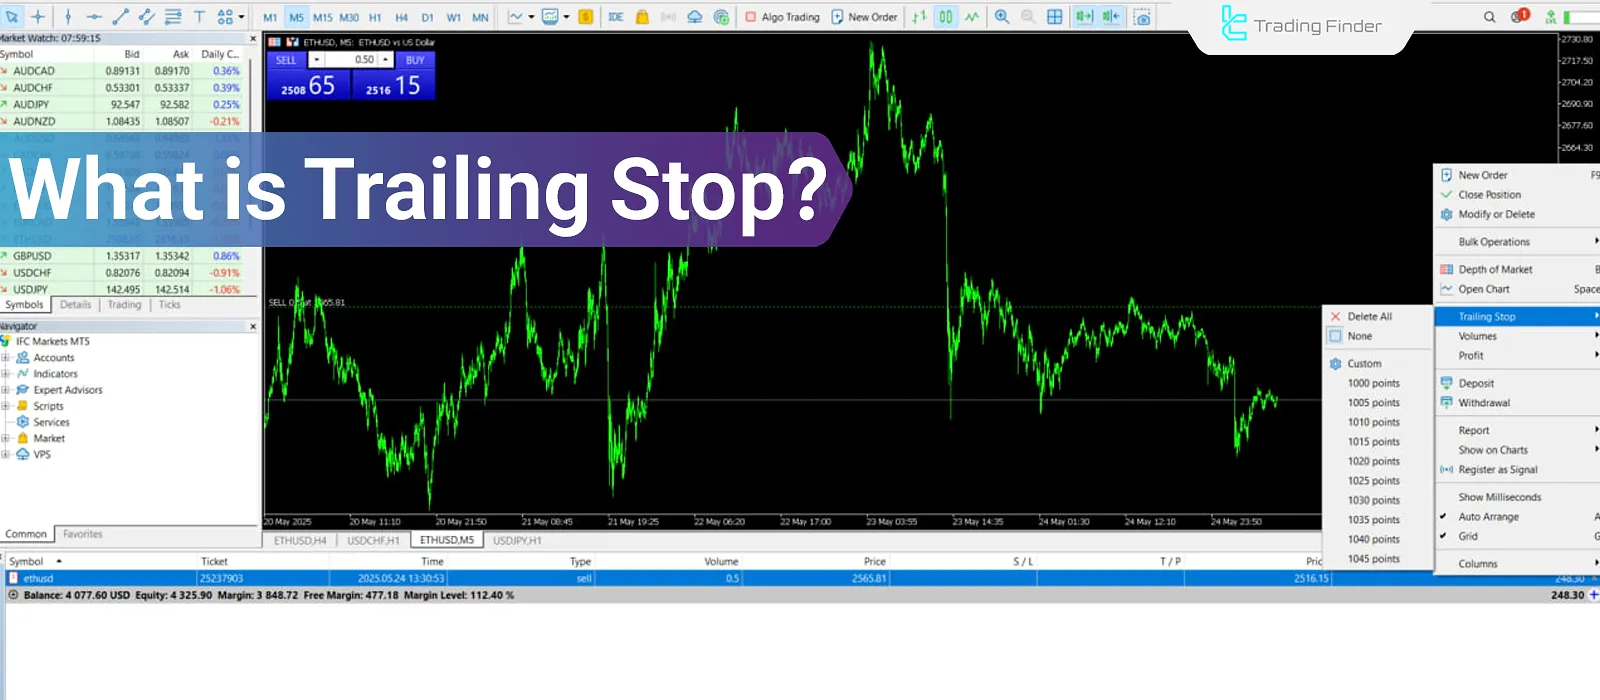
Trailing Stop – The Use of a Dynamic (Floating) Stop Loss in Different Markets
A Trailing Stop is a type of stop-loss order that adjusts according to the instructions defined by the trader. This...
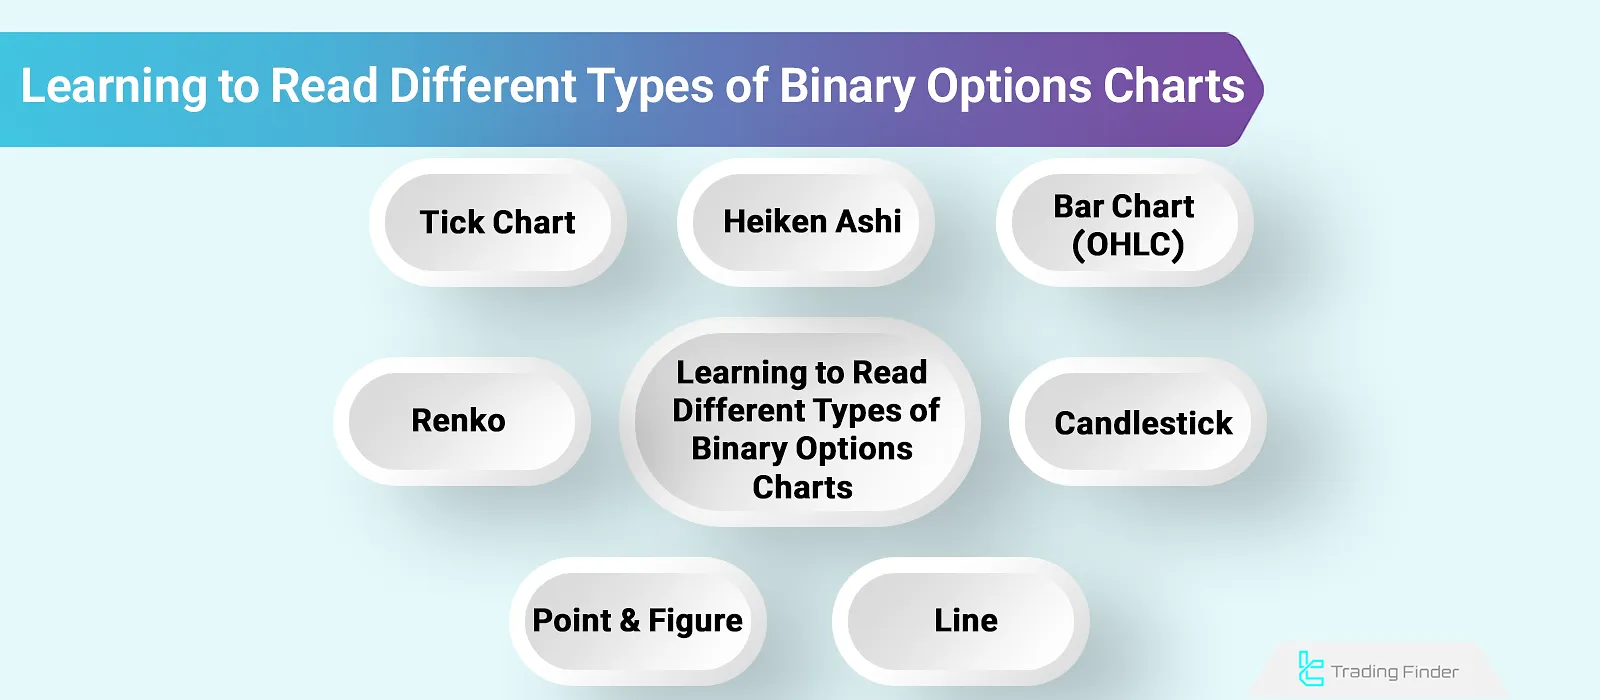
Types of Binary Options Charts (Line, Bar, Heikin Ashi, Tick, and Renko)
In binary options trading, entry and exit timing has a direct impact on profit and loss. Since the trade outcome is simply yes...


