


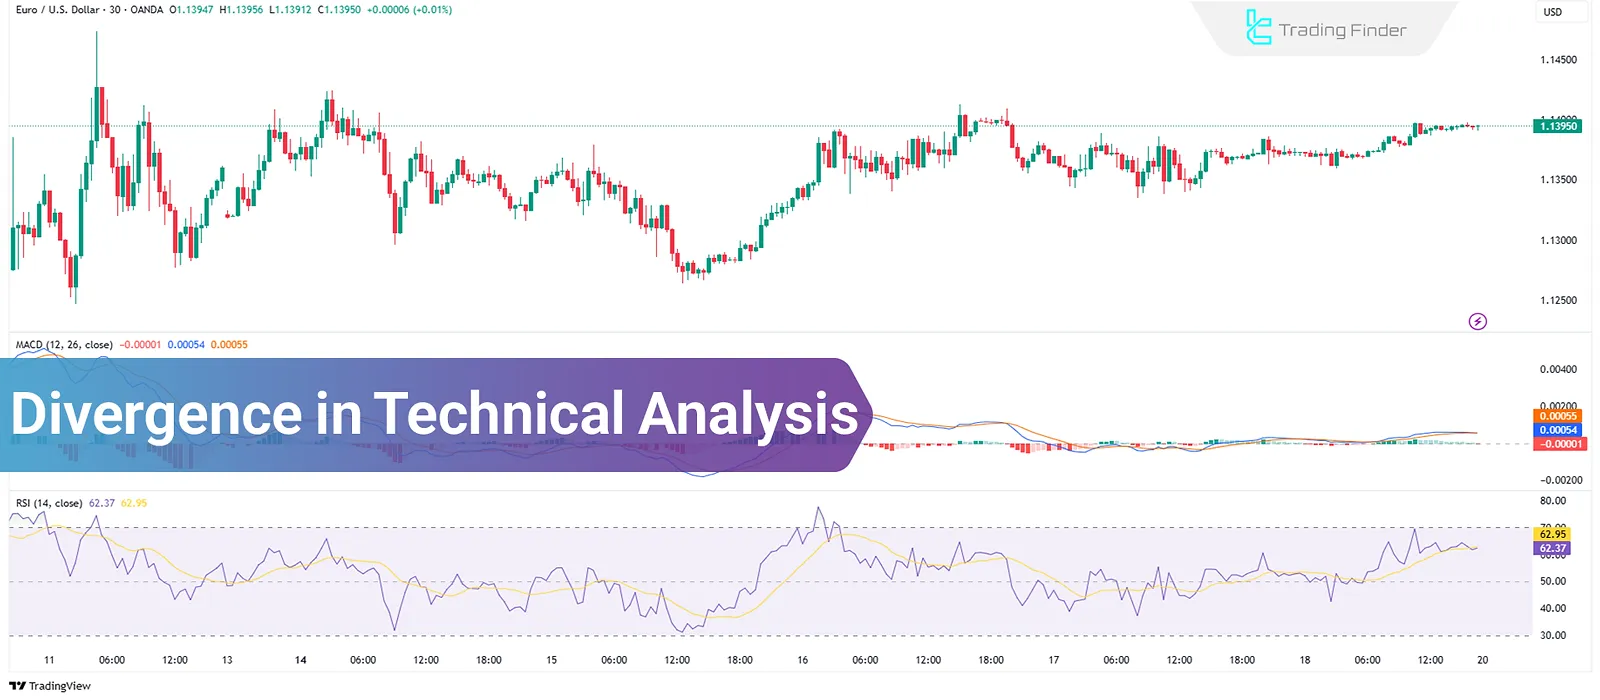
Divergence in technical analysis is a tool used to identify potential changes in price trends. It utilizes indicators to detect trend weakness and determine optimal entry and exit points.
What is Divergence in Technical Analysis?
Divergence occurs when the price of an asset moves in one direction, but technical indicators such as RSI, MACD, Stochastic, or CCI suggest a different path.
This discrepancy signals a potential weakening in the current trend and may indicate a trend reversal or reduced momentum; highlighting potential entry or exit opportunities.
Types of Divergence in Technical Analysis
Divergence is classified into two types:
- Regular Divergence
- Hidden Divergence
Regular Divergence
Occurs when price and a momentum indicator (e.g., RSI or MACD) move in opposite directions.
- If the price makes a higher high but the indicator shows a lower high, a bearish (negative) divergence forms suggesting a potential downward reversal;
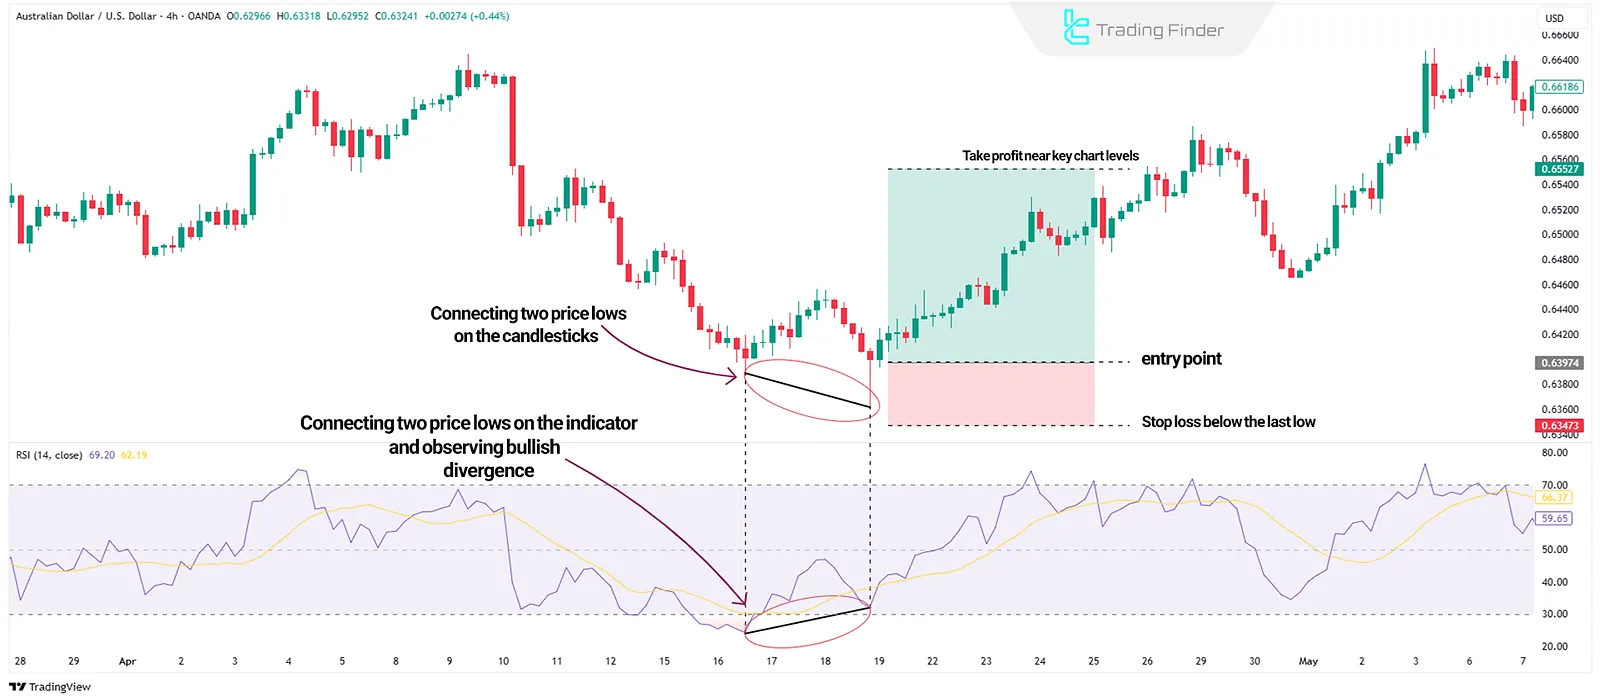
- If the price makes a lower low while the indicator shows a higher low, a bullish (positive) divergence appears indicating a possible upward reversal.
This type is commonly seen at the end of trends and signals weakness in the current price move.
Hidden Divergence
Hidden Divergence signals trend continuation and often appears during market corrections.
- For instance, if the price forms a higher low but the indicator shows a lower low, it’s a bullish hidden divergence, suggesting the uptrend may continue.
How to Trade with Divergence?
Trading with Divergence involves multiple steps:
#1 Identifying Divergence
Use indicators like RSI, MACD indicator, or Stochastic to confirm Divergence by comparing highs and lows of the indicator with the price.
#2 Confirming Divergence
Validate signals using other tools such as candlestick patterns, trendlines, or Fibonacci levels.
#3 Entering the Trade
- For bullish Divergence, consider entering a buy trade;
- For bearish Divergence, consider entering a sell trade.
#4 Risk Management
Set a stop loss to limit potential losses if the market moves against the position. Take-profit levels can be aligned with key chart levels and Fibonacci targets.
Divergence in Forex and Other Markets
Divergence is widely used in the Forex market to analyze currency trends. Since Forex trading heavily relies on technical analysis, Divergence is a key tool for identifying potential trend reversals. It is also applied in stocks, cryptocurrencies, and commodities.
Conclusion
Divergence is a valuable technique in technical analysis for detecting trend shifts. It helps identify optimal entry and exit points and is most effective when combined with other tools, such as MACD and RSI indicators.


