


Operating in financial markets requires thorough analysis and the development of an effective trading strategy to achieve consistent profits. Every strong trading strategy must be carefully tested and evaluated across different markets, various instruments, and multiple timeframes.
Running multiple tests in the live market leads to losses in your live trading account and is not logical. Therefore, you should use demo accounts and various manual tools (such as Bar Replay in TradingView) or automated ones for Backtest execution.
What is Backtest?
Backtest is a method of evaluating a trading strategy using historical market data. In fact, Backtest is one of the essential skills that every trader must learn to review their trading system.
Backtesting is a method that allows you to assess different performances across various markets and different periods.
What are the Pros and Cons of Backtest?
Backtest is a tool for analyzing the performance of trading strategies, by examining historical data, enables the evaluation of profitability and risk. However, like any other analytical tool, this approach has its own strengths and weaknesses.
Table of pros and cons of backtesting:
Advantages | Disadvantages |
Analyzing the historical performance of a strategy and evaluating profitability, risk, and return ratios | Uncertainty in generalizing results to the future due to changes in market structure and behavior |
Identifying strengths and weaknesses of trading logic; detecting successful and ineffective patterns | Risk of over-optimization (Overfitting) and excessive conformity to past data |
Parameter optimization and tuning key variables to improve performance | Ignoring real market variables; omitting slippage, spread, commissions, and liquidity |
Saving time and cost by testing strategies without real risk | Potential errors in data or programming logic; incomplete data or incorrect calculation logic |
Assessing adaptability to market conditions and reviewing performance in bullish, bearish, and ranging markets | False confidence in the strategy and misinterpretation of positive past results |
Increasing trader confidence and mental stability by confirming performance on past data | Limitations of free or public backtesting tools; lack of precise data and limited capabilities |
Reproducibility and documentation of the strategy; recording and repeating the process and results | Ignoring behavioral and psychological factors; not simulating human decision-making |
How to Backtest a Trading Strategy in Different Markets
The Backtest process is usually done manually, but it can also be automated by various softwares on MetaTrader and TradingView.
- Manual: traders manually review historical data and execute their strategy based on that data;
- Automated: backtesting software (such as MetaTrader 4 and 5 or exchanges’ dedicated tools and simulators like SoftFx) is used to run the trading strategy on historical price data.
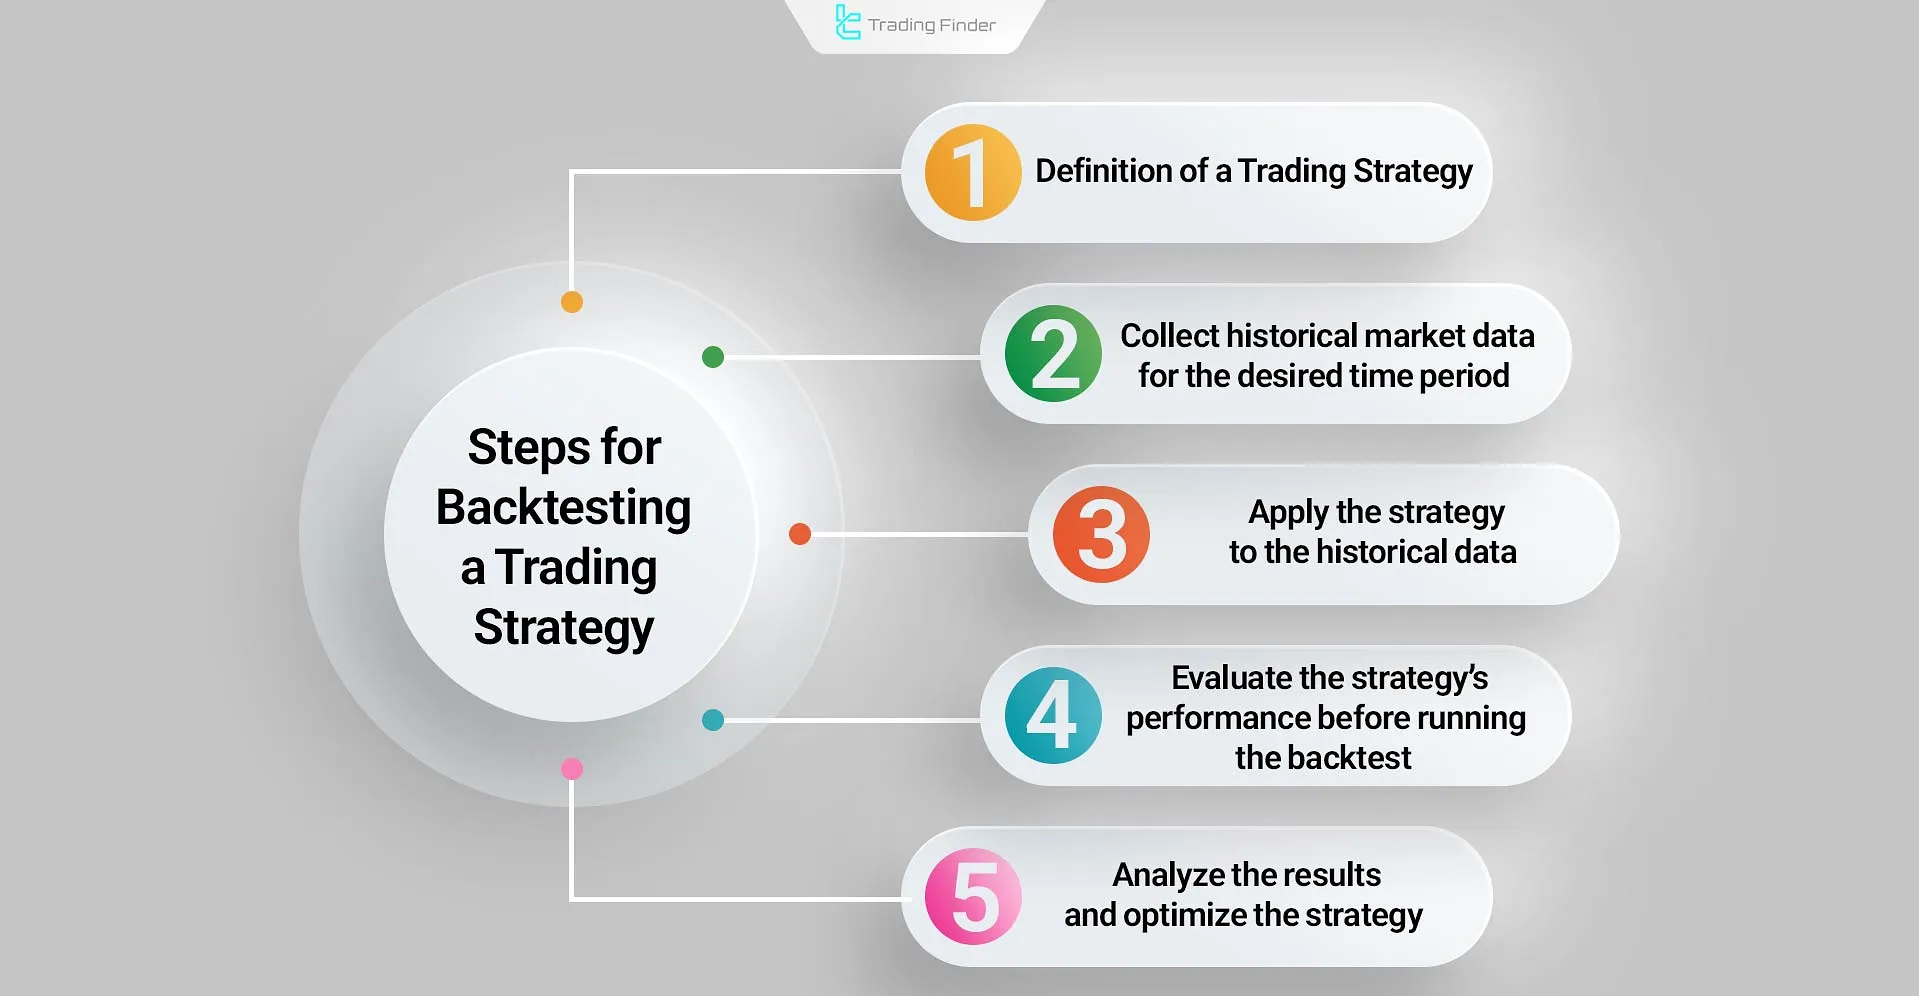
To backtest a trading strategy, follow the steps below:
- Define the trading strategy;
- Collect historical market data for the desired period;
- Run the strategy on the historical data;
- Evaluate the strategy’s performance prior to Backtest;
- Analyze results and optimize the strategy.
#1 Define the Trading Strategy
Before starting the Backtest, you must fully and clearly define your trading strategy. This definition should include the entry and exit criteria, indicators used, trading timeframe, and all other relevant items.
The foundation of your entire backtesting process is formed at this stage and should be documented in writing.
#2 Collect Historical Market Data for the Desired Period
Collect historical market data for your desired period accurately. These data include prices, volumes, and other important factors (such as daily economic and political news).
The importance of historical data in the Backtest process is very high, and its accuracy and integrity play a decisive role in the Backtest result.
#3 Run the Strategy on the Historical Data
Using historical data, apply your trading strategy. To automate this process, you can use trading Backtesting software, or simulate trade smanually by following the specific rules of your strategy.
Be sure to record stop-loss (Stoploss) and take-profit (Takeprofit) levels for future reviews.
#4 Evaluate the Strategy’s Performance Prior to Backtest
Measure and record the results of each simulated trade. Examine points such as profit and loss, win rate, risk-to-reward ratio, maximum drawdown, and annual return. This type of analysis leads to a better understanding of the strategy’s past performance.
#5 Analyze Results and Optimize the Strategy
By reviewing result trends, adjust parameters, indicators, and strategy rules as needed based on strengths and weaknesses in the obtained data. To assess the impact of parameter changes on results, perform the Backtest again and repeat the steps.
Each small change in the strategy may bring significant changes in backtesting results and requires high accuracy and focus.
For a better understanding of how to backtest a trading strategy, you can refer to the educational video by the YouTube channel The Moving Average.
Practical Example of Backtesting a Moving Average Crossover Strategy on the EUR/USD Pair
To precisely evaluate the performance of the Backtest, the exponential moving average (EMA) crossover strategy with EMA (20) and EMA (50) settings on the EUR/USD pair in the H1 timeframe was tested. In this strategy:
- A bullish crossover occurs when EMA (20) crosses above EMA (50) from below, generating a Buy signal;
- A bearish crossover forms when EMA (20) crosses below EMA (50) from above, generating a Sell signal;
- Stop Loss was set at 50 pips and Take Profit at 100 pips.
Historical data from January 2022 to January 2023 were extracted via the MetaTrader platform. The Backtest was performed in Every Tick mode and the following parameters were applied:
- Spread: fixed at 1 pip
- Commission: $7 per lot
- Initial Deposit: $10,000
- Leverage: 1:50
With the initial execution (EMA 20/50) in the first test, the strategy recorded a total of 185 trades and yielded the following results:
- Win Rate: 61%
- Profit Factor (PF): 68
- Drawdown (DD): 7%
- Annual Return: 27%
Subsequently, various moving average combinations were tested, and the best performance was achieved with EMA(15/45). Performance metrics improved as follows:
- Win Rate: 64%
- Profit Factor (PF): 84%
- Drawdown (DD): 9%
- Annual Return: 31%
For validation and to ensure robustness and to avoid over-optimization (Overfitting), Out-of-Sample (OOS) data were examined. The test results were as follows:
- Profit Factor (PF): around 1.55
- Win Rate: around 62%
In addition, Walk-Forward Analysis and Monte Carlo Simulation confirmed the stability and consistency of the results, indicating that the strategy performs reliably under different market conditions.
The EMA (15/45) strategy, considering real costs including spread, commission, and slippage, showed profitable, stable, and realistic performance.
However, reduced returns were observed during economic news releases. To enhance adaptability and maintain performance stability, the following actions are recommended:
- Add a News Filter to exclude trades during high-volatility periods;
- Use Dynamic Position Sizing aligned with market changes;
- Employ a Trailing Stop based on ATR (Average True Range) to lock in open profits.
The backtesting tutorial article on investopedia.com provides more details about Backtesting that enthusiasts can refer to.
What is the Difference Between Backtest and Forward Test?
Backtest is conducted by analyzing historical market data to evaluate the potential performance of a strategy under historical conditions. In contrast, Forward Testing evaluates the same strategy based on new data and in the real market environment.
Backtest results are obtained faster but, due to reliance on past information, have limited accuracy. Forward Test takes more time but shows the strategy’s alignment with the real market’s behavior more precisely.
The table below reviews the differences between Backtest and Forward Test:
Feature | Backtest | Forward Test | Combined interpretation |
Data source | Historical data | Live or new data | Coverage of past and present market |
Execution environment | Past simulation | Real market conditions | Comprehensive assessment of strategy fit |
Analysis time | Fast and repeatable | Time-consuming and gradual | Balance between speed and accuracy |
Risk of error | High likelihood of over-optimization | Less bias | Control and final validation of results |
Level of realism | Limited to past data | Aligned with real market behavior | Practical validation of the strategy |
Main application | Initial evaluation | Final testing | Complementary combination for precise decision-making |
What are the Key Factors in Backtest?
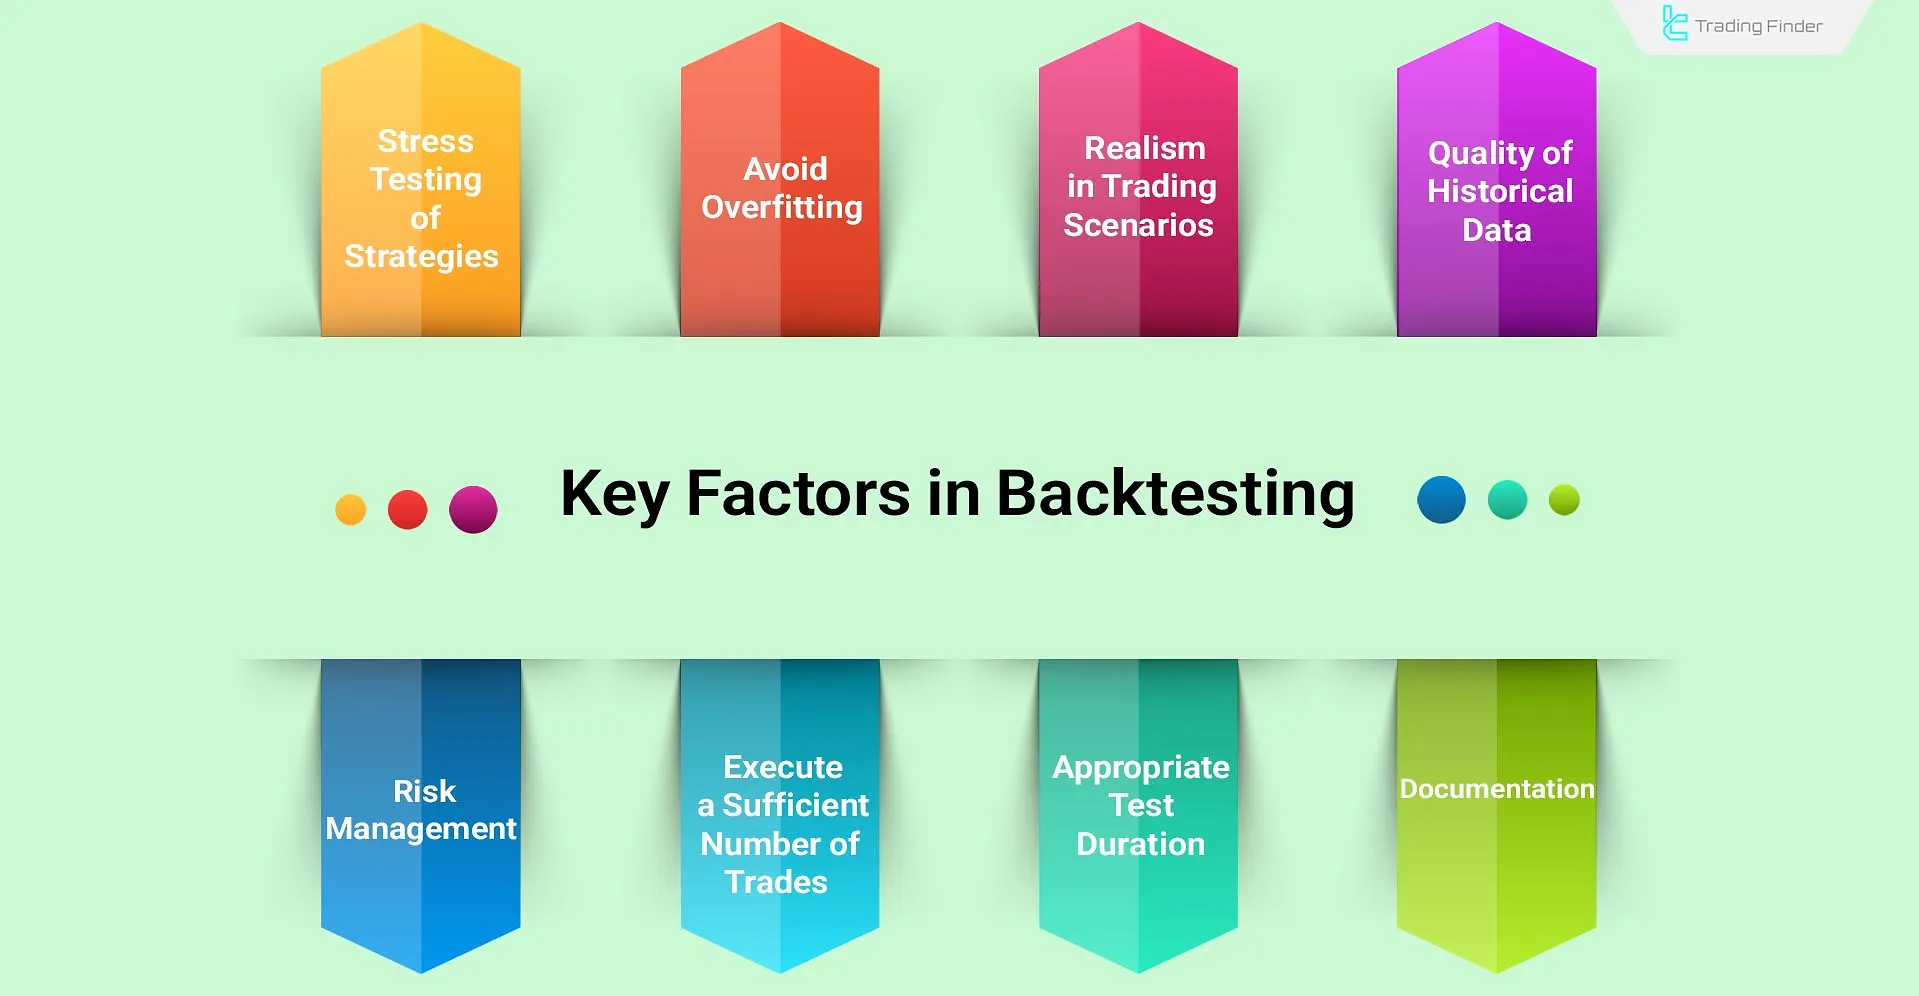
No matter which method you use for Backtest; when using Backtest, paying attention to the following key points is essential:
- Quality of historical data: ensure the accuracy and reliability of past price data and use credible sources;
- Realism of trading scenarios: calculate and include transaction costs (including commissions, slippage, etc.) and market conditions to evaluate in real-world conditions;
- Avoiding Overfitting: avoid excessive optimization of the strategy in Backtest;
- Stress testing strategies: evaluate the strategy’s performance under abnormal market conditions to identify weaknesses and hidden risks;
- Risk management: accurately simulate how risk is controlled in a trading strategy to achieve more realistic, reliable Backtest results that are closer to live-account performance;
- Sufficient number of trades: run at least 100 trades depending on the trading timeframe for statistical validity;
- Appropriate test duration: cover at least 6 months to 3 years of data to include different market cycles;
- Documentation: document code, entry and exit rules, and risk management criteria.
Backtesting Tutorial in TradingView
For traders seeking to review their strategies’ performance without coding, the Bar Replay tool on the TradingView platform provides an effective method to perform manual Backtest.
This capability allows users to reconstruct the market step by step and observe how their strategies behave under real conditions.
To learn manual Backtest in TradingView, follow these steps:
#1 Select the Starting Point on the Chart
First, open the chart of the desired asset and, from the top toolbar, click on “BarReplay”; then select a point from the chart’s past; from this stage onward, subsequent candles are hidden, and you can reconstruct the market candle by candle.
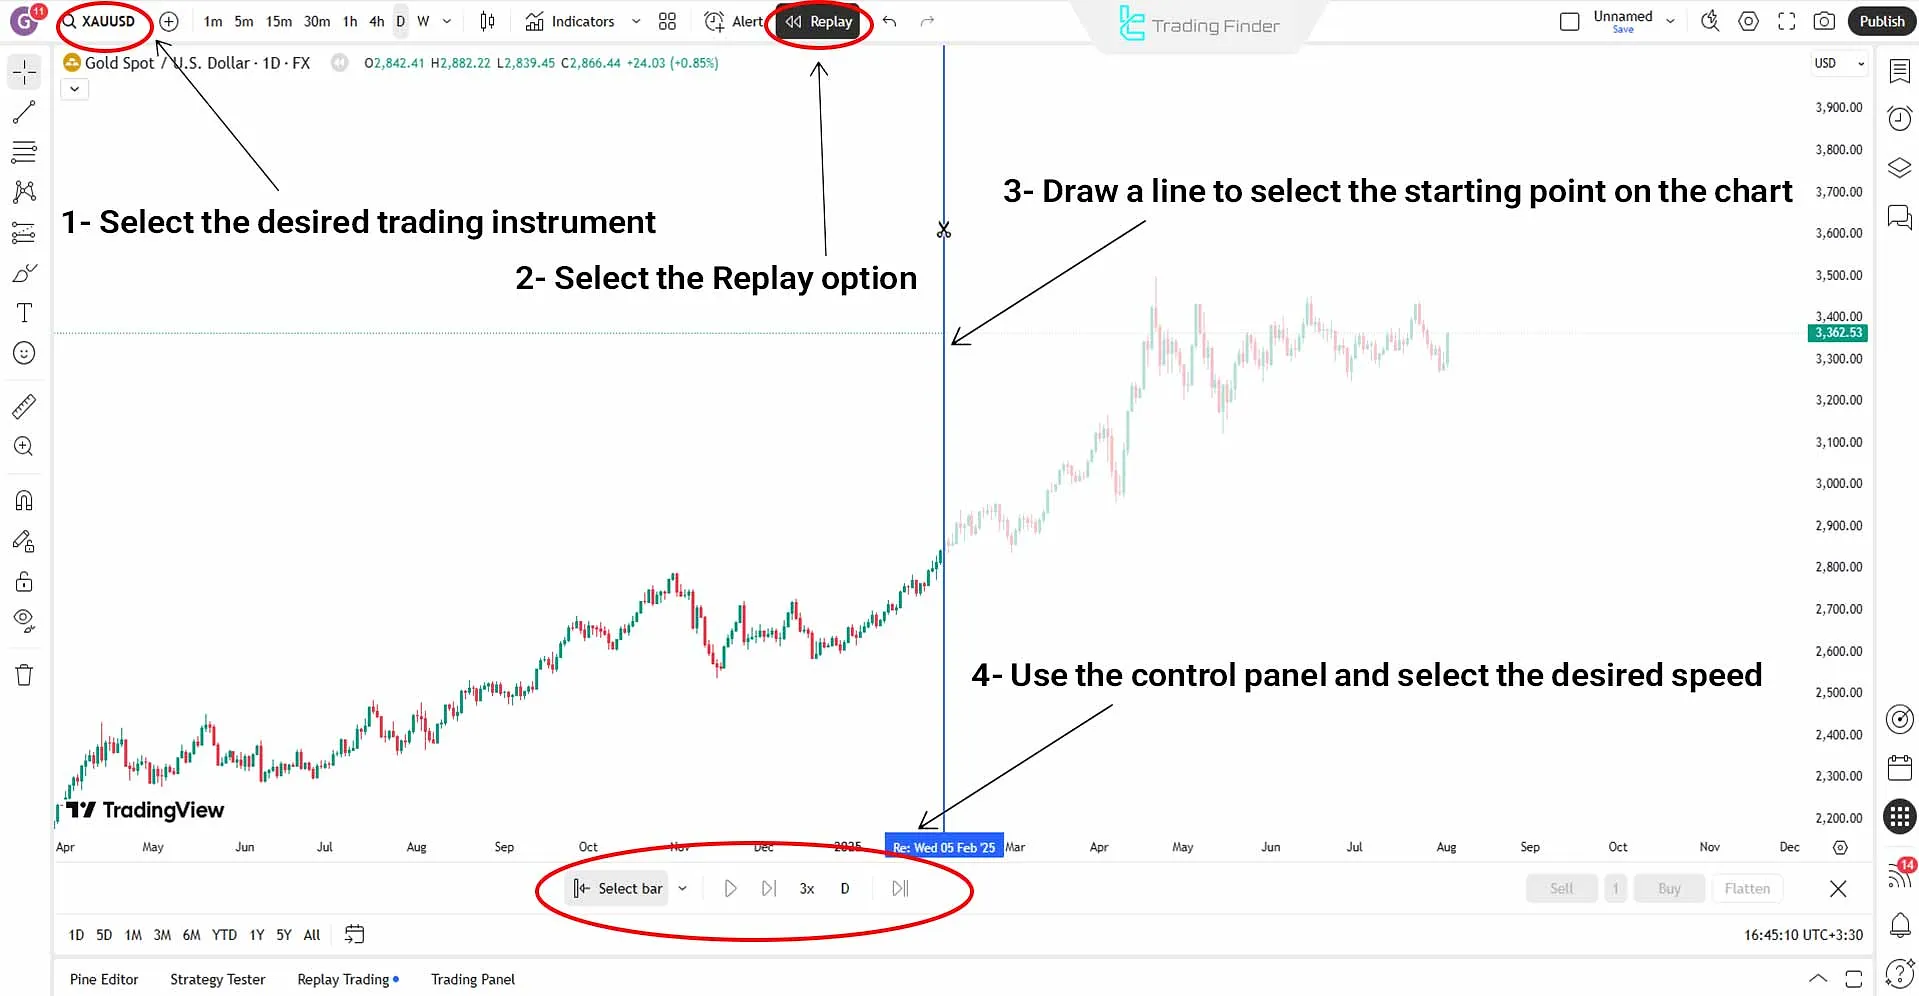
#2 Advancing the Market with Simulation
Using the “Play” button or side arrows, move candles forward one by one. At each stage of the TradingView backtesting tutorial, execute your trading strategy and define entry points, stop-loss, and targets.
At this stage, you can increase or decrease the speed at which candles progress.
Note: in TradingView’s free version, you can only perform Bar Replay backtesting on the daily timeframe.
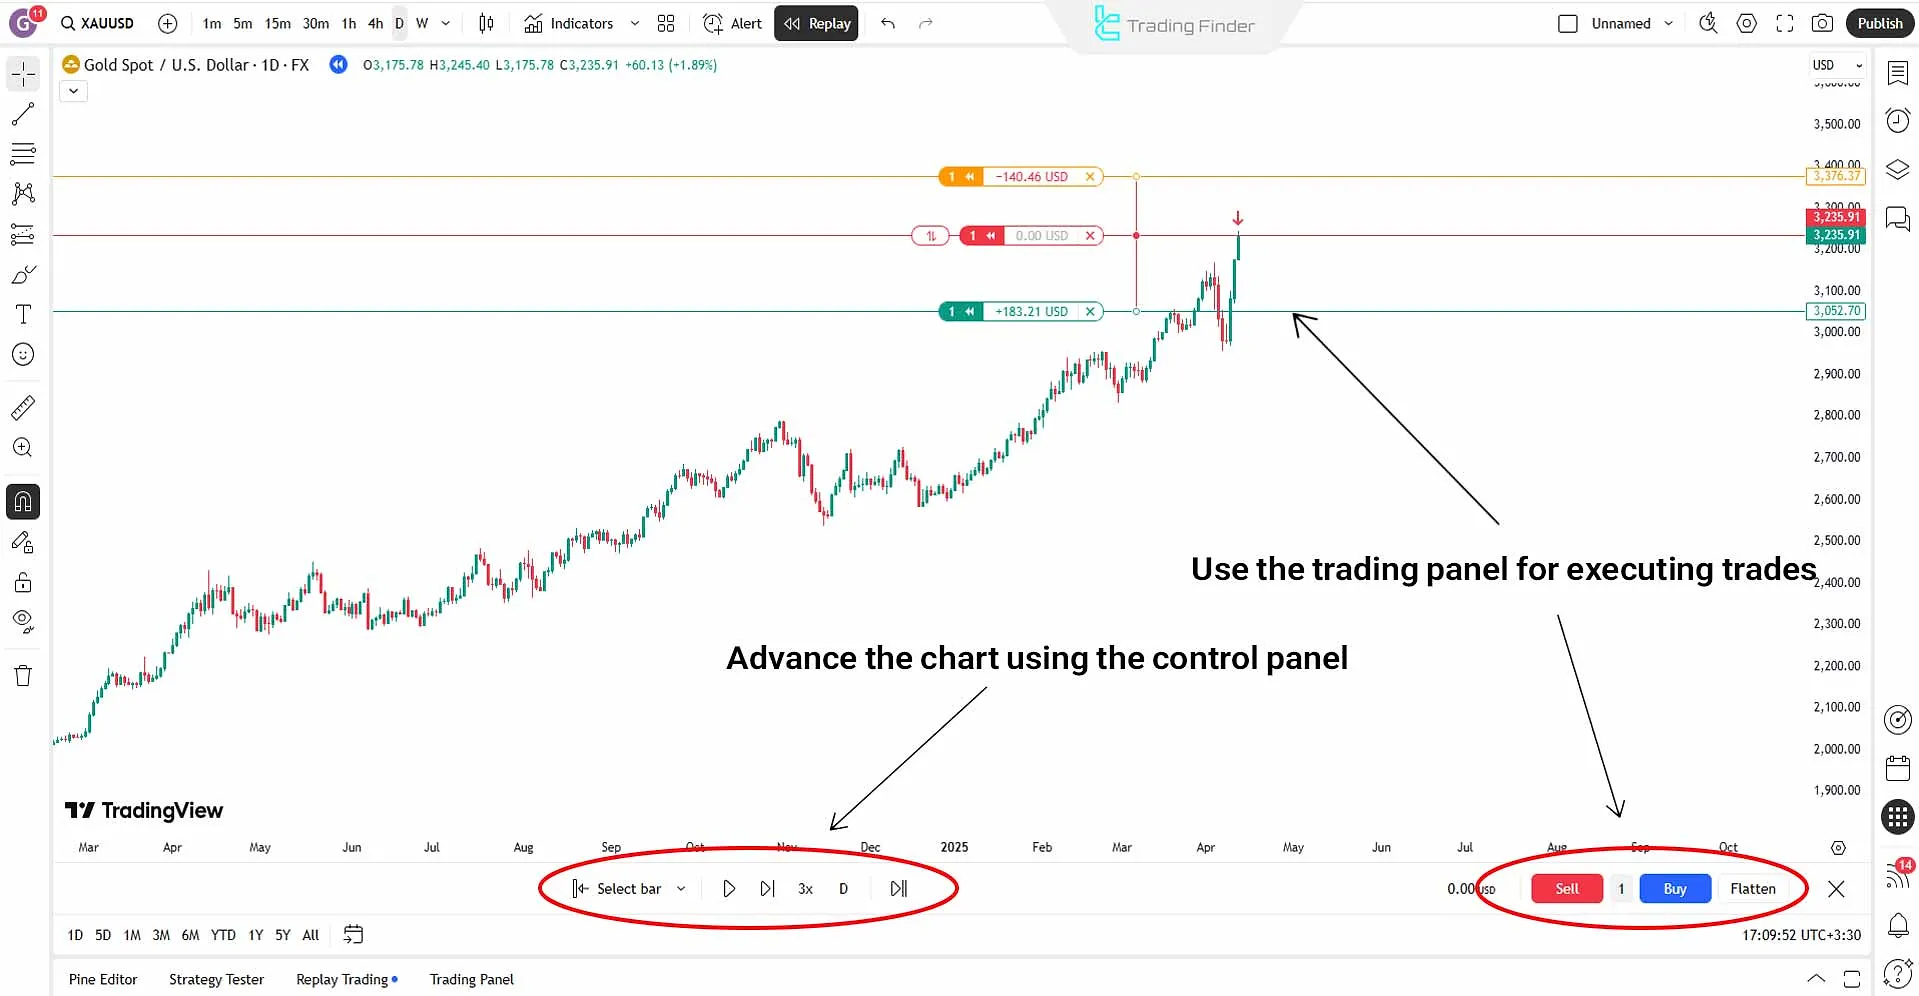
#3 Recording and Analyzing Results
During the backtesting tutorial, you can mark entries and exits with annotation tools or record information in an Excel file or a trade journal.
At the end of the Backtest, analyze the results obtained and calculate metrics such as win rate, average risk-to-reward, and number of successful trades, and review the performance of your trading strategy.
Statistical Evaluation of Backtest Results in MetaTrader
The credibility of Backtest results is reliable when they are statistically significant. A precise analysis of the strategy’s performance using statistical metrics provides deep insight into the return, risk, and stability of the trading system. Key metrics in evaluating Backtest:
- Sharpe Ratio: shows the risk-adjusted return and measures the true efficiency of the strategy against volatility;
- Profit Factor: the ratio of total profits to losses; a value above 1.5 is a sign of strategy stability and reliability;
- Max Drawdown: displays the largest equity decline during the test period and indicates the system’s risk tolerance;
- Recovery Factor: the ratio of net profit to drawdown; the larger this number, the greater the strategy’s ability to recover from losses.
To ensure accuracy and stability of results, data should be tested across multiple timeframes and assets. This approach prevents results from relying on one specific condition and provides a more realistic picture of the strategy’s performance.
Parameter Optimization in Backtest
Fine-tuning strategy parameters is one of the critical stages in Backtest. Small changes in these values can drastically alter test results.
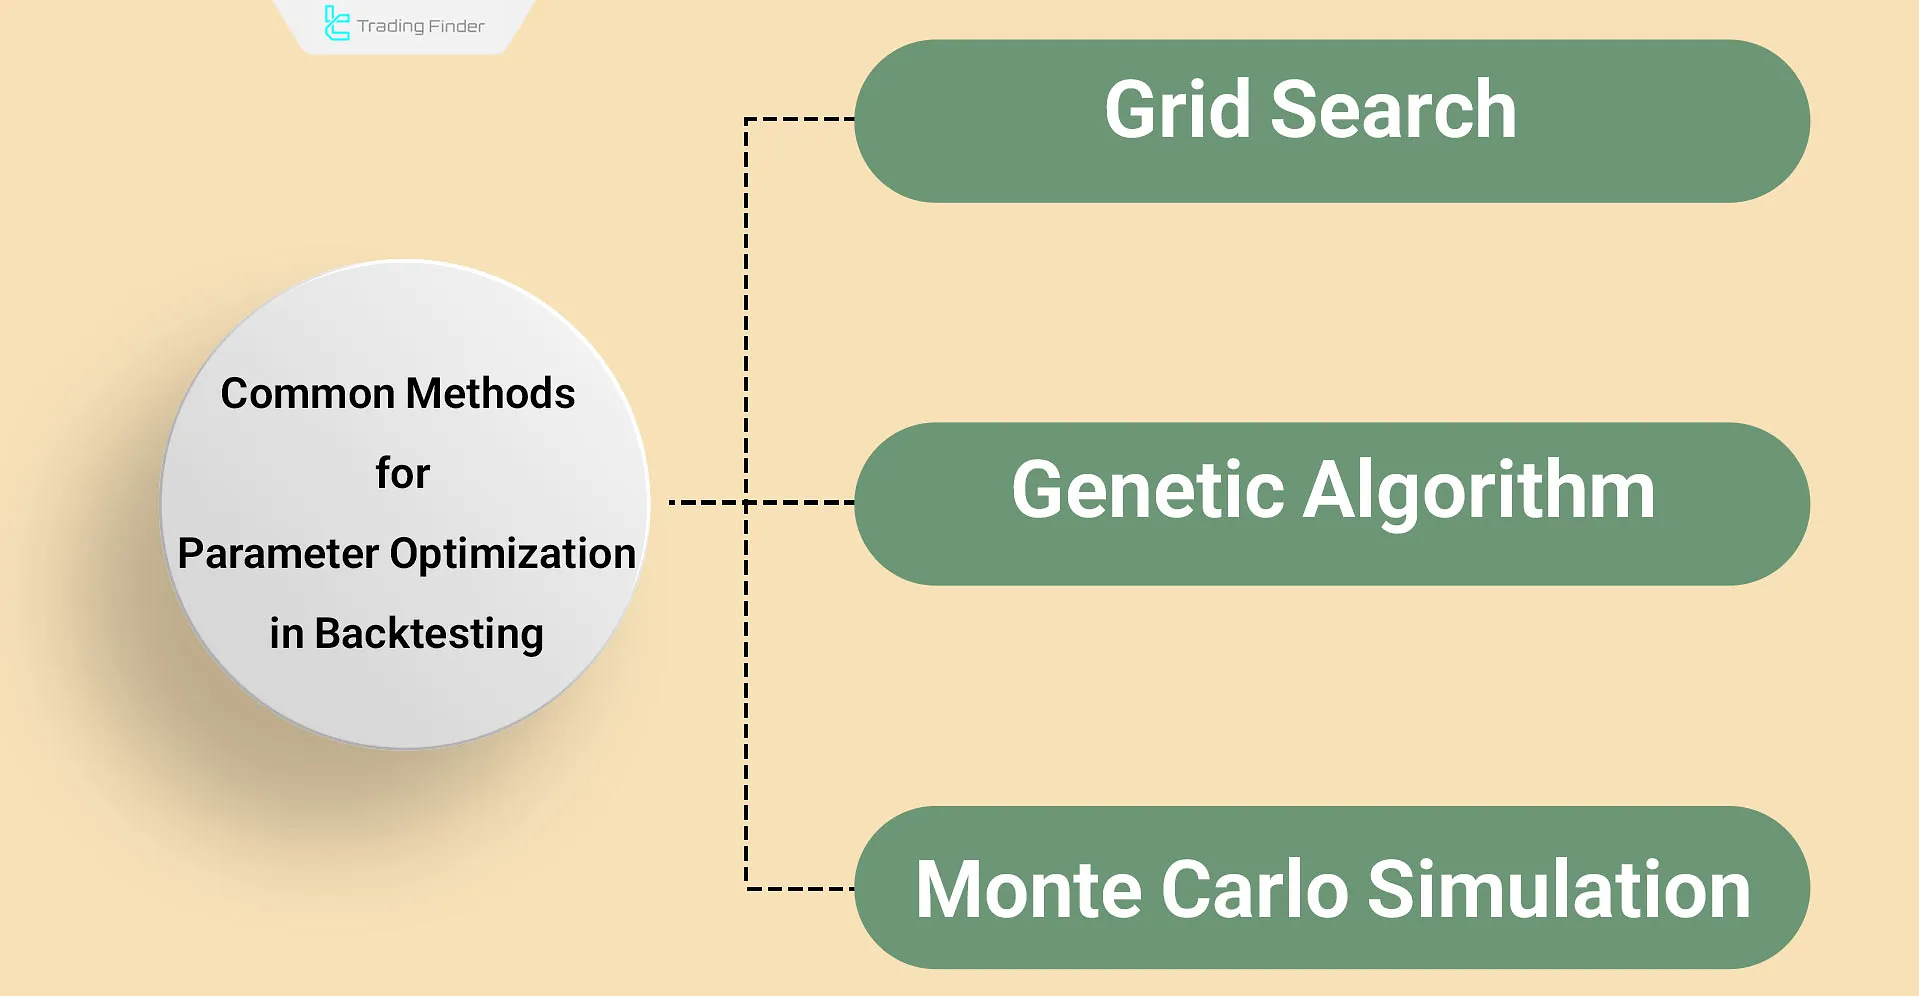
For example, in a moving average strategy, choosing appropriate periods for the fast and slow averages directly affects profitability and risk. Common parameter-optimization methods in Backtest:
- Grid Search: systematically examining all possible parameter combinations within a defined range;
- Genetic Algorithm: applying natural selection principles to find high-performance, optimal combinations;
- Monte Carlo Simulation: randomly selecting a set of parameters to evaluate result stability and assess strategy sensitivity.
Separate, out-of-sample data should be used for final evaluation to prevent Overfitting. This ensures the strategy maintains stable performance; not only on past data but also in real market conditions.
Step-by-Step Backtest Tutorial in MetaTrader 4 and 5
Backtest is a key part of evaluating the performance of a strategy or Expert Advisor.
This process, using historical market data, reveals the strengths and weaknesses of the trading system and provides an accurate picture of its probable behavior in the past. On MetaTrader 4 and 5 platforms, automated Backtest is executed via the dedicated Strategy Tester module.
Steps to run Backtest in MetaTrader:
- Activate the Strategy Tester window: from the “View” menu, select “StrategyTester” or use the Ctrl+R shortcut;
- Select the Expert Advisor or indicator: in the “ExpertAdvisor” section, choose your trading tool;
- Set the trading symbol (Symbol): choose the desired symbol such as EUR/USD or XAU/USD from the list so that data from that market are used;
- Select the timeframe (Timeframe): specify the timeframe appropriate for the strategy, e.g., M15, H1, or D1;
- Set the historical data range: define the test period, such as January 2020 to December 2024;
- Configure account parameters: set the initial deposit, leverage, and test model;
- Enable Visual Mode: if needed, enable this option to display the test process graphically on the chart;
- Start the test: after final settings, click Start to begin the Backtest.
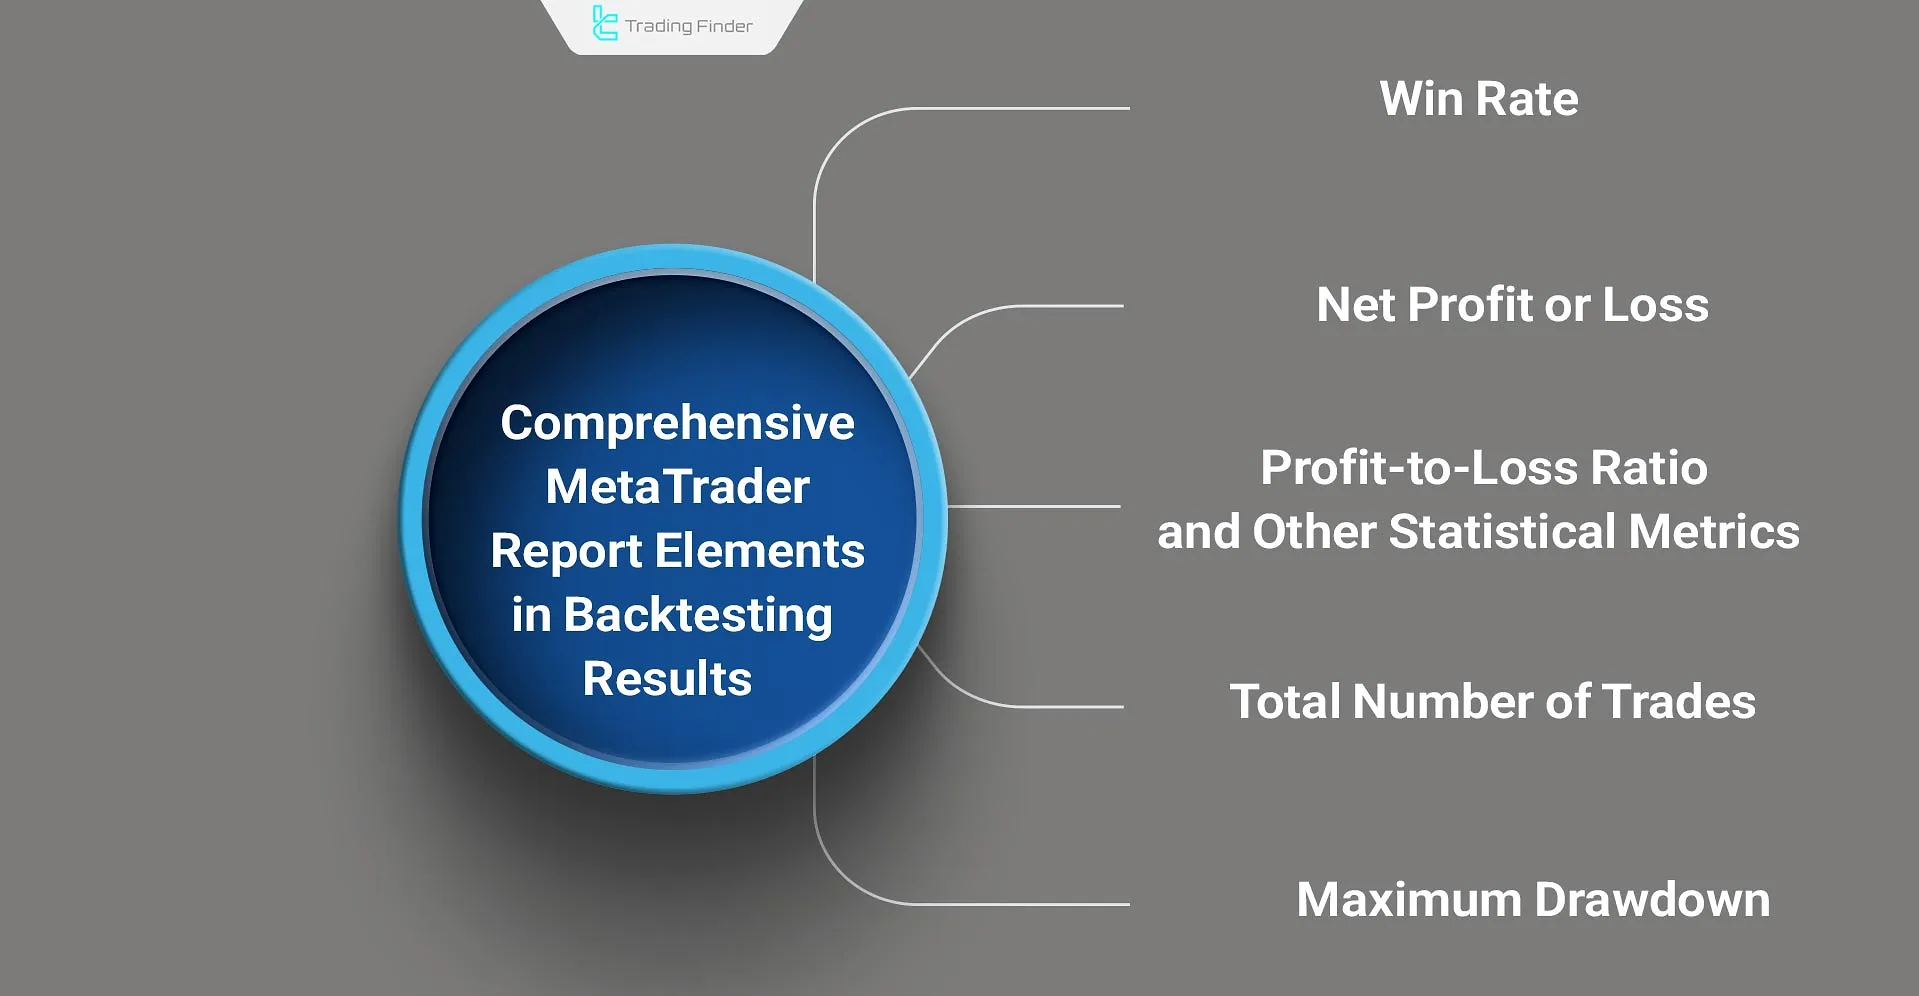
At the end of the test, MetaTrader provides a comprehensive report of results, including:
- Win rate
- Net profit
- Drawdown
- Total number of trades
- Profit-to-loss ratio and other statistical metrics
Careful analysis of these data makes it possible to gauge the effectiveness and stability of the strategy before live execution. Combining Backtest with Forward Testing provides a more complete view of the strategy’s efficiency under dynamic and real market conditions.
Automated Backtesting with the SoftFx Forex Simulator in MetaTrader
This method allows you to test your trading strategies on past market data with high accuracy by simulating real market behavior. Steps for Backtest with Forex Simulator (SoftFX):
- Installation, setup, and downloading the required historical market data;
- Backtest settings (timeframe, start and end date, spread and commissions, capital amount, and order types);
- Running the simulation at the desired speed;
- Recording trades and analyzing results (profit and loss, success rate, drawdown, profit-to-loss ratio, and number of trades).
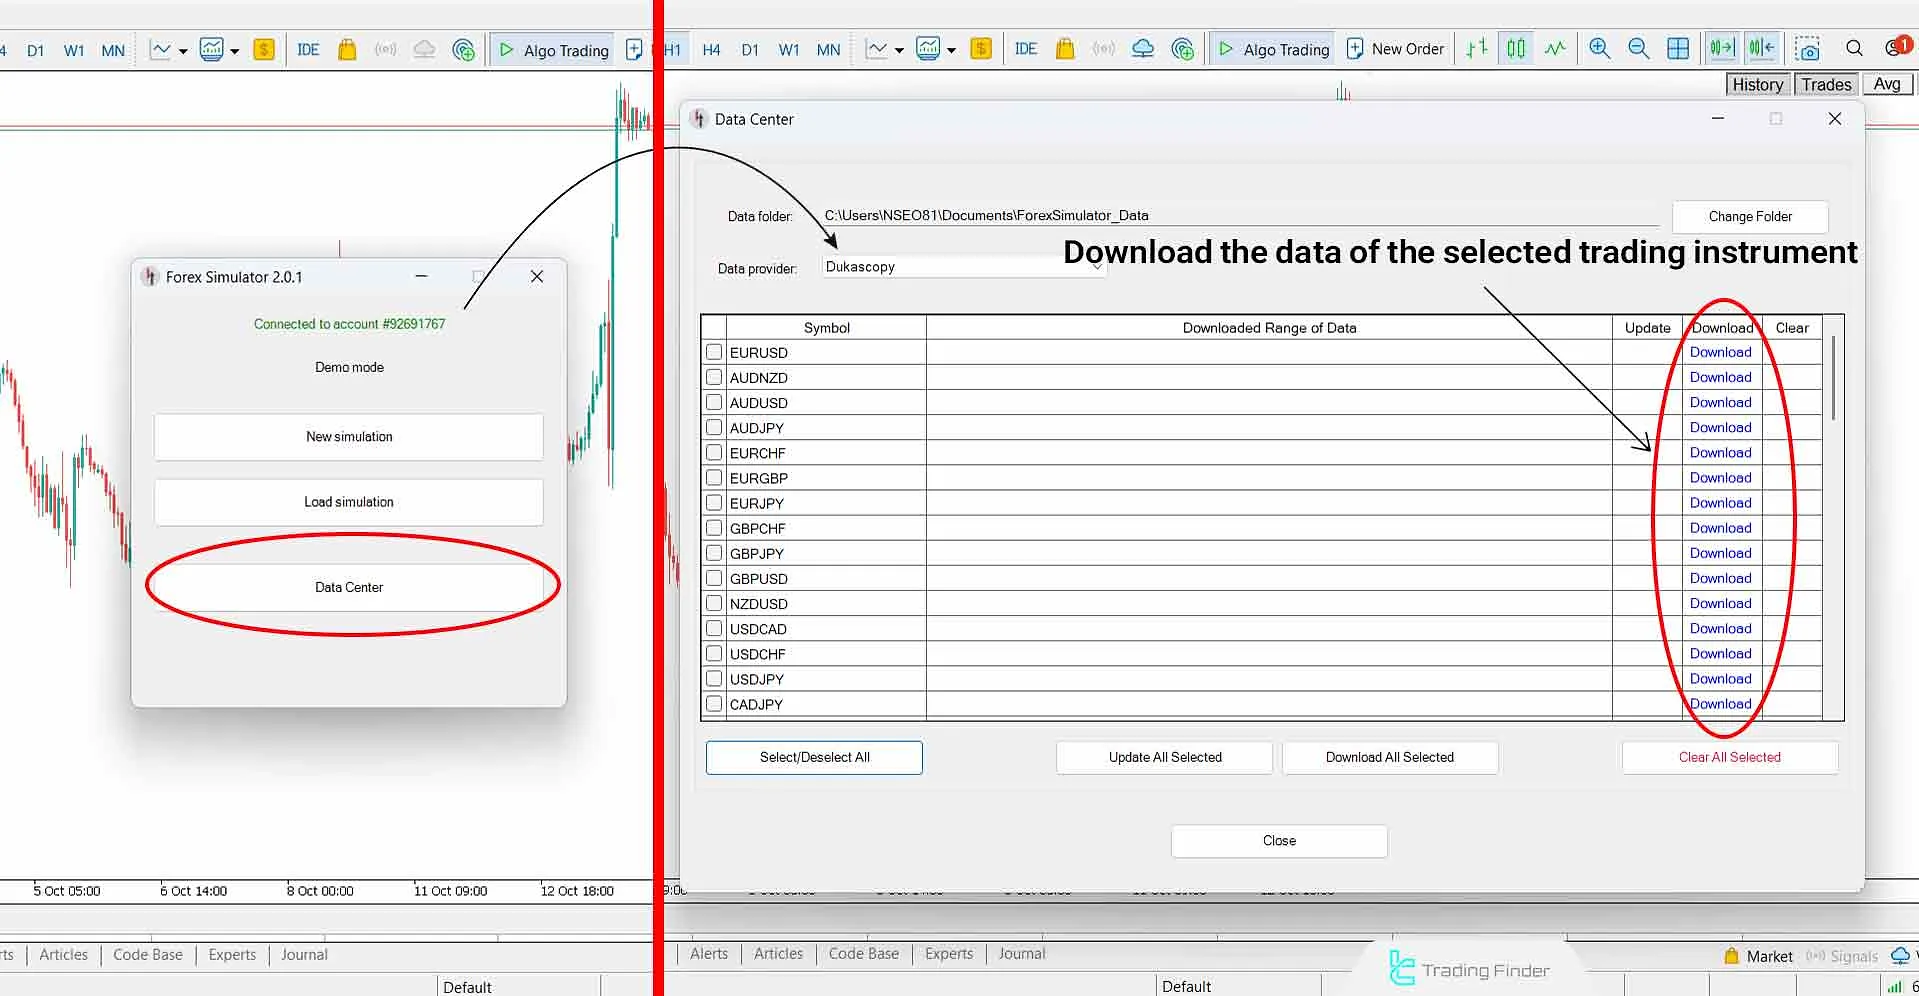
#1 Install and set up the simulator
To install this backtesting software, download the installer and then install it corresponding to your MetaTrader version (4 or 5). After installation and running the Expert, from its main page in “DataCenter”, download historical data for the desired symbol.
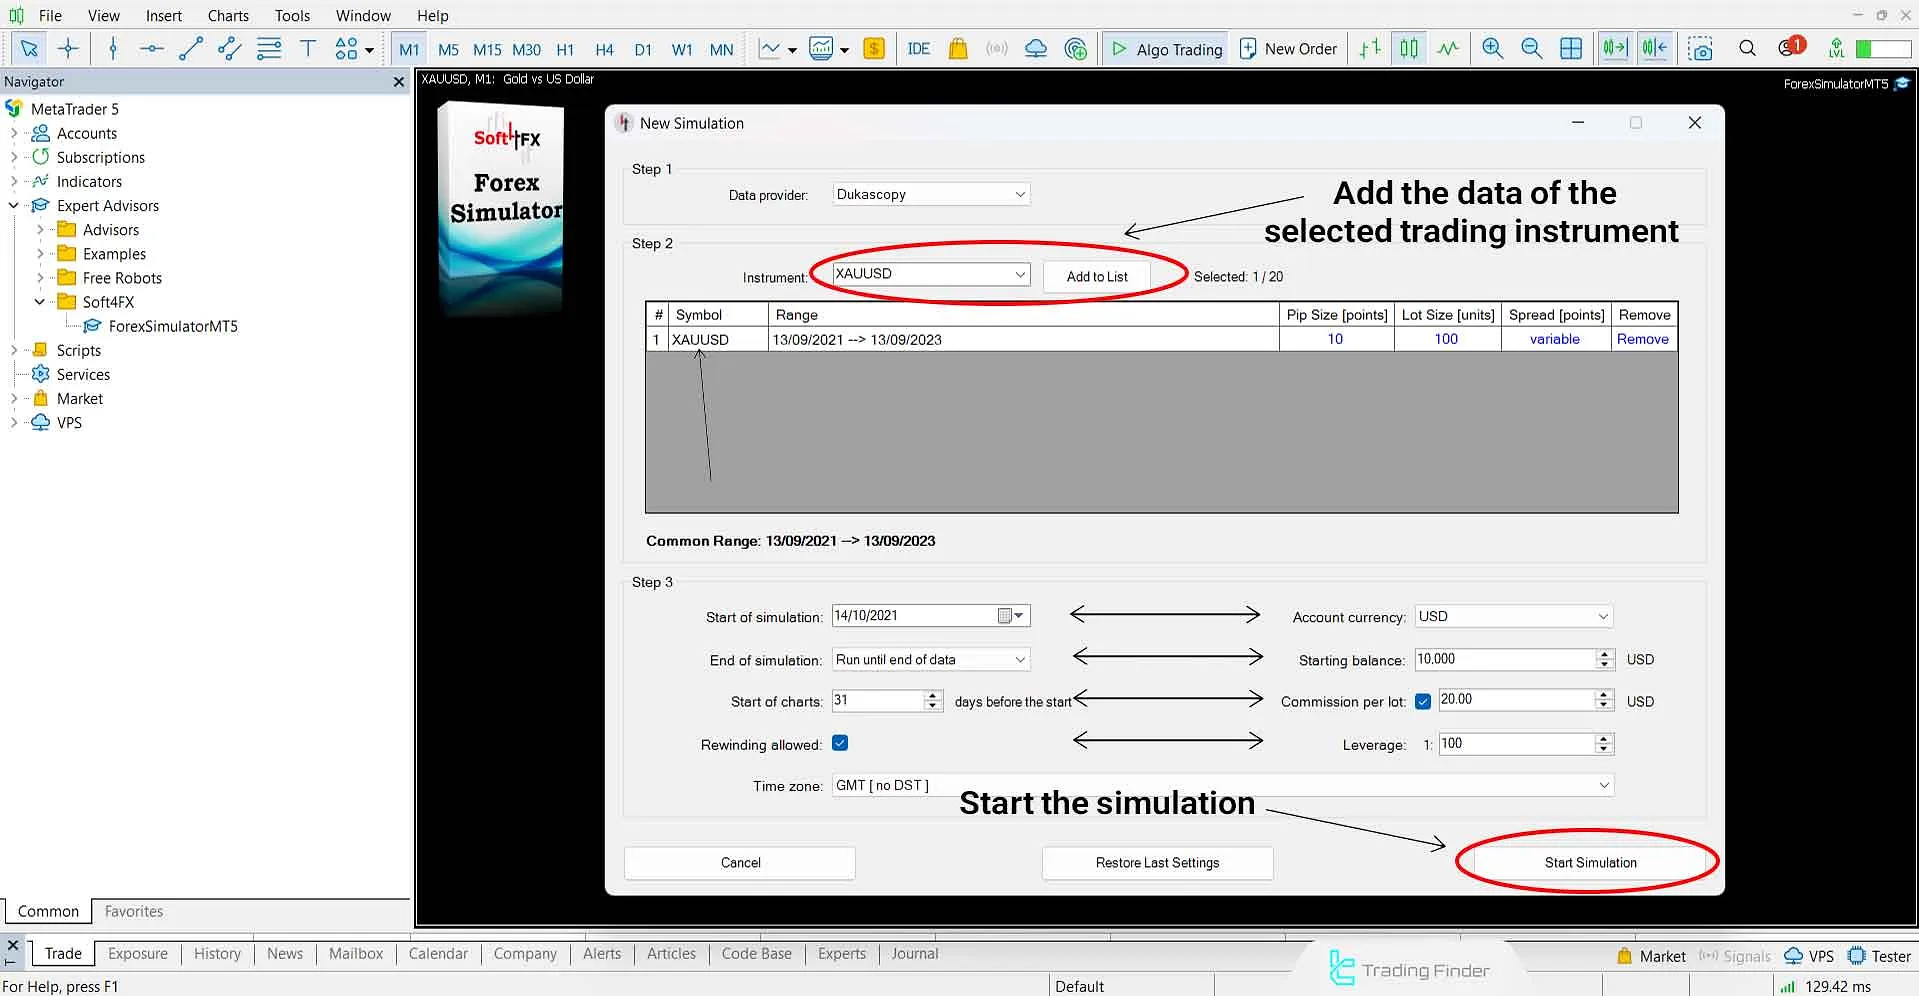
#2 Software Settings for Backtest
After installation, setup, downloading the desired symbol’s data, and selecting “NewSimulation” on the next screen, enter the desired settings such as timeframe, start and end date, spread and commissions, capital amount, and order types, then select “StartSimulation”.
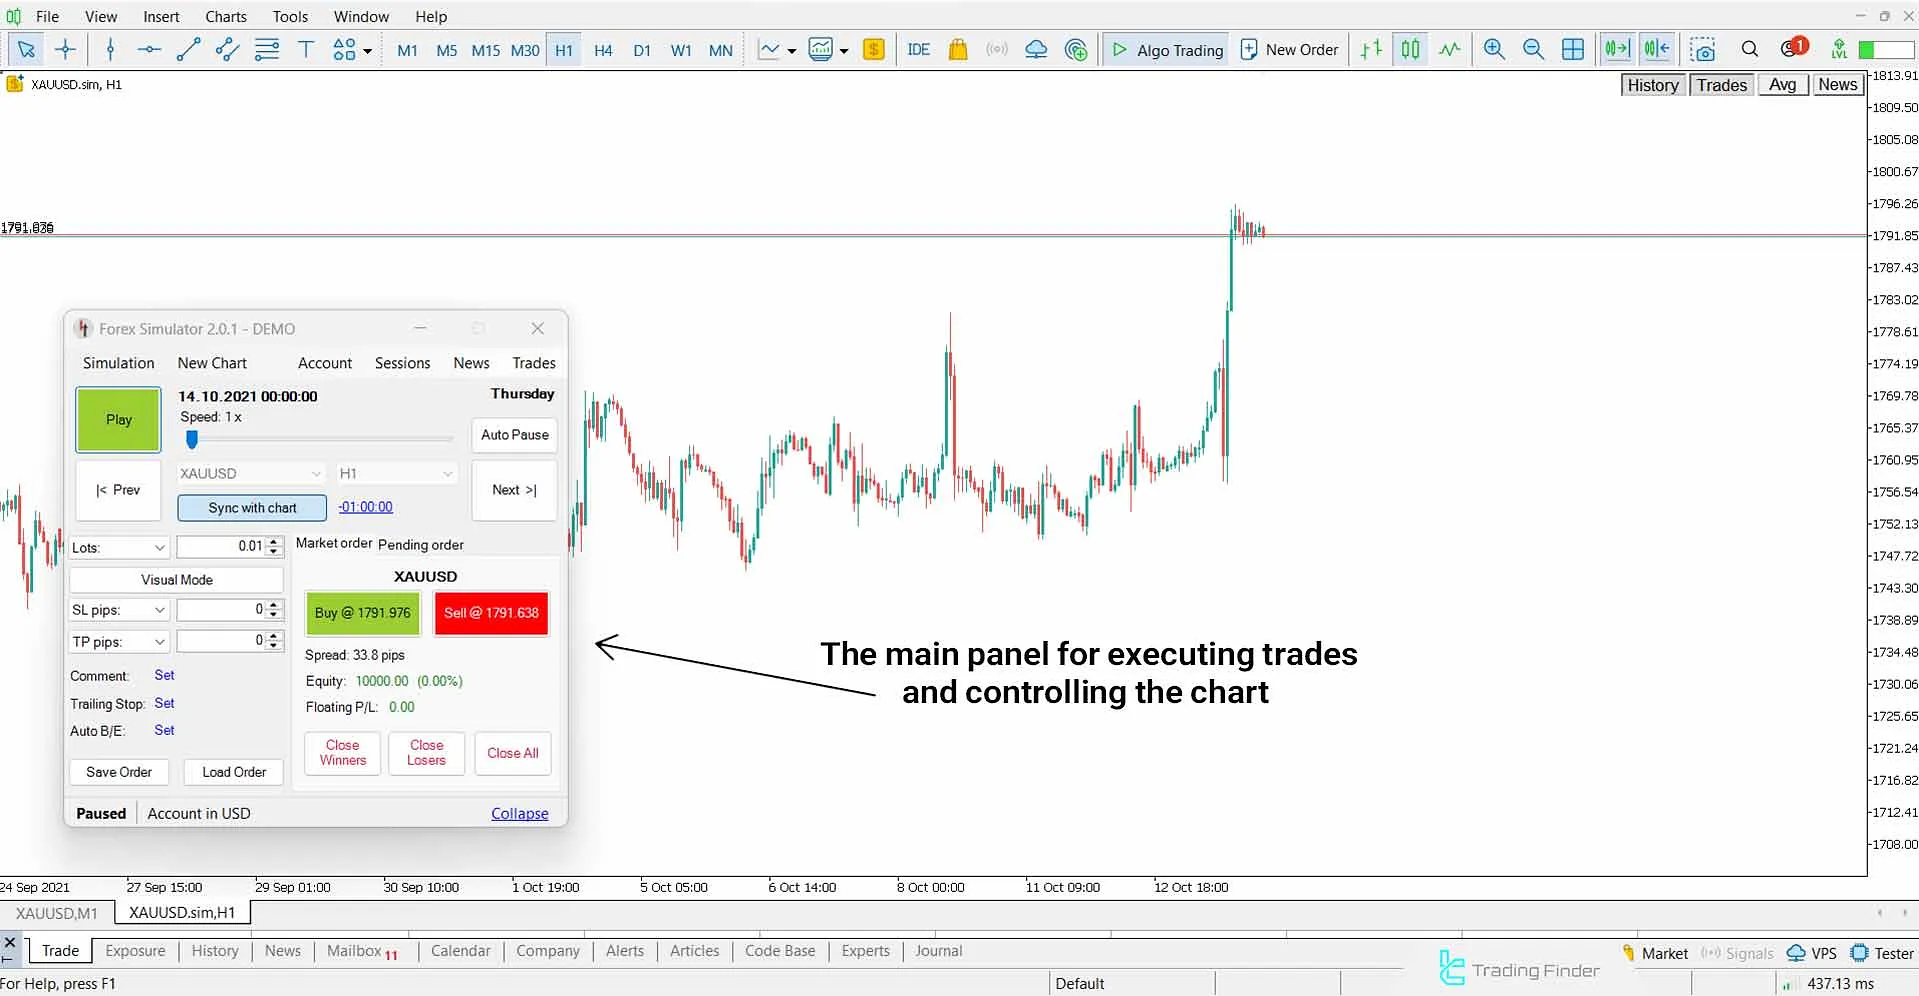
#3 Run the Simulation, Record Trades, and Analyze Results
By selecting “StartSimulation”, the market runs live but with historical data. You can place trades, pause, rewind, and adjust speed on the fly.
In the rest of the backtesting tutorial, you can manually enter and manage trades and, after finishing, prepare a complete report of profit and loss, success rate, drawdown, profit-to-loss ratio, and number of trades.
Benefits of Using the SoftFX Simulator
Simulators provide the closest experience to the real market using past data. The Soft FX simulator is no exception. Below are the advantages of using this forex backtesting simulator.
Advantages of using the Soft FX backtesting software:
- Ability to simulate at adjustable speeds;
- An environment similar to the live market;
- Support for various order types (Market, Pending, and others);
- Ability to connect to MetaTrader to obtain precise data.
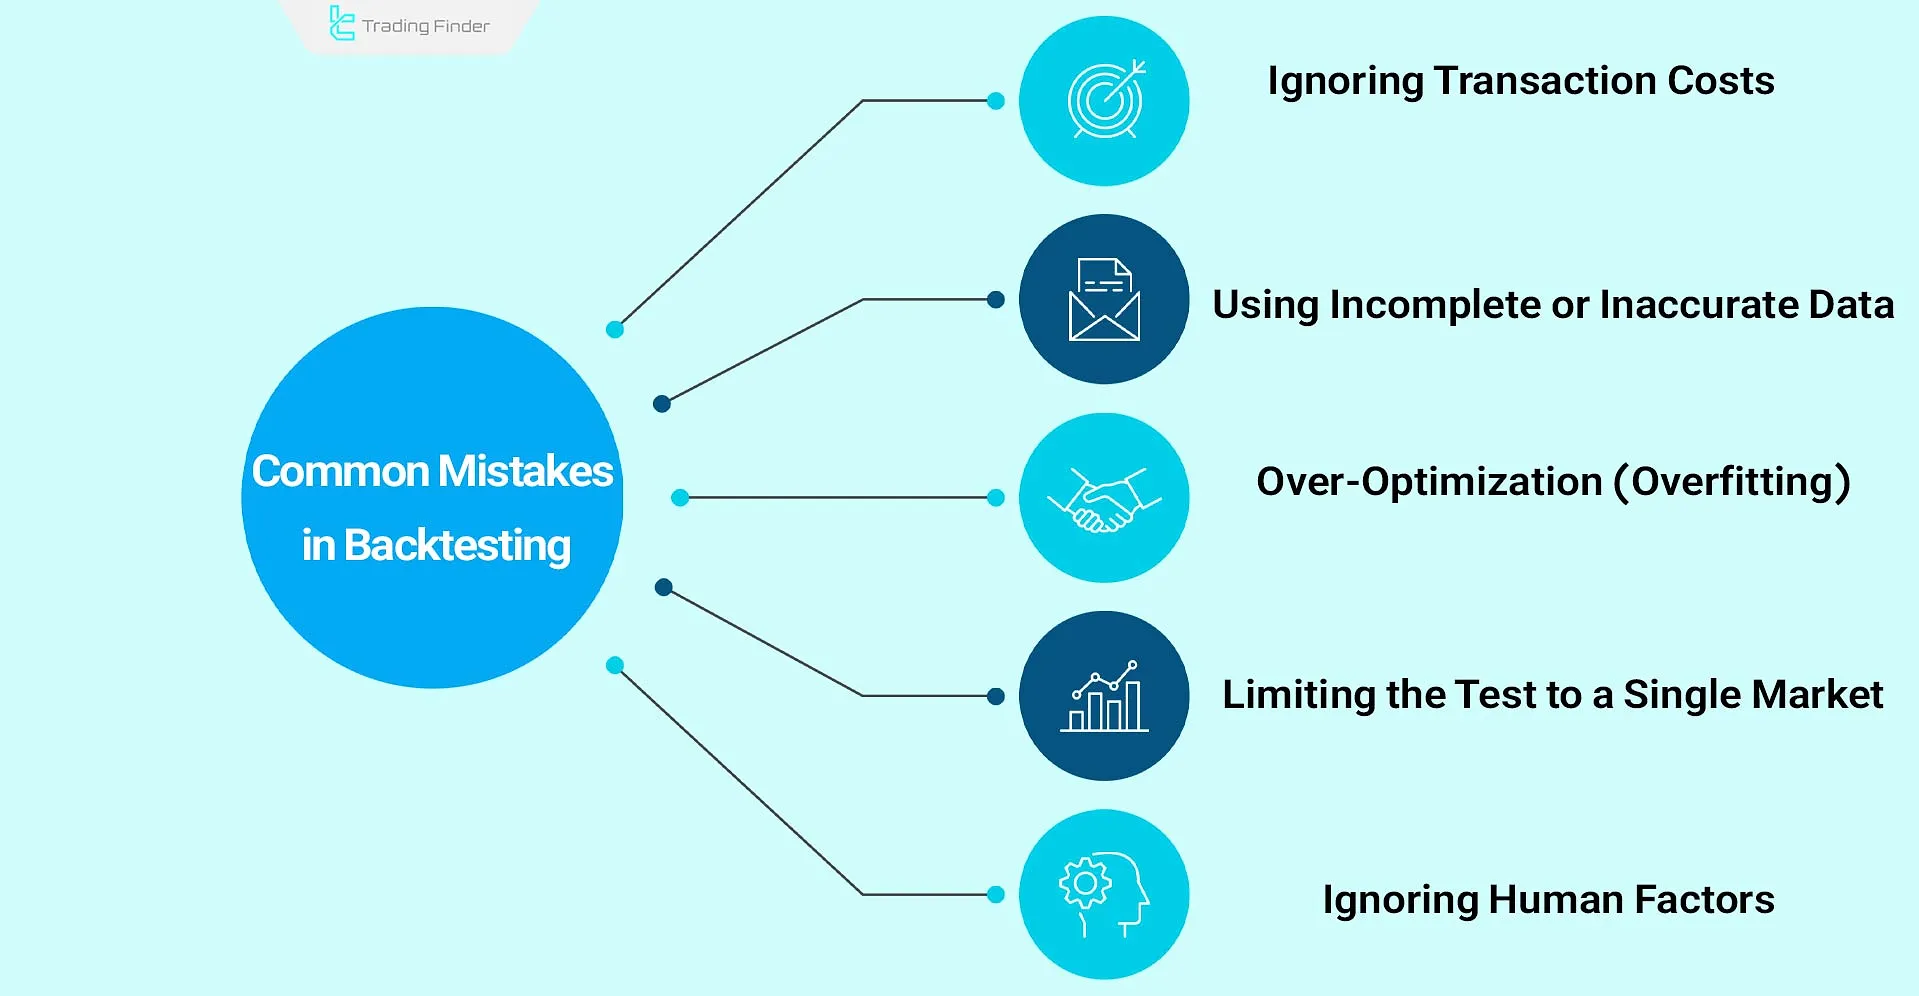
Common Mistakes in Backtest
Backtest only provides reliable results when all the technical and psychological details of the market are properly considered. Ignoring certain key factors can derail the analysis from a realistic path and lead to high-risk decisions. Common mistakes in executing Backtest include:
- Using incomplete or incorrect data: historical data must be reliable, gap-free, and aligned with the primary market source;
- Ignoring transaction costs: spread, commission, and slippage must be included in the test model;
- Overfitting: a specific strategy that performed well on past data will not necessarily perform better on future data when over-optimized;
- Limiting the test to a single market: evaluating the strategy across multiple assets such as forex, gold, or indices provides a more realistic measure of performance stability;
- Ignoring human factors: no Backtest can replicate a trader’s real emotions under profit or loss.
Combining Backtest with Forward Testing and trial execution in a Demo Account creates a comprehensive, realistic, and statistical view of strategy performance and minimizes the risk of emotional decision-making.
Expert Advisor for Logging a Trading Journal into Notion for MetaTrader
The MetaTrader trading journal EA for Notion is a specialized product by TradingFinder, designed to automatically log trading data and perform strategy Backtest.
- Download the MetaTrader 5 trading journal EA for Notion
- Download the MetaTrader 4 trading journal EA for Notion
This tool establishes a direct connection between MetaTrader and the Notion platform, enabling automatic logging of trade details without manual entry.
Information such as asset symbol, order type, entry and exit price, Take Profit, Stop Loss, trade size, position status, and Risk/Reward ratio are automatically transferred from MetaTrader to a Notion database.
The connection between MetaTrader and Notion is established by enabling WebRequest in MetaTrader. The user only needs to add https://api.notion.com to the allowed list and place the values of Your Notion Token, Parent Page ID, and License Key in the EA settings.
After completing these steps, the system will start automatically storing trade information. The trading journal EA is suitable for various trading styles, including scalping, day trading, and swing trading, and it supports forex, stocks, and cryptocurrencies.
It also supports Multi-Timeframe configurations, enabling traders to conduct more precise analyses of market behavior and their Backtest results.
Users can enable or disable custom fields such as ticket number, broker name, account number, and notes, so that only required information is logged.
The data collected in Notion can be filtered, categorized, and analyzed, and can be used to evaluate past performance and optimize the trading system.
Ultimately, the MetaTrader trading journal EA for Notion is a free, accurate, and fully automated tool that, while facilitating trade management, enables data-driven analysis and professional Backtest of strategies in a simple and customizable environment; an essential tool for any trader seeking discipline, precision, and the development of profitable strategies.
Conclusion
Backtest is one of the most important tools for evaluating the performance of trading strategies in financial markets.
This method, using historical data, allows the trader to review the potential performance of their strategy under different market conditions and identify its strengths and weaknesses.
Backtesting can be done manually and for free with tools such as Bar Replay in TradingView. You can also use more specialized software on the MetaTrader platform.


