


The MACD indicator (Moving Average Convergence Divergence) is a trend-following indicator used across all financial markets, including Forex Market and crypto markets.
This indicator identifies the overall trend, divergence, and convergence of price using two moving averages.
The settings of the MACD are customizable, allowing it to be used effectively in both short-term and long-term trades.
History of the MACD Indicator (MACD)
The MACD indicator was first developed in the 1970s by Gerald Appel. In fact, this tool belongs to the family of macd indicators and is based on exponential moving averages.
His initial goal was to create a combined method for simultaneously measuring trend strength and momentum. A few years later, in 1986, another analyst named Thomas Aspray introduced the MACD histogram to make the changes in the distance between the macd line and signal line more visually apparent.
These two innovations turned the MACD into one of the most widely used macd indicator trading tools in technical analysis across financial markets.
On the Financial Wisdom YouTube channel, the MACD indicator is introduced in a video:
Advantages and Disadvantages of MACD
Since the MACD indicator relies on historical market data, there is a delay in its signals; however, the combination of two EMAs offers insights not easily seen in simple chart analysis. Pros and cons of the MACD:
Disadvantages | Advantages |
Signal delay | Strong trend identification |
High signal noise | Combination of multiple tools |
Requires additional confirmation | Divergence detection |
Dependent on settings | Simplicity in analysis |
Inefficiency in low-momentum trends | Suitable for all markets |
Components of MACD
The MACD consists of three main components, and their movements combined are used to analyze price momentum and trend:
- MACD Line
- Signal Line
- Histogram
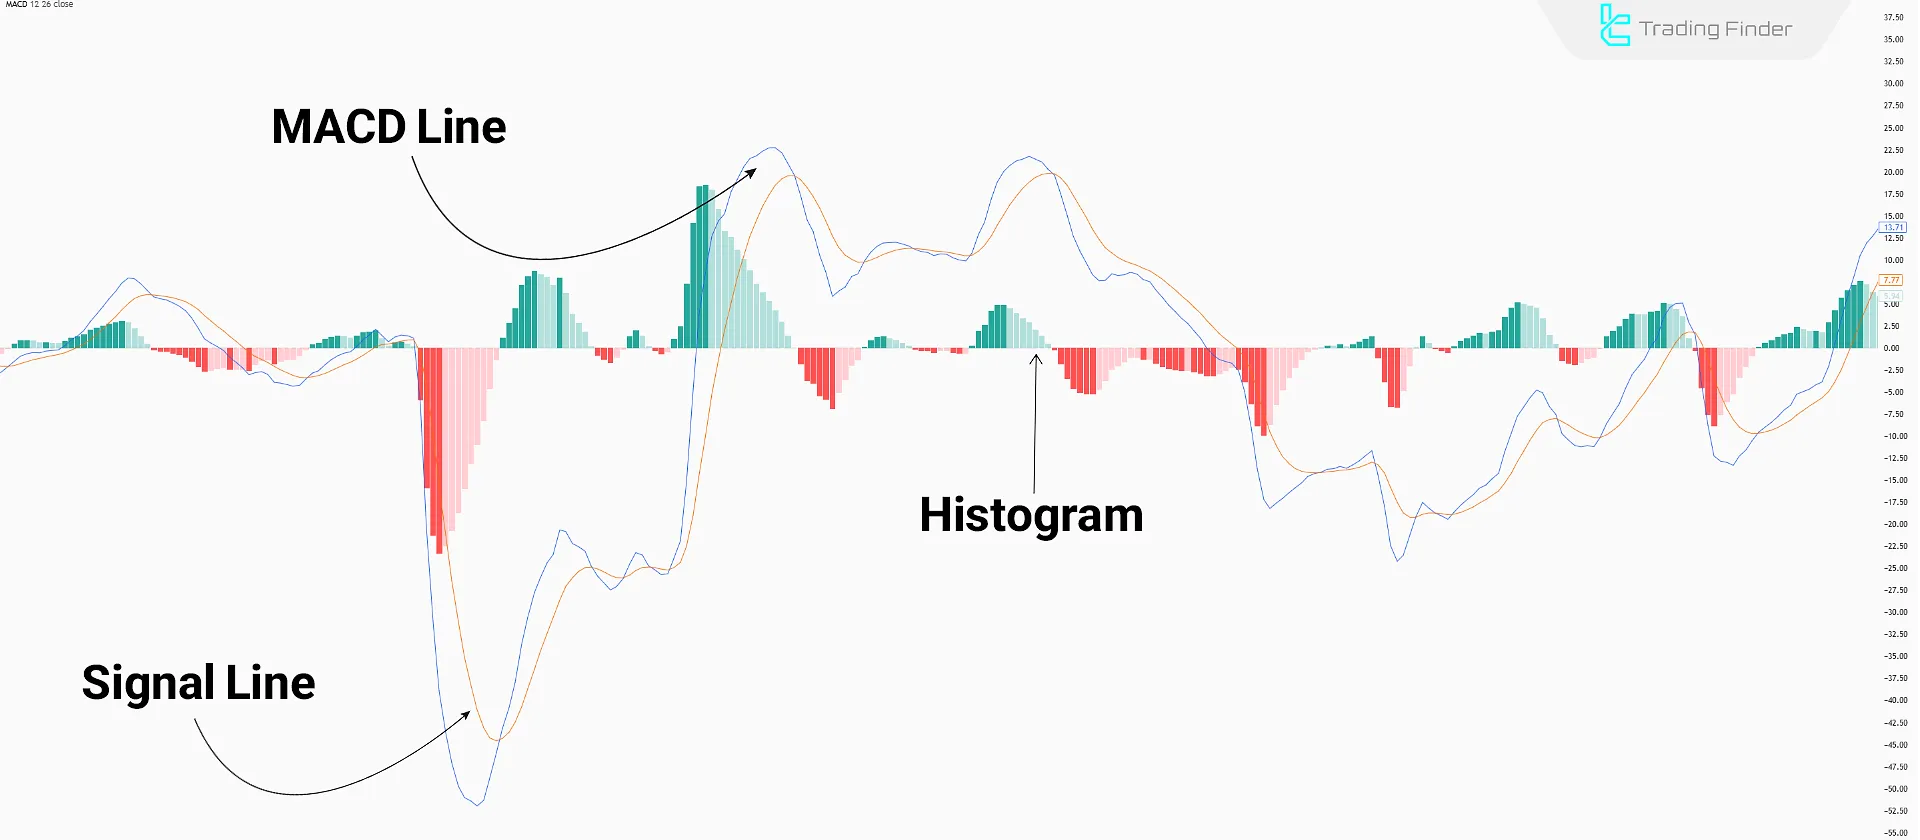
MACD Line
The MACD Line is the difference between two exponential moving averages (EMA). It shows momentum changes.
When the MACD Line moves upwards, momentum is bullish; when it moves downwards, momentum is bearish.
The first sign of weakness or momentum shift is the change in the direction of the MACD Line; its slope indicates the strength or weakness of the momentum.
Signal Line
The Signal Line is a 9-period EMA of the MACD Line, which helps smooth out MACD noise and reduces false signals.
The angle and distance between the two lines represent price momentum. Their crossover is one of the most widely used MACD indicator signals.
Histogram
The Histogram of the MACD is the difference between the MACD Line and the Signal Line, displayed as vertical bars on the chart. Its purpose is to show the strength and direction of momentum.
When the histogram bars move positive, the momentum is bullish; when they move negative, momentum is bearish. The longer the bars, the stronger the momentum.
For aggressive trades executed with minimal confirmation, the histogram bar signal is a suitable method for entering a position.
Due to its shorter time period (9) compared to the MACD or signal lines, the histogram provides faster signal delivery.
Golden Numbers in the MACD Indicator
The numbers 12, 26, and 9 are known as the default macd indicator setting and are referred to as the “Golden Numbers of MACD.” These values maintain a balanced structure between identifying trends and generating trading signals.
The main reason for choosing them is that the combination of short-term and long-term periods provides a clearer picture of changes in momentum and market direction.
The components of these golden numbers (also called macd components) are as follows:
- 12: Short-term exponential moving average period;
- 26: Long-term exponential moving average period;
- 9: Signal line period, calculated as a 9-period moving average of the MACD line.
Main Applications of the Golden Numbers in MACD
The golden numbers of MACD are not only used as default settings but also play specific roles in interpreting price behavior. This combination allows traders to identify trends, macd buy signals, macd sell signals, and even market momentum with greater accuracy.
- Identifying the overall market trend through comparing the 12 and 26-period averages;
- Generating buy and sell signals based on the crossover of the macd signal line with the signal line;
- Analyzing momentum and strength of price changes through the difference between moving averages.
Applications of the MACD Indicator (MACD)
The main uses of the MACD indicator include trend identification, entry and exit signal detection, and divergence recognition. Analyzing histogram bar changes allows for observing the rise or fall in market movement strength.
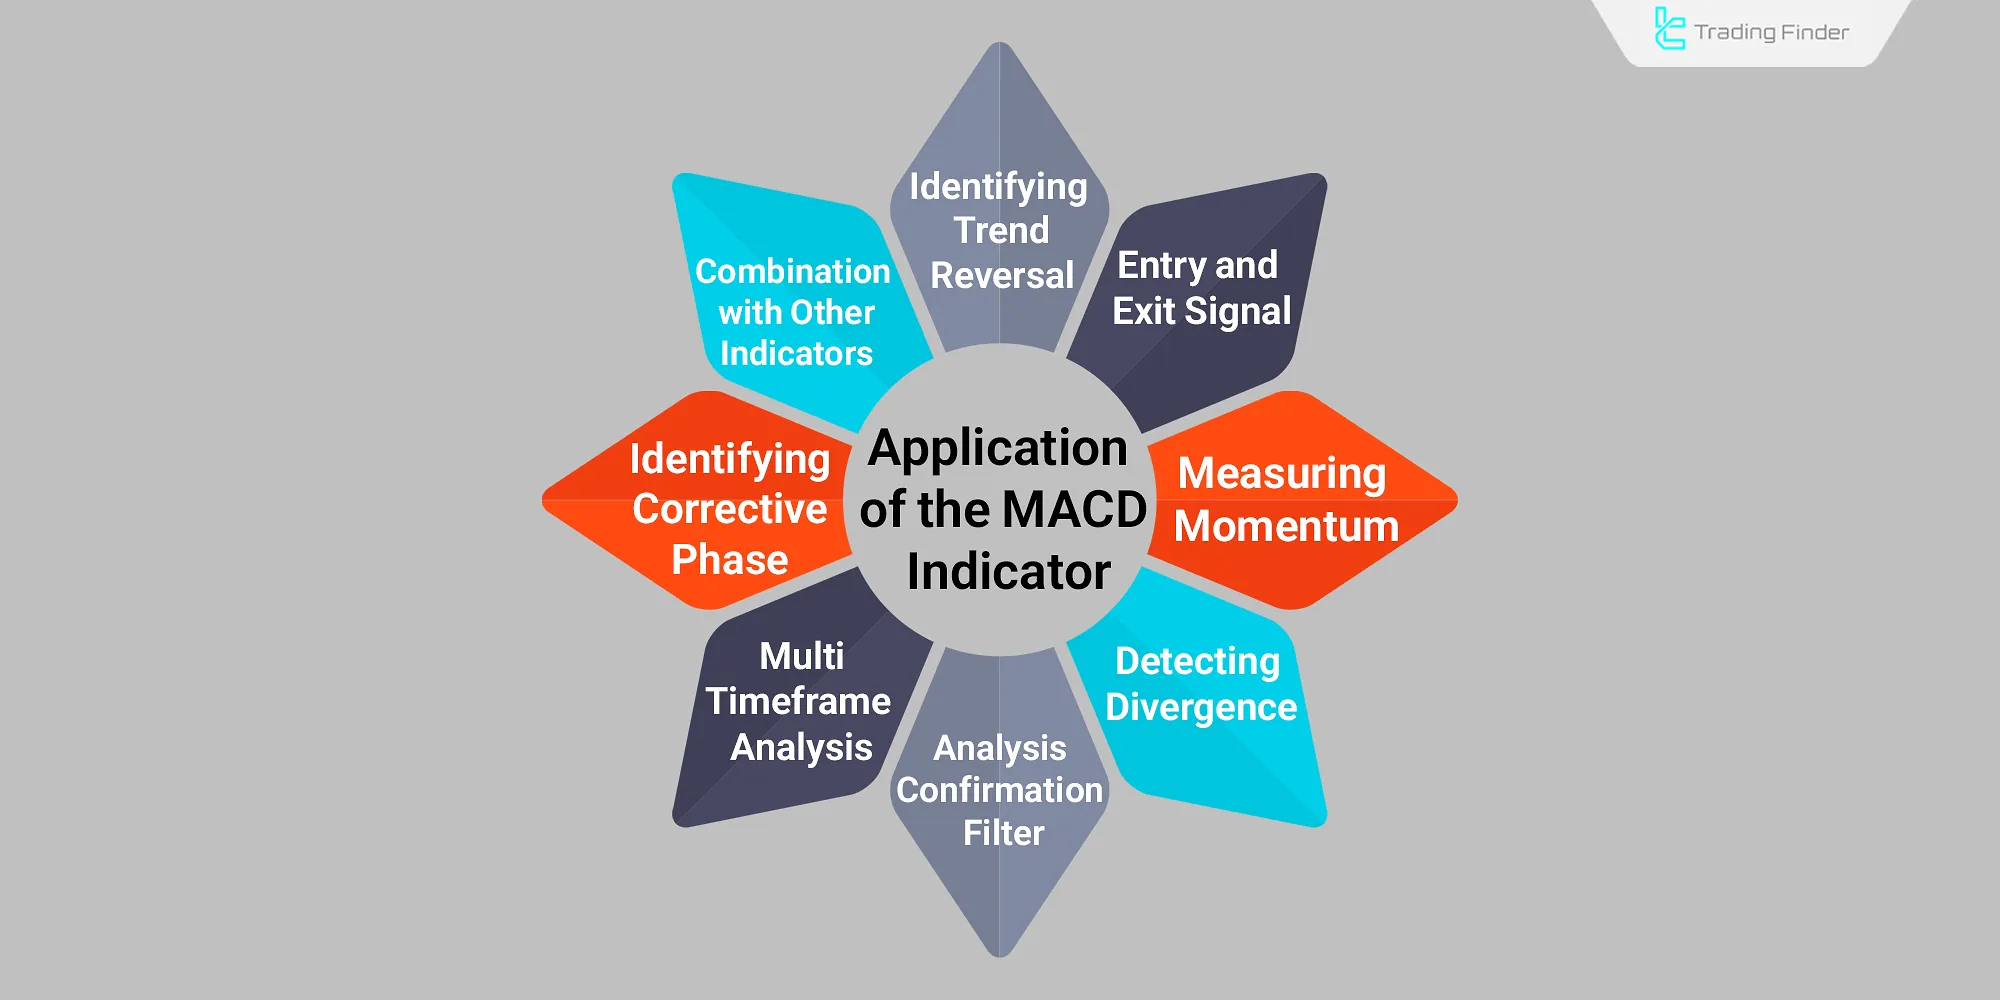
Primary applications of the MACD indicator include:
- Trend reversal identification: when the MACD line crosses the zero line;
- Entry and exit signals: crossovers between the MACD and signal lines;
- Measuring momentum: increase or decrease in histogram bars;
- Divergence detection: difference between MACD and price directions;
- Confirmation filter: verifying breakouts of support, resistance, or price action patterns;
- Multi-timeframe analysis: comparing MACD status on higher and lower timeframes for pattern optimization;
- Correction phase identification: shortening histogram bars indicate the start of a corrective phase;
- Combination with other indicators: improving signal accuracy using MACD with RSI or moving averages.
According to the article MACD indicator tutorial on Investopedia, this indicator is considered a reliable tool for identifying the main price trend.
Types of MACD Divergence
In addition to momentum and trend analysis, the MACD indicator is widely used for identifying different types of price divergence.
In fact, one of the main purposes of using the macd indicator is detecting divergences and potential trend reversals.
A divergence indicates weakness or reversal of the current trend; detecting types of divergence such as hidden and time-based divergence is one of the core applications of the MACD indicator.
Regular Divergence
A regular divergence occurs when the direction of price movement and the MACD indicator differ.
In simple terms, this difference represents the concept of macd convergence divergence, which plays an important role in market momentum analysis.
- Bullish divergence: price forms a lower low, while the indicator forms a higher low;
- Bearish divergence: price forms a higher high, while the MACD forms a lower high.
Hidden Divergence
Hidden divergence occurs when the price moves in the direction of the main trend, but the MACD shows signs of a short-term pullback.
This type of divergence is often used to explain what is macd and how it supports trend continuation.
- Bullish hidden divergence: price creates a higher low, but the MACD forms a lower low; this indicates a trend continuation signal;
- Bearish hidden divergence: price forms a lower high, while the MACD forms a higher high; this suggests continuation of the downtrend.
Time Divergence
Time divergence happens when the pace of forming new highs or lows in price is not synchronized with the momentum changes in the MACD.
In this situation, the indicator analyzes the signal line in macd and the change in line angles to issue a correction warning; this divergence usually signals weakening of the current trend and prepares the market for a price correction.
Complex Divergence
In some conditions, the price structure simultaneously exhibits both regular and hidden divergence features.
This type of divergence often appears near important technical zones, such as structure breaks or rebounds from key support and resistance levels, and serves as a stronger signal for trend continuation or reversal.
Limitations of the MACD Indicator (MACD)
The MACD indicator has certain limitations under different market conditions, which can affect its consistency in providing trading signals.
These features are clearly mentioned in the macd indicator definition:
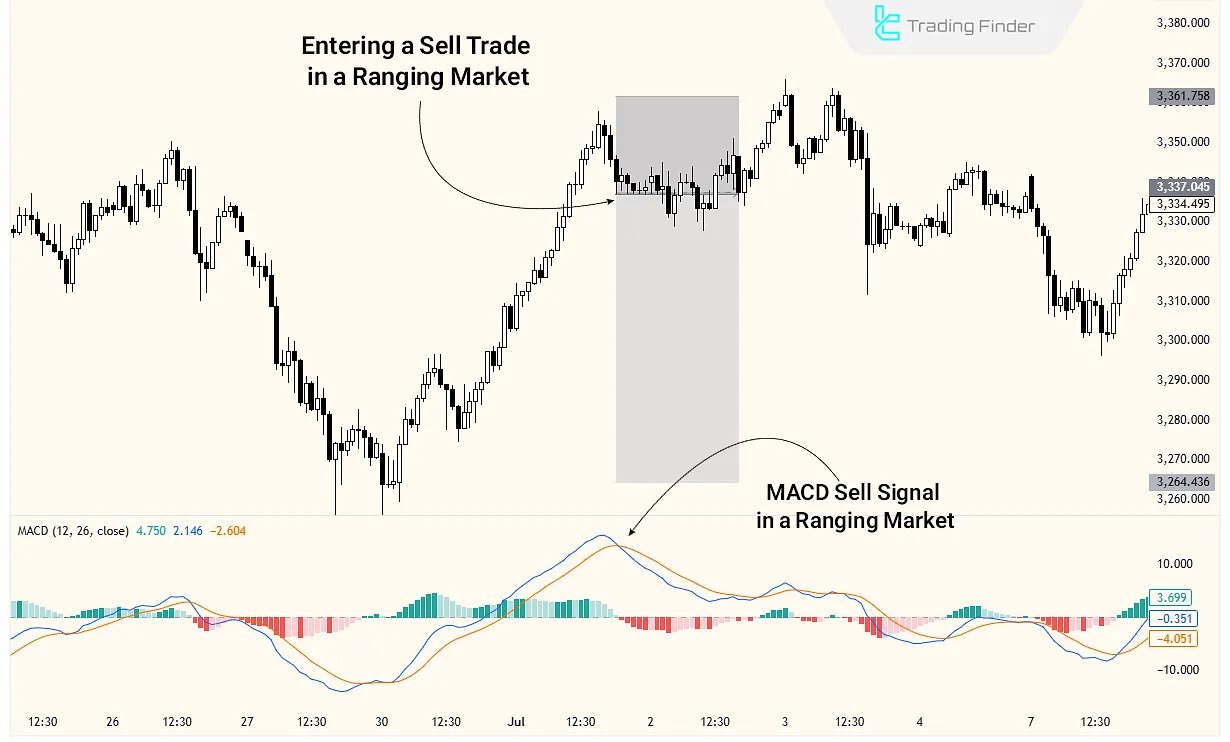
- Lack of price reaction to trend-change signals in ranging markets
- Signal delay during peak market moments with strong momentum
- Formation of false divergences in low-volatility markets
Popular Trading Strategies Using MACD
As a versatile indicator, MACD can be implemented in several defined trading strategies.
In many markets, including Forex, it is known as macd indicator forex. Advanced MACD Strategy Types:
- MACD Line Crossovers: When the MACD line crosses above the signal line in macd, it indicates a shift toward an uptrend; the opposite is considered bearish;
- Zero Line Cross: When the MACD line crosses the zero level upward or downward, it signals new momentum entering the market;
- Histogram Reversal: A shift of histogram bars from positive to negative (or vice versa) can act as confirmation of previous signals.
Common Mistakes in Using MACD
One of the main reasons for MACD’s inefficiency for some traders is the misunderstanding of its nature. The indicator is inherently lagging, meaning it reacts to price movements with a delay.
Common mistakes include:
- Entering trades solely based on a single crossover signal without considering market structure;
- Using MACD in ranging or low-volume markets, which increases false signals;
- Ignoring higher timeframes when trading short-term or not adjusting macd indicator setting properly for scalping, reducing success rates;
- Changing default settings or macd indicator setting irrationally without understanding their impact.
Guide to Detecting False MACD Signals
In conditions like ranging or low-liquidity markets, the MACD indicator tends to produce more false signals. Evaluating the position of the MACD lines relative to the zero line, line slopes, and histogram variations helps identify these fake signals.
Reviewing the position of the macd line and signal line, line slope, and histogram bar behavior is crucial in confirming valid signals.
- Position of MACD and signal lines: signals near the zero line are less reliable;
- Slope of MACD and signal lines: the steeper the slope, the more valid the signal;
- Evaluation of histogram bars: steady and strong histogram growth indicates a reliable signal;
- Combining MACD with support and resistance: overlap between MACD signals and key levels strengthens the analysis;
- Higher timeframe confirmation: signals confirmed by higher timeframes have greater validity;
- Ranging markets: MACD signals lose reliability in directionless, low-volatility conditions.
MACD Settings
The default MACD indicator settings are suitable for long-term trading and analyzing general price trends and momentum.
For short-term and medium-term trading, adjustments are necessary:
Feature | Signal Line Settings | MACD Line Settings | Suitable Timeframes | Trading Style |
High Sensitivity | EMA (5) | (5,13,16) | 1 to 15 minutes | Short-term trading |
Reduced False Signals | EMA (5) | (5,21,8) | 15 minutes to 1 hour | Medium-term trading |
High Signal Validity | EMA (9) | (9,26,12) | 4H to Daily | Long-term trading |
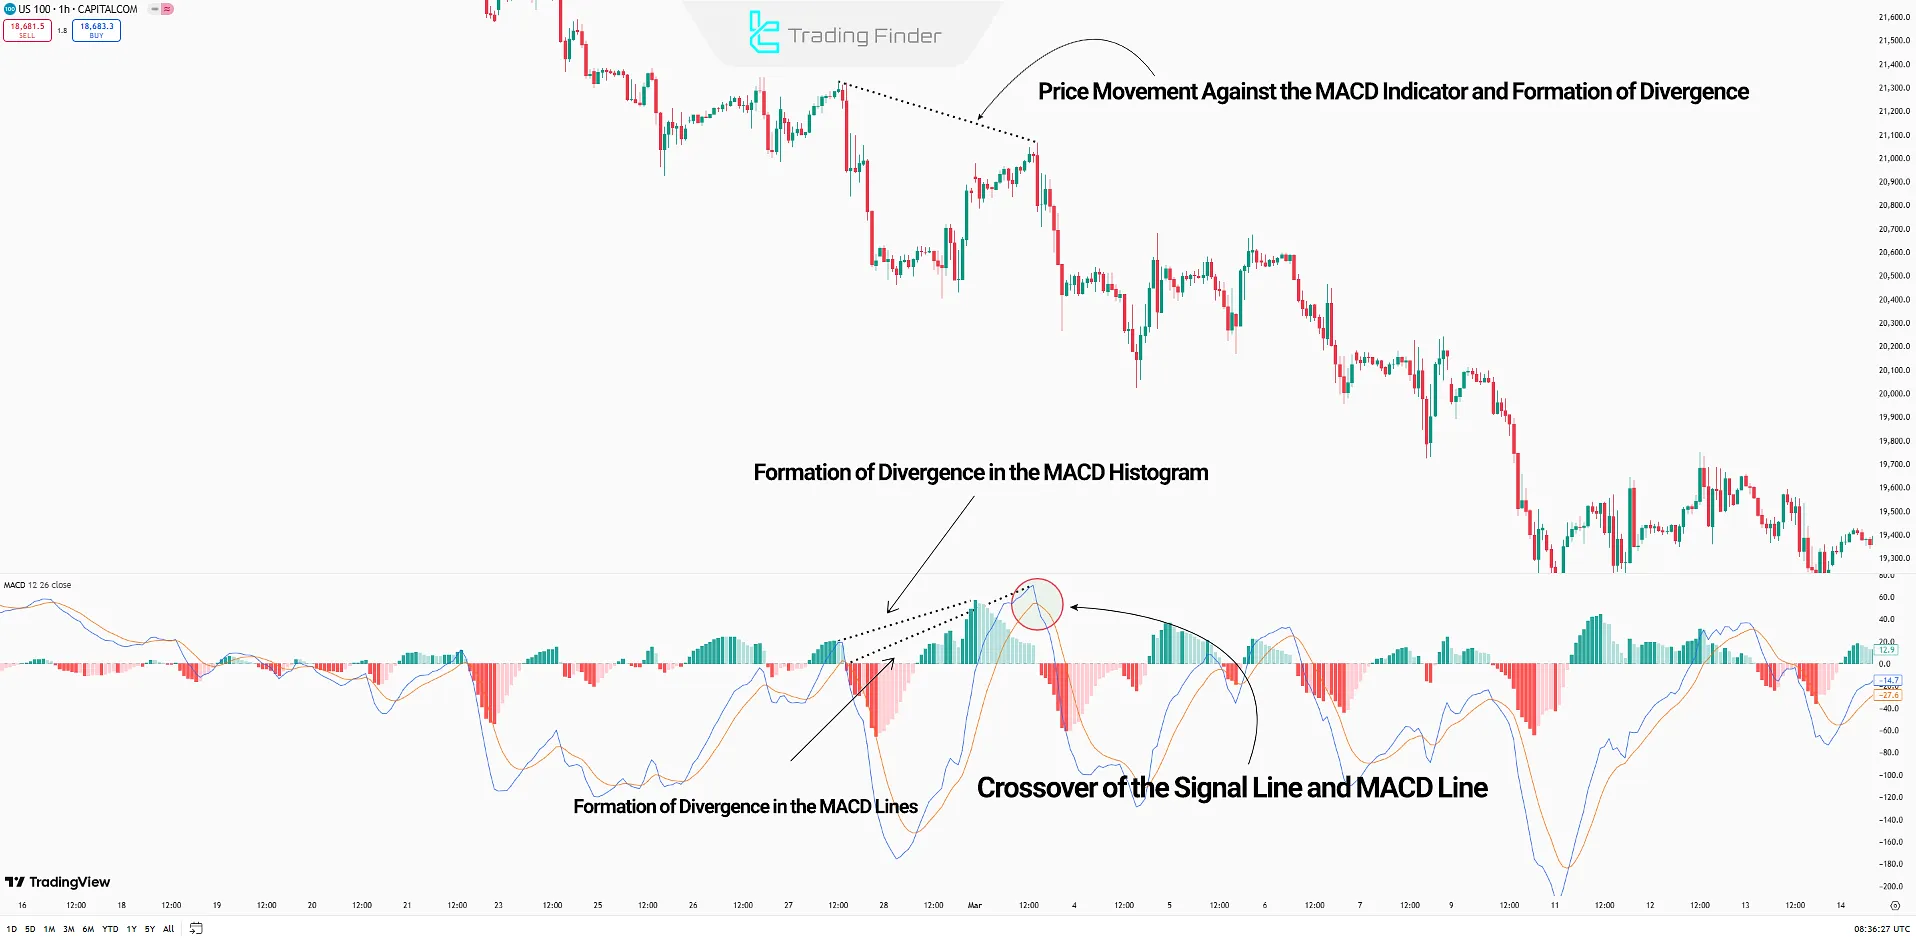
Example of MACD Working Properly in Trading
In the 1-hour Nasdaq index (US100) chart, the price forms a lower high, but the indicator forms a higher high.
The MACD indicator lines also form a higher high, confirming divergence. The MACD Line crossing the Signal Line downward provides the final confirmation for a price drop, and the price eventually falls.
Application of the MACD Indicator in Different Markets
Each market behaves differently, and the MACD is interpreted according to its specific conditions.
In the stock market, this tool is used to identify medium-term cycles, while in macd forex it is applied for short-term momentum analysis.
In the crypto market, due to high volatility, macd two lines are used to observe phase shifts and detect divergences.
The table below summarizes the application of the MACD in different markets:
Market | Main Application | Key Point |
Stocks | Identifying medium-term cycles | Analyze along with trading volume |
Forex | Measuring short-term momentum | Pay attention to higher timeframes |
Crypto | Detecting divergence and trend reversal | Risk management due to high volatility |
Comparison Between the MACD (Moving Average Convergence Divergence) and Stochastic Indicators
The structure and analytical purpose of these two indicators differ fundamentally.
While the macd full form stands for “Moving Average Convergence Divergence,” it is based on moving averages designed to display momentum changes through macd convergence divergence.
In contrast, the Stochastic indicator operates by comparing the closing price to a specific price range.
The table below compares these two indicators based on various criteria:
Feature | MACD (Moving Average Convergence Divergence) | Stochastic Oscillator |
Calculation Basis | Difference between exponential moving averages | Ratio of closing price to a defined price range |
Main Application | Detecting trend change and momentum | Identifying overbought and oversold conditions |
Primary Signal | Crossover of MACD line and zero line, or MACD and signal line | Crossover of %K and %D lines at 20 and 80 levels |
Reaction to Ranging Markets | Lower sensitivity, may give delayed signals | Higher accuracy in identifying reversal points |
Best Suited For | Strong trends and overall market structure analysis | Range-bound markets and short-term fluctuations |
Type of Signal | Momentum phase shift | Potential price reversal from extreme zones |
Comparison of MACD and RSI Indicators
The MACD is a hybrid trend-following and oscillator indicator, while the RSI is a pure oscillator that measures the relative strength of price movements.
The table below offers a full comparison:
Feature | MACD Indicator | RSI Indicator |
Type | Trend + Momentum | Momentum Oscillator |
Oscillation Range | No fixed range | 0 to 100 (typically 70/30) |
Main Signals | Crossovers/Divergence | Overbought/Oversold |
Performance in Trends | Stronger in trending markets | Better in ranging markets |
Delay | More, due to moving averages | Less delay |
Default Settings | (12, 26, 9) | 14 periods |
Strengths | Identifying trend starts and ends, histogram combination | Detecting overbought/oversold easily |
Weaknesses | False signals in ranging markets, need for confirmation | False signals in strong trends, noise in lower timeframes |
Combination Capability | Compatible with other technical tools | Compatible with other technical tools |
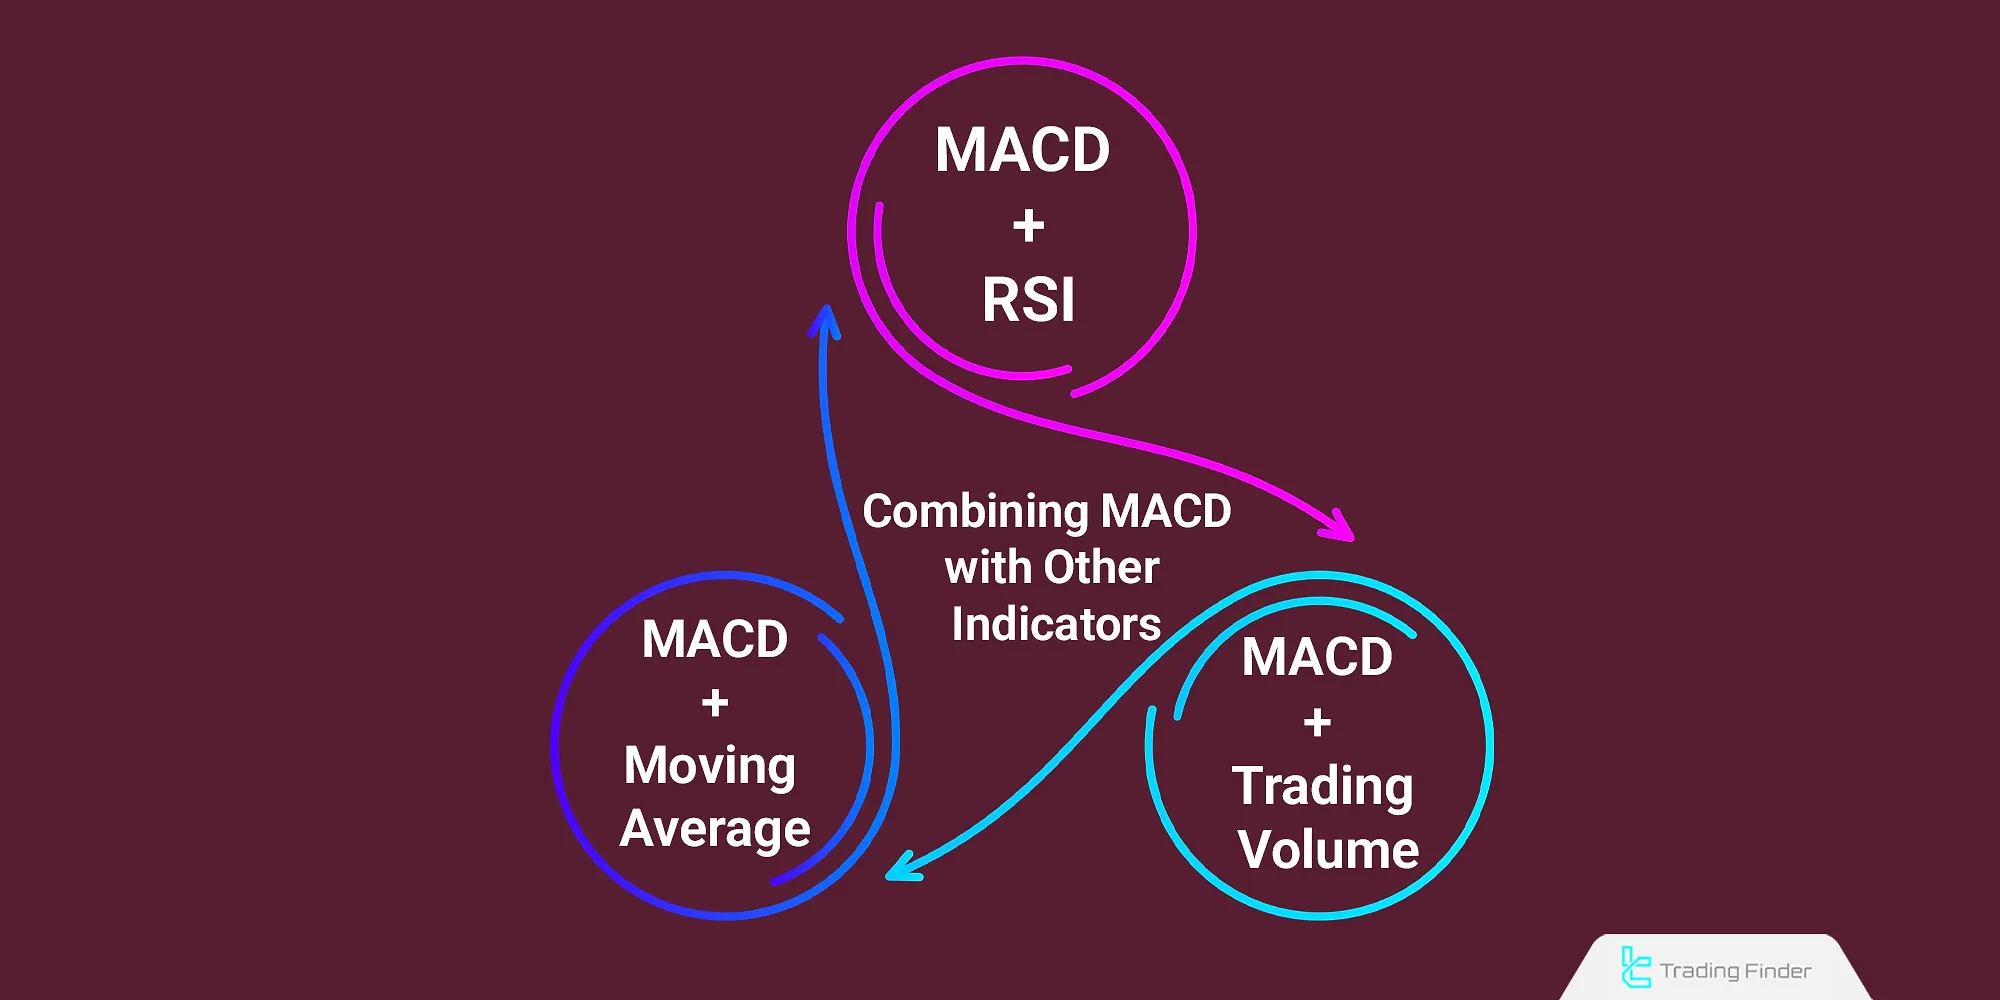
Combining MACD with Other Indicators
Using MACD alone is not always sufficient, which is why it is often combined with other indicators such as RSI or SMA.
This approach allows traders to use the macd indicator full form together with complementary indicators to filter out false signals.
- MACD and RSI Strategy: To confirm the strength or weakness of momentum;
- MACD + Trading Volume: To verify the validity of breakouts;
- MACD + Simple Moving Average (SMA): For alignment with the main trend.
Introduction to the MACD Divergence Detector Indicator on TradingView
The Divergence Detector (RSI + MACD + AO) indicator is one of the most significant hybrid tools in technical analysis, enabling traders to identify price divergences effectively.
The Divergence Detector (RSI + MACD + AO) combines powerful tools, including the full form of macd and RSI, designed specifically for detecting price divergences.
By integrating three popular indicators the Relative Strength Index (RSI), MACD indicator, and Awesome Oscillator (AO) this tool identifies potential reversal points that often appear before trend changes or major price corrections.
It is one of the most practical tools in macd indicator trading, analyzing the macd signal line alongside RSI to detect potential reversal zones.
Divergences are among the key signals for assessing trend strength or weakness. Traders who use MACD or RSI individually often encounter conflicting or delayed signals.
The combination of three indicators in Divergence Detector minimizes this issue and enhances analytical precision.
This indicator is fully available on the TradingView platform, allowing traders to quickly identify positive and negative divergences across multiple timeframes.
One notable advantage of this tool is that it is currently available for free on TradingView for a limited time. This allows traders to test its features and evaluate its real-market performance without any cost.
Main applications of the Divergence Detector indicator include:
- Detecting hidden and regular divergences between price and MACD or RSI;
- Providing confirmation signals alongside trend-following or breakout-based strategies;
- Enhancing technical analysis accuracy in volatile markets such as Forex and cryptocurrencies;
- Reducing false signals through the simultaneous combination of three reliable indicators.
The latest update of this indicator was released on September 19, 2025, and the current version has been used over a thousand times by users, gaining a strong position among TradingView analytical tools.
For traders seeking early trend-reversal detection or confirmation of entry and exit signals, the Divergence Detector is an efficient choice.
Advanced MACD Indicator:
A combined MACD Divergence Indicator (MACD, RSI, and AO) designed for TradingView
Conclusion
Momentum analysis in the MACD indicator is based on the behavior of the MACD Line, Signal Line, and Histogram, especially when they form a valid divergence structure.
This indicator can be used in long-term, medium-term, and short-term trades with different settings.
In low-momentum markets, relying solely on MACD may lead to errors; combining indicators like MACD + RSI + AO is better under such conditions.


