


In technical analysis, trading requires defined levels where price behavior is predictable. The Pivot Point Indicator is designed with this very goal in mind: identifying price levels where market reactions are likely. This indicator calculates points based on the previous day's price data, which can serve as a foundation for trend strength analysis, entry and exit signals, or even signal validation.
Unlike lagging indicators, Pivot Point is data-driven and operates based on precise calculations. This makes it a useful tool for short-term trading, especially in high-volatility markets.
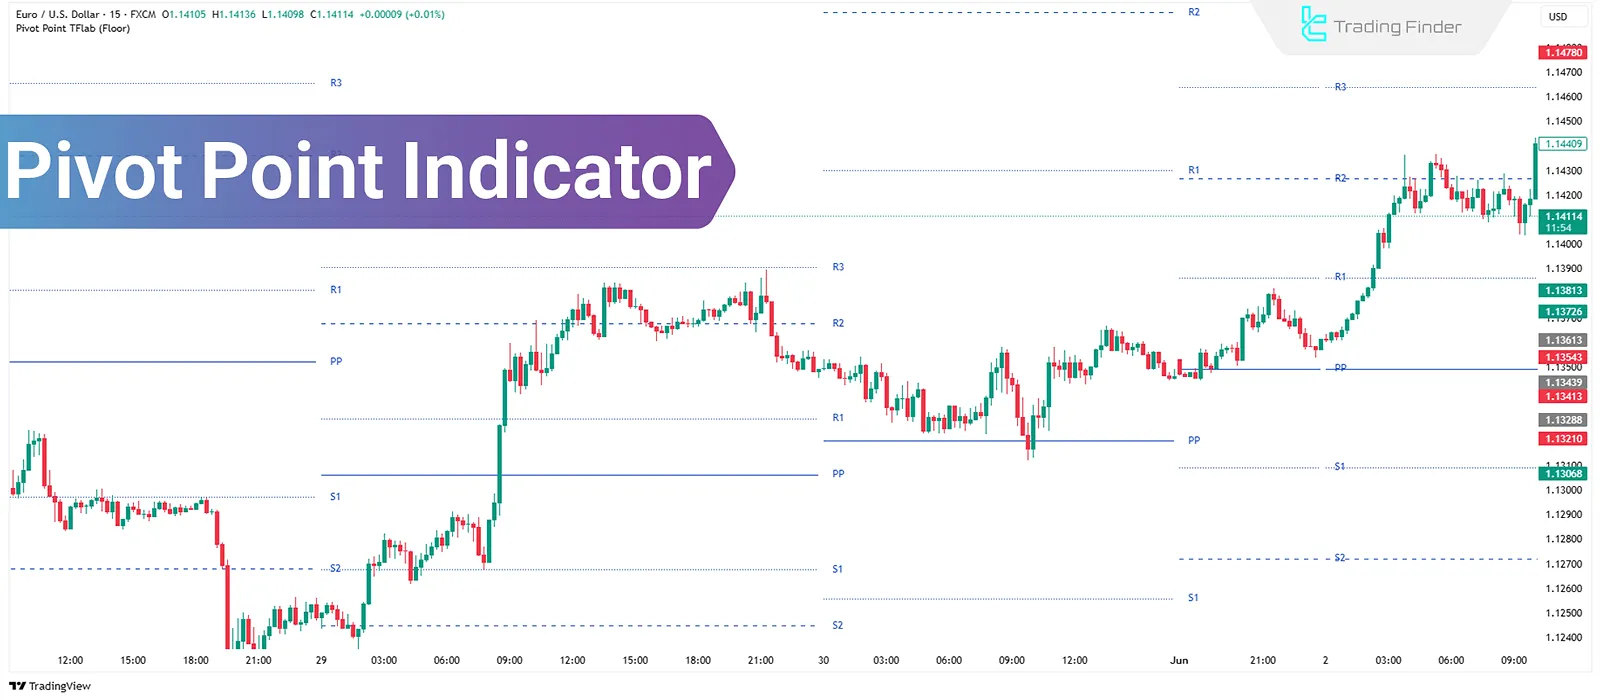
What Is the Pivot Point Indicator?
In financial markets, especially in short-term trading, there are levels that prices frequently react to, because many traders monitor them closely. Pivot Point is one such level, calculated using the previous day's data and used to assess trend strength and market direction for the following day.
Unlike manually drawn support and resistance, Pivot Point is numerical, making it more reliable for formula-based analysis, particularly in volatile markets.
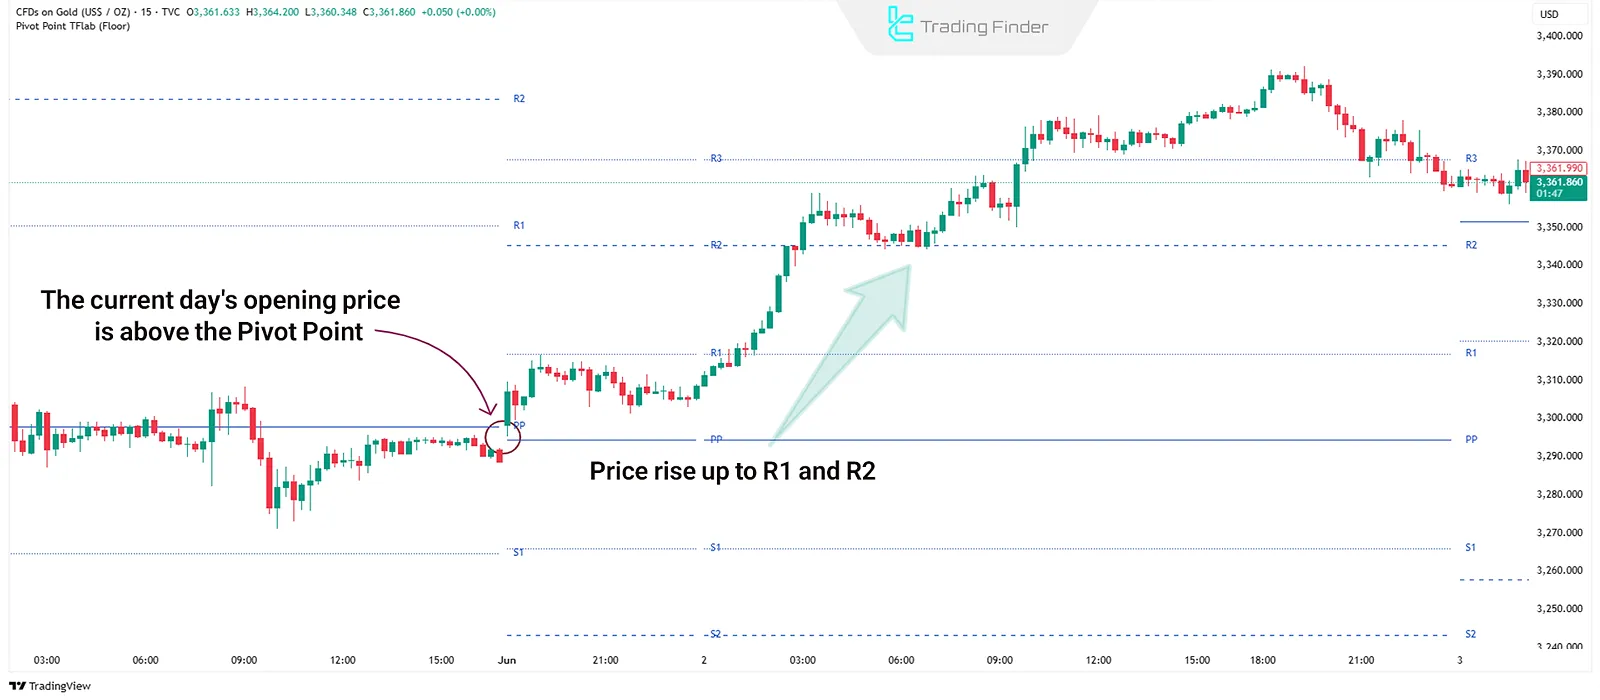
Day traders use pivot levels to determine entry, exit, and stop-loss points. If the price opens above the Pivot Point, bullish bias is more likely; conversely, if it opens below, bearish pressure may dominate.
The Four Main Methods of Calculating the Pivot Point Indicator:
- Floor: Simple and common
- Camarilla: Ideal for short-term reversals
- Woodie: Emphasis on closing price
- Fibonacci: Combines Fibonacci ratios with classic pivots
To use the Pivot Point indicator to identify potential market reaction levels, you can refer to the following links:
- Pivot Point Indicator on MetaTrader 4
- Pivot Point Indicator on MetaTrader 5
- Pivot Point Indicator on TradingView
Floor
The Floor or Standard method is the simplest type of pivot calculation, commonly used in technical analysis. In this method, levels are calculated from the average of the previous day's high, low, and close prices, and are used to forecast the next day's market trend.
Use of Floor in Trading
If the current day's price opens above PP and continues in the same direction, there's potential movement towards R1 or R2. Conversely, if it opens below PP and remains bearish, the price might reach S1 or S2.
These levels often act as entry points (e.g., R1 breakout) or exit zones (e.g., hitting S2). They're also useful for placing stop-losses in short-term strategies.
Camarilla
The Camarilla model is a more advanced method of pivot calculation that provides eight support and resistance levels instead of the typical three or four. This model focuses more on minor price fluctuations, making it more effective for short-term or scalping trades.
Use of Camarilla in Trading
Camarilla is best suited for traders seeking rapid price movements and quick reversals. These levels are especially valuable for setting precise stop-loss and take-profit orders. R3 and S3 are often used as reversal points, while R4 and S4 can indicate trend breakouts.

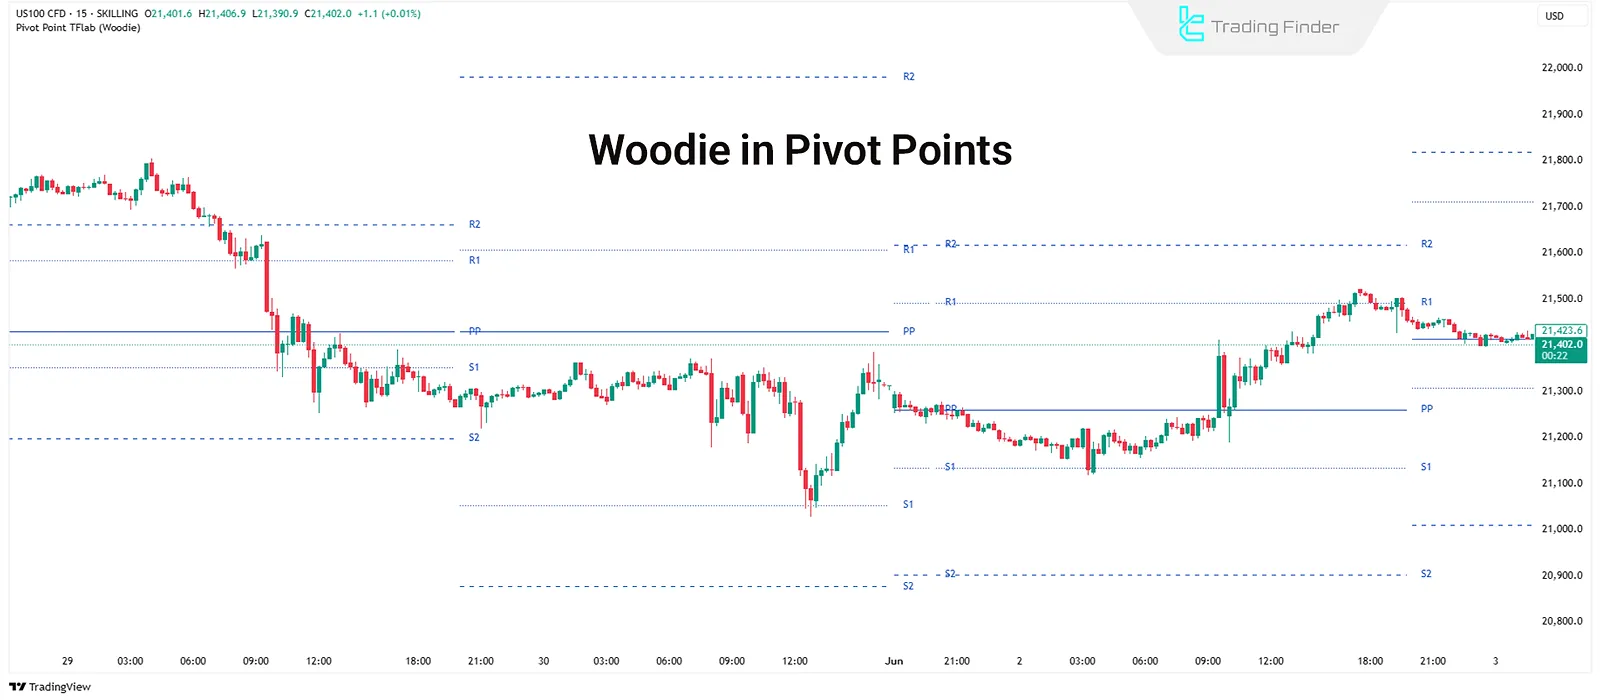
Woodie
The Woodie model is a variation of the classic pivot where the closing price carries more weight. This causes calculated levels to differ from the Floor Pivot, especially when the market opens with a gap.
Use of Woodie in Trading
The Woodie model works well in markets where price gaps frequently occur between sessions (e.g., futures or certain indices). Since the previous day's close is weighted more heavily, it plays a more decisive role in shaping the next day's price behavior.
If the prior session closed on strong buying pressure, the PP in Woodie will usually be higher than in the Floor model.
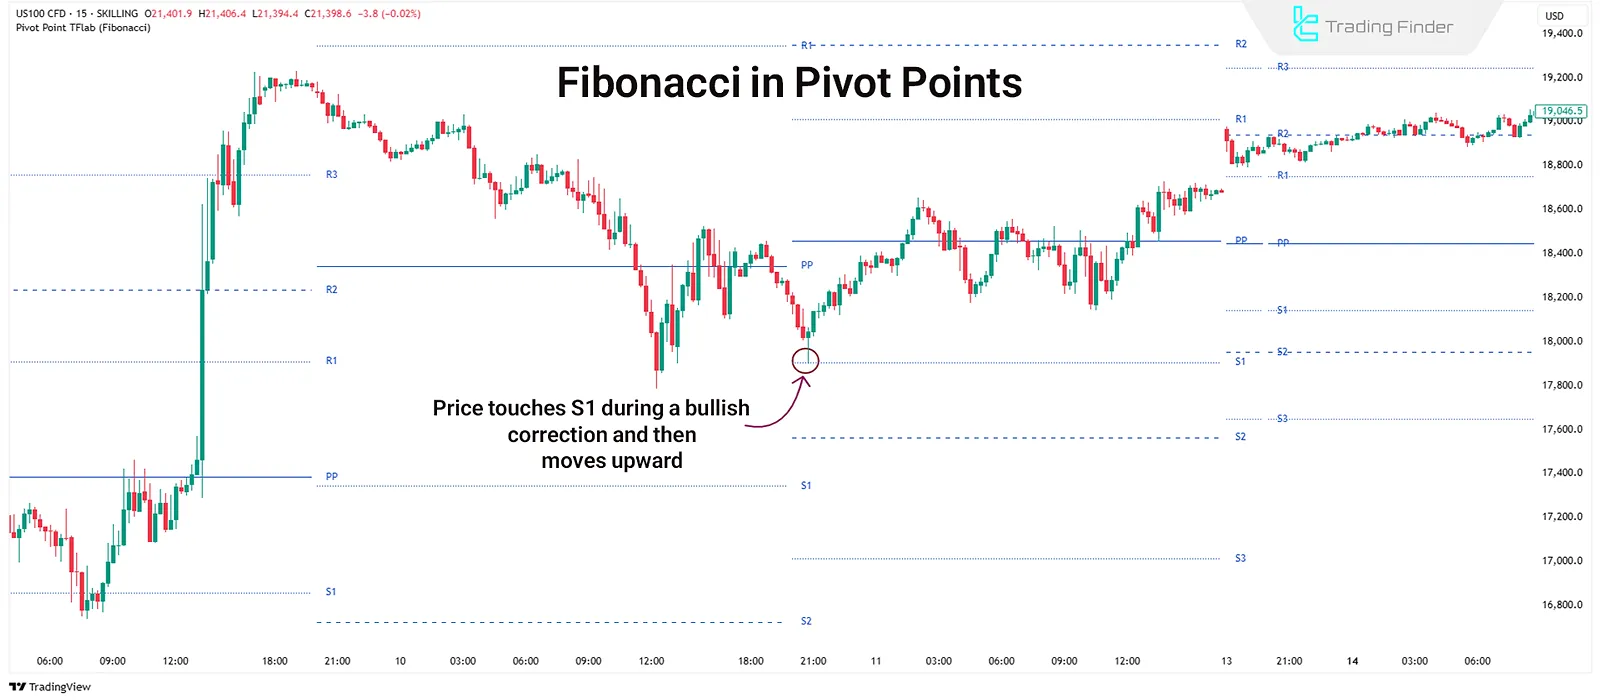
Fibonacci
The Fibonacci model is an extended version of the classic pivot. Instead of just using the high-low range, it incorporates Fibonacci ratios into the calculation. The resulting levels are not only formula-based but also aligned with retracement logic.
Use of Fibonacci in Trading
This model is typically used in swing trading strategies, where the goal is to capture reversal movements from specific levels. Since these levels align with the market's natural tendency to retrace specific percentages of prior moves, entry and exit points tend to be more precise.
For example, during a pullback in an uptrend, S1 or S2 can offer good buy entries with a stop-loss below S3. On the upside, R1 and R2 often serve as targets.
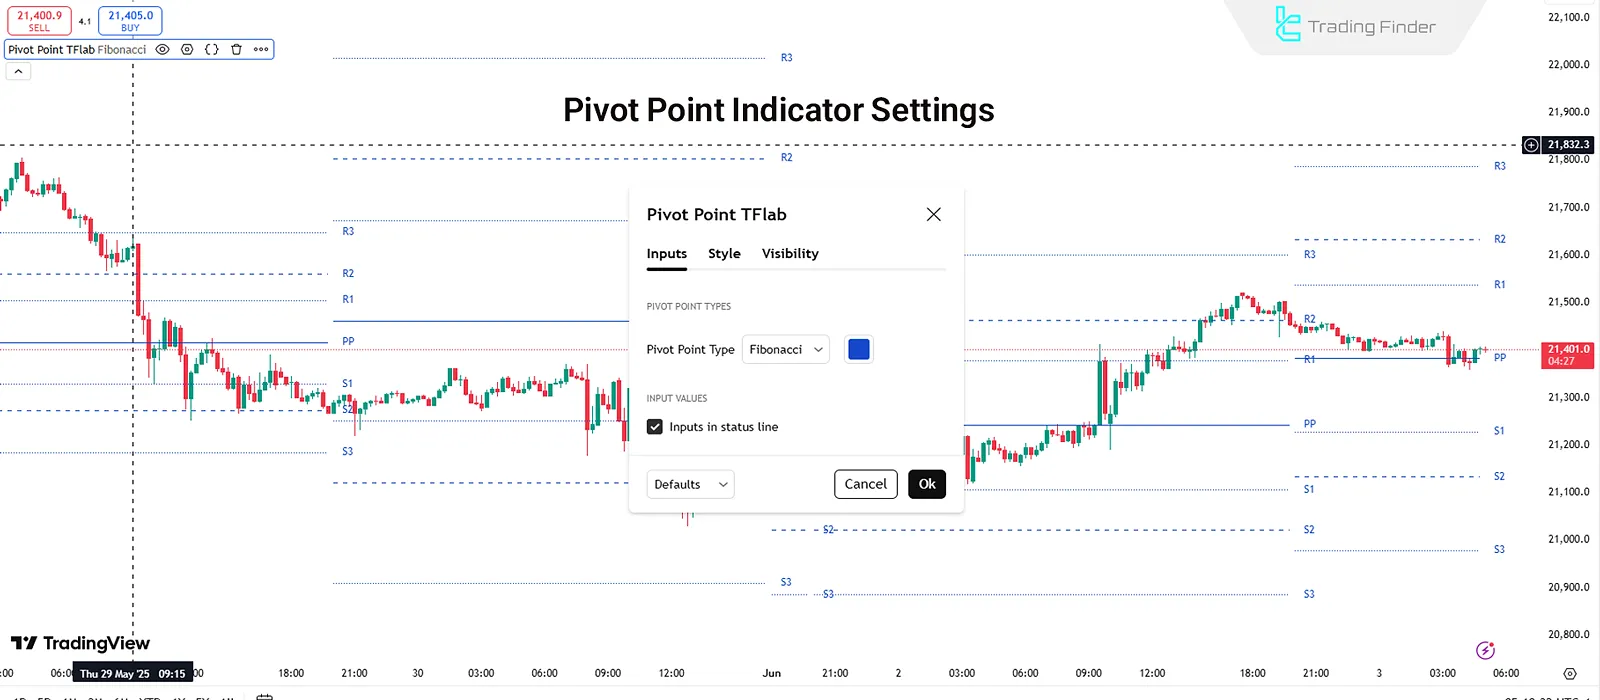
Components and Settings of the Pivot Point Indicator
The Pivot Point Indicator generally includes a central level labeled PP (Pivot Point) and several support (S1, S2, S3) and resistance levels (R1, R2, R3). In methods like Camarilla or Fibonacci, this number may reach four or more.
Settings of the Pivot Point Indicator
Users can choose the desired calculation method (Floor, Woodie, Camarilla, Fibonacci) in the settings. Activating "Inputs in status line" shows key values (like PP, R1, S1) on the chart's top status bar.
Trading Strategies Using Pivot Points
Traders typically apply two main approaches when using Pivot Points such as Breakout and Price Reversal.
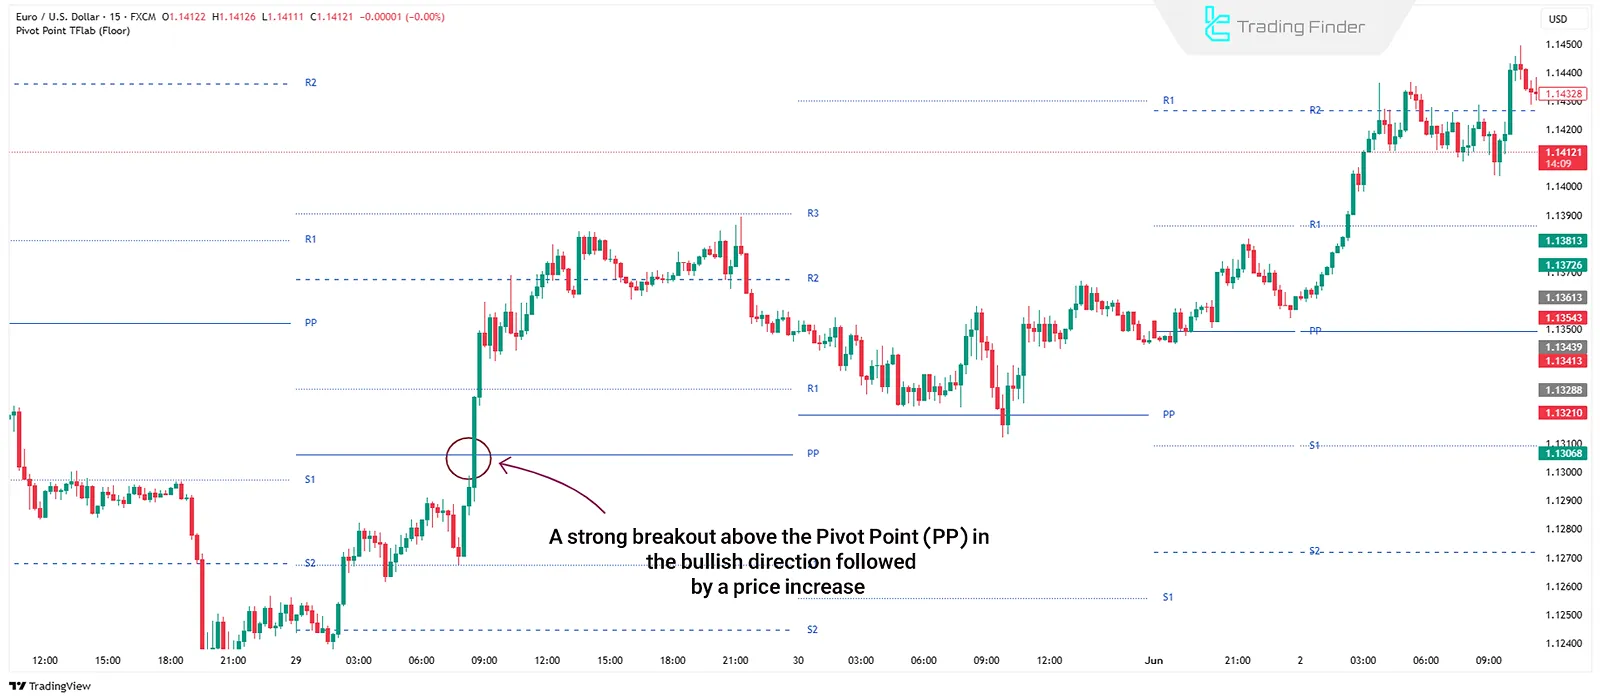
Breakout Strategy
When the price strongly breaks one of the key pivot levels (S1, R1, PP, etc.), traders may enter a trade in the direction of the breakout. This strategy is ideal for breaking out of range phases or initiating new trends.
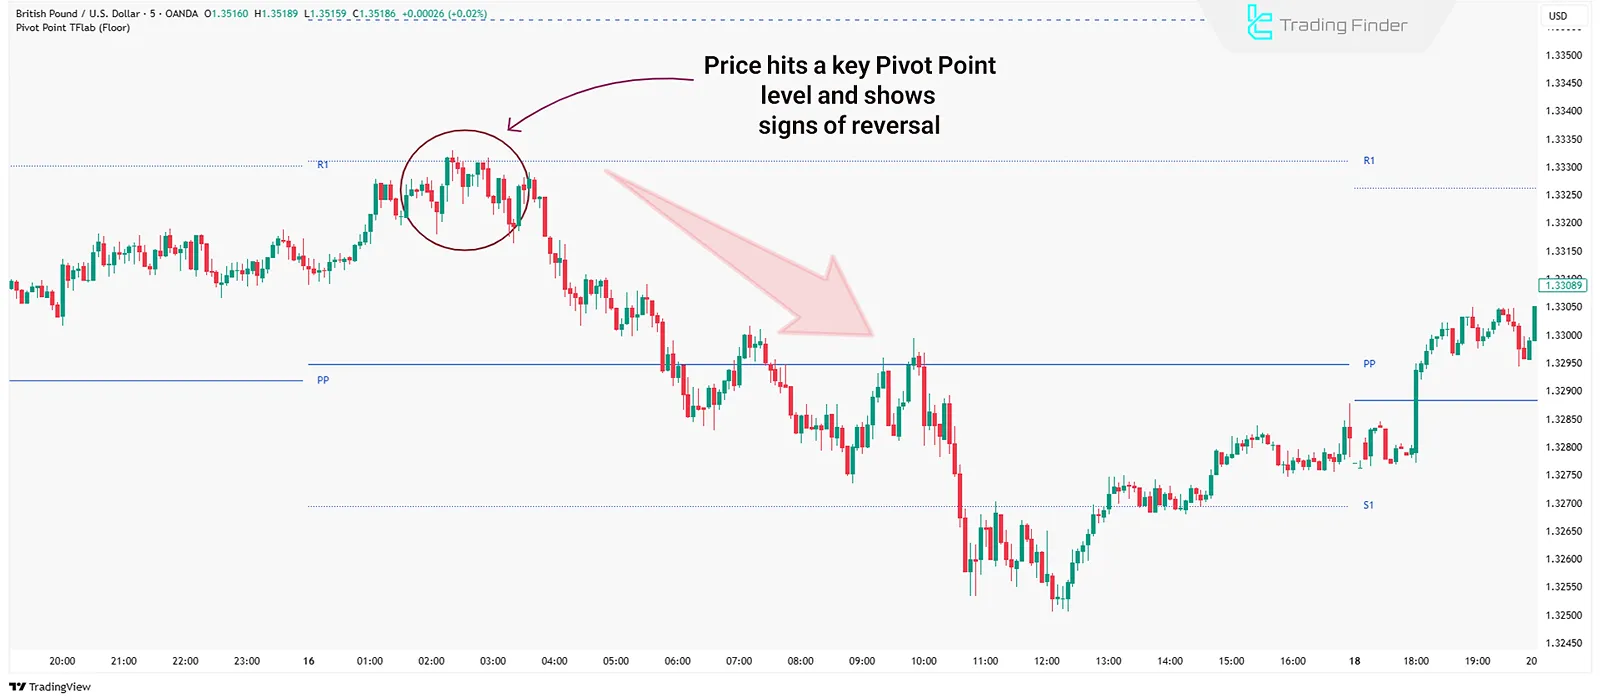
Price Reversal Strategy
Instead of breakouts, this strategy focuses on price bouncing off key pivot levels. Traders wait for the price to reach a support or resistance level and show reversal signs, then trade against the trend.
Conclusion
Pivot Point is a calculation-based tool used to identify important price reaction levels, offering high precision in day trading and algorithmic strategies. Selecting the appropriate method should align with the market structure and timeframe.
Combining this indicator with other technical tools and price action techniques can reduce strategy errors. Pivot Points not only define entry and exit points but also illustrate the structural logic of the daily trend.


