


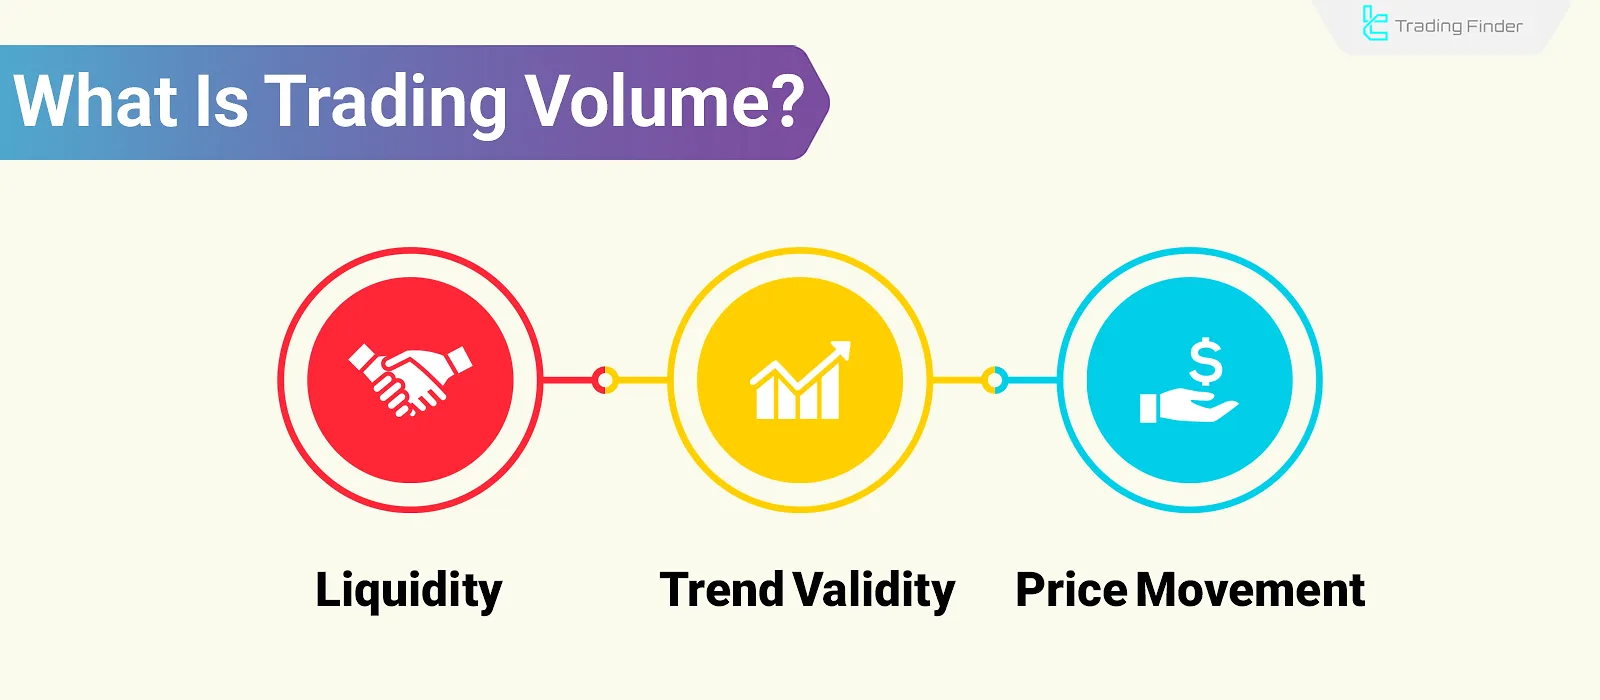
Trading volume in financial markets is considered a benchmark for assessing liquidity, price momentum, and the validity of ongoing trends.
An increase in volume aligned with price movement indicates the strength of the prevailing trend, while a decline in volume may signal weakening momentum.
At key levels such as support and resistance, high trading volume increases the likelihood of a trend reversal.
High volume is typically associated with active trader participation and market excitement, whereas low volume often reflects market hesitation or waiting behavior.
Many tools, including indicators such as the Money Flow Index (MFI), On-Balance Volume (OBV), and Volume Spread Analysis (VSA), are designed based on trading volume in technical analysis.
What Is Trading Volume in Financial Markets?
Trading volume represents the total number of buy and sell transactions on a particular trading asset or across the entire market within a specific timeframe; This timeframe could be defined as daily, weekly, or monthly.
This indicator plays a crucial role in evaluating the strength of price movement and measuring the market’s interest in a given asset.
For further familiarity and a better understanding of Trading Volume, you may also refer to the educational video from the UKspreadbetting channel.
Formula for Calculating Trading Volume
In order to calculate Trading Volume in financial markets (stock market, cryptocurrency, forex, etc.), the formulas and definitions differ slightly, but their overall framework remains the same.
Let’s now examine the formulas for calculating Trading Volume in a professional manner.
Trading Volume for a specific asset, such as a stock, cryptocurrency, or others, is calculated as follows:
Calculation of transaction value is done in such a way that sometimes, instead of the number of units, the dollar value of trades is important, and in this case it is calculated as follows:
If Trading Volume is to be analyzed for only one asset, the total number of units bought and sold during a specific period of time is considered; but if the entire market is the subject (for example, the whole stock market or crypto market), then the calculation formula is as follows:
The difference between Volume, Turnover, and Market Cap
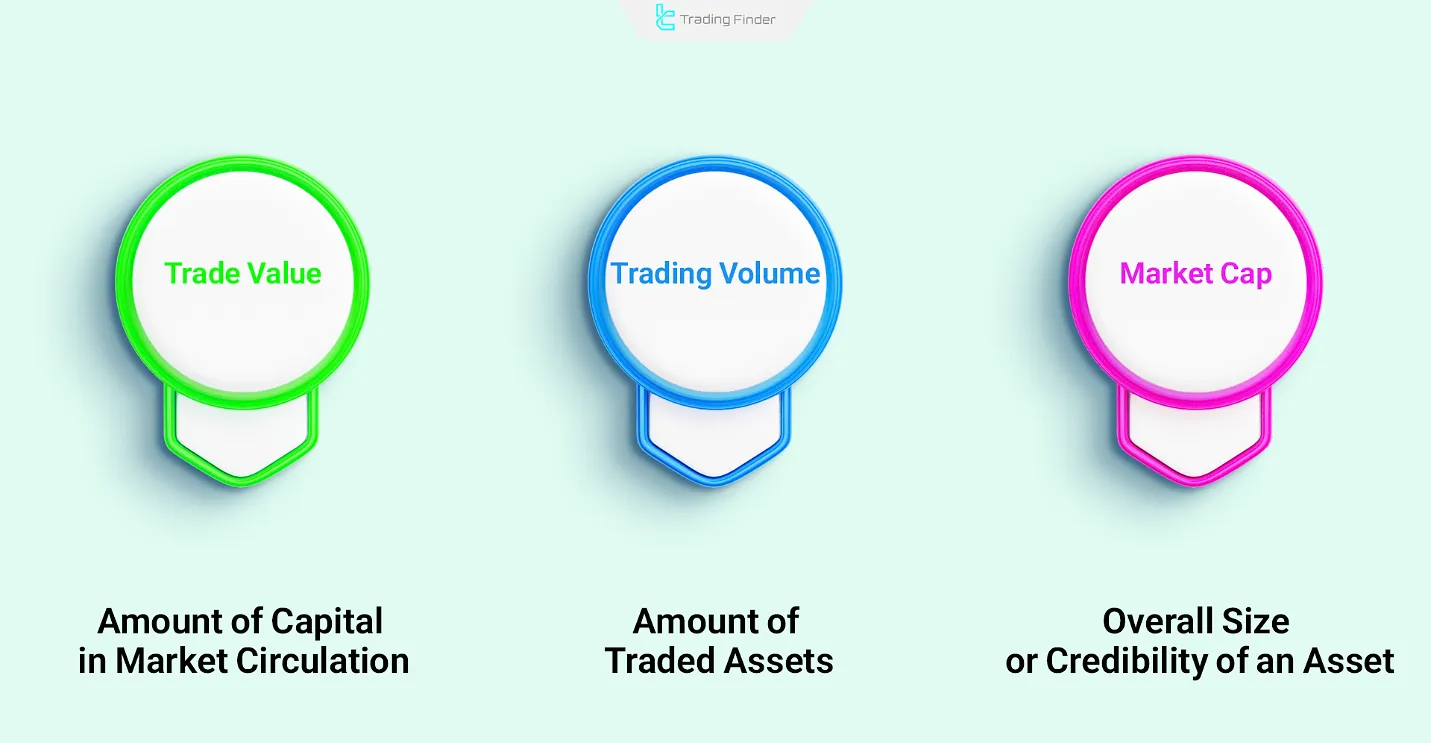
Trading volume (Volume) represents the number of units traded within a specified timeframe; for example, the number of shares or units of a digital asset that have been bought and sold.
Turnover indicates the amount of cash exchanged during trading and is calculated by multiplying the volume by the price per unit of the asset.
Market Cap represents the total value of an asset or a company in the market, which is calculated by multiplying the current price of each unit by the total circulating supply.
Unlike Trading Volume and Trade Value, which are dependent on short-term activities, this indicator serves as a broader and long-term measure for evaluating the size and position of an asset in the market.
- Trading volume specifies the amount of the asset traded;
- Turnover shows the amount of capital flowing through the market;
- Market Cap: Represents the overall size or credibility of an asset or a company.
All three indicators play an important role in evaluating market conditions. In the table below, we provide a professional comparison of these three factors:
Index | Professional Definition | Analytical Purpose | Strengths | Limitations |
Volume | Number of trades or units exchanged within a given time period | Measuring liquidity and market activity | Indicates market dynamism and trader attention | Short-term factors, speculation |
Value | Total monetary amount (in local currency or USD) of trades within a time period | Assessing the level of capital inflow or outflow | Provides a clearer picture of money flow intensity compared to volume | High volatility, misleading signals |
Market Cap | Current price × total circulating supply | Determining the relative size and weight of an asset/company in the entire market | Standard metric for comparison and classification (large, mid, small cap) | High sensitivity to price fluctuations, divergence from intrinsic value |
The Role of Volume in Identifying the Actions of Major Market Players
Trading volume in financial markets is one of the primary tools for tracking the behavior of large institutions such as banks, investment funds, and whales.
These players influence the market structure through heavy capital movements and often use complex methods to hide their footprint. However, through volume analysis, traders can identify clues about the entry or exit of smart money.
For further review and information on Trading Volume in financial markets, refer to the article Trading Volume Tutorial on investopedia.com.
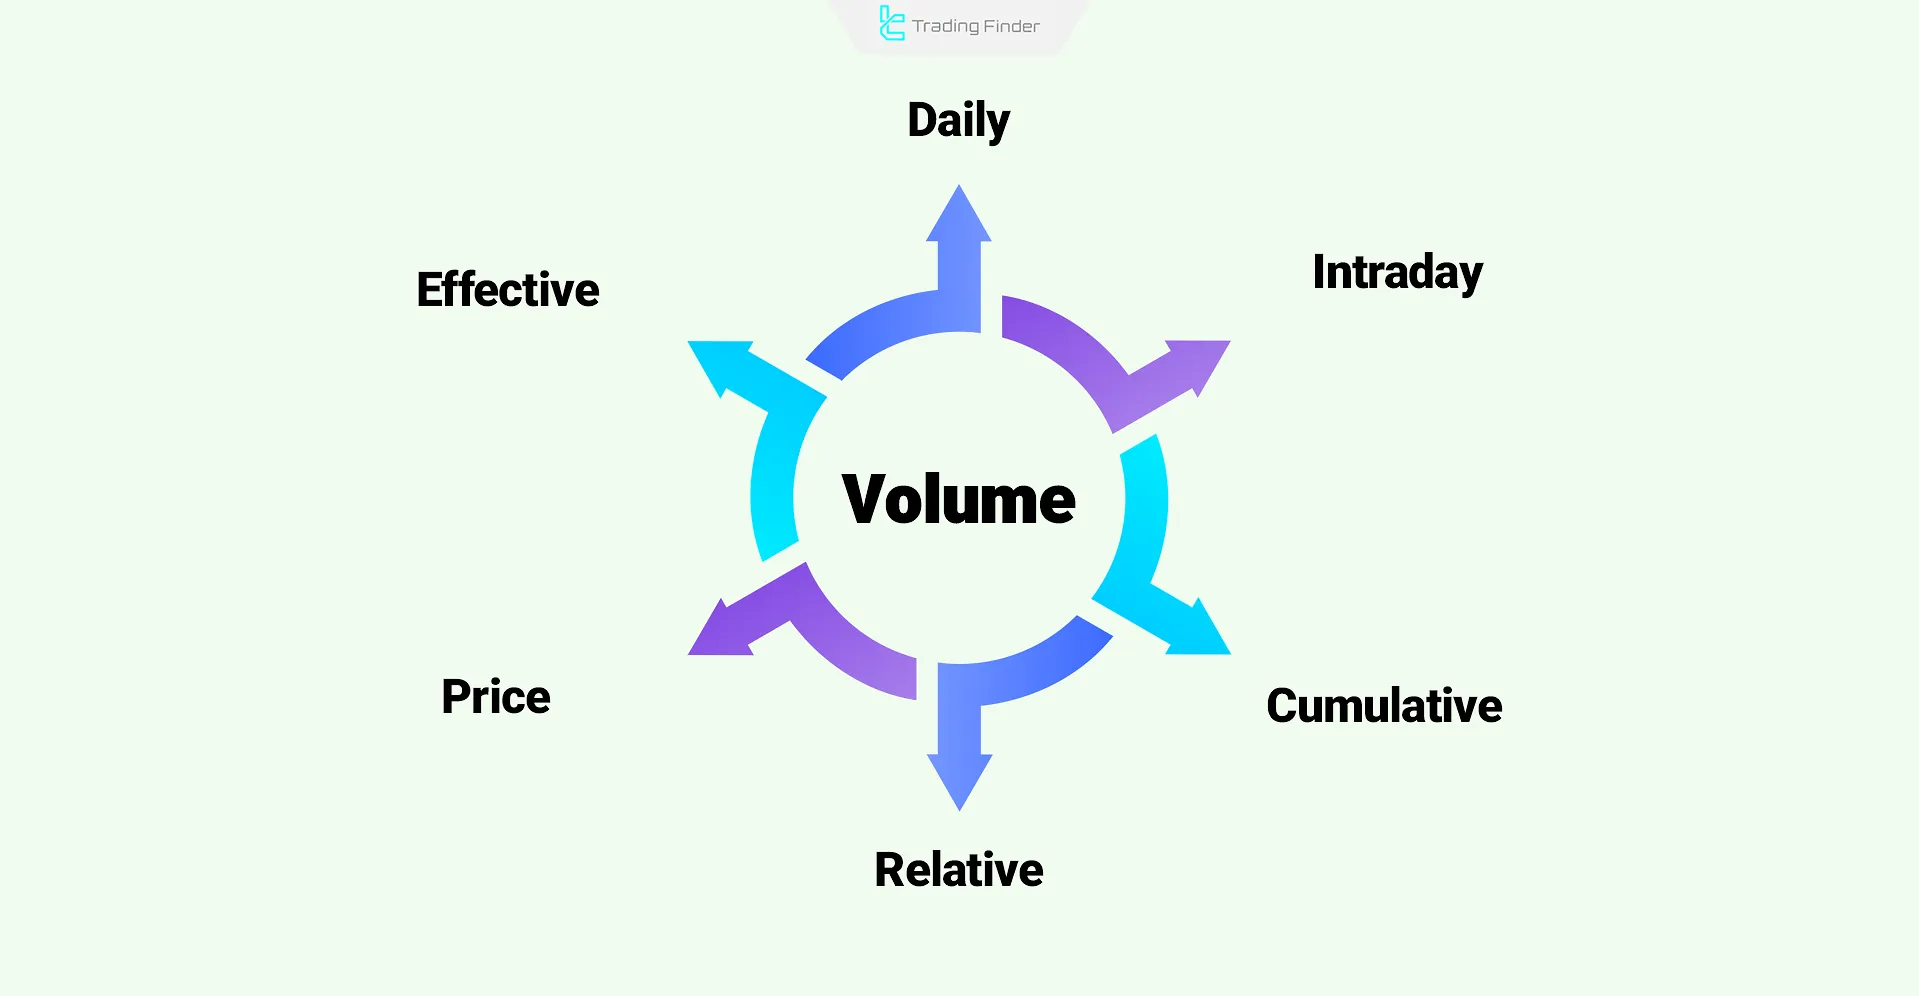
Types of Trading Volume
Different types of trading volume in financial markets each provide a unique perspective on market behavior and liquidity flow.
These are used for analyzing market activity in both short-term and long-term timeframes. The types include:
- Daily Volume: Indicates the total number of transactions recorded in a single trading day and is the most commonly used volume type in market analysis;
- Intraday Volume: Refers to the volume of transactions in shorter timeframes such as 5 or 15 minutes, primarily used in scalping and short-term strategies;
- Cumulative Volume: Thesum of volumes over a specific timeframe, used to examine liquidity trends in the market;
- Relative Volume: Displays the current volume compared to historical averages; values above 1 suggest unusually high trading activity;
- Volume by Price: Displays the trading volume at specific price levels, serving as an effective tool for identifying hidden support and resistance zones;
- Effective or Real Volume: Differentiates between buying and selling volume using more granular market data, often tied to Level 2 data and institutional behavioral analysis.
Different Approaches to Calculating Trading Volume
Approaches to calculating Trading Volume vary depending on market structure and the type of available data, with each method offering a different view of liquidity flow:
- Exchange-based Volume: Recording the number or value of trades on a specific exchange or marketplace;
- Tick-based Volume: Each price change is counted as a tick, equivalent to volume in forex markets and environments lacking transparent data;
- Quantitative Volume: Using mathematical models and statistical data to estimate actual volume, especially in over-the-counter (OTC) markets.
Trading Volume in Different Markets (Cryptocurrencies, Stocks, Commodities, and Forex)
In financial markets, the concept of trading volume remains consistent, but its interpretation and level of importance vary depending on the structural characteristics of each market.
The role and features of trading volume in financial markets are outlined as follows:
- Stock Market: High volume accompanied by price growth signals the entry of smart money and confirms bullish trends. Volume analysis becomes even more critical near resistance zones;
- Forex Market: Due to its decentralized nature, tick volume or broker-provided data is used. Volume spikes may reflect the activity of banks and large institutions;
- Cryptocurrency Market: Volume is examined both at the exchange level and on the blockchain network. High volume is often associated with increased price volatility;
- Commodities Market: Simultaneous analysis of volume and open interest helps detect new liquidity inflows or trend continuation.
Note: In the cryptocurrency market, looking only at daily Trading Volume is not sufficient.
Other types such as Exchange Volume, On-Chain Volume, DApp Volume, and Total Market Volume also exist, each providing traders with important information.
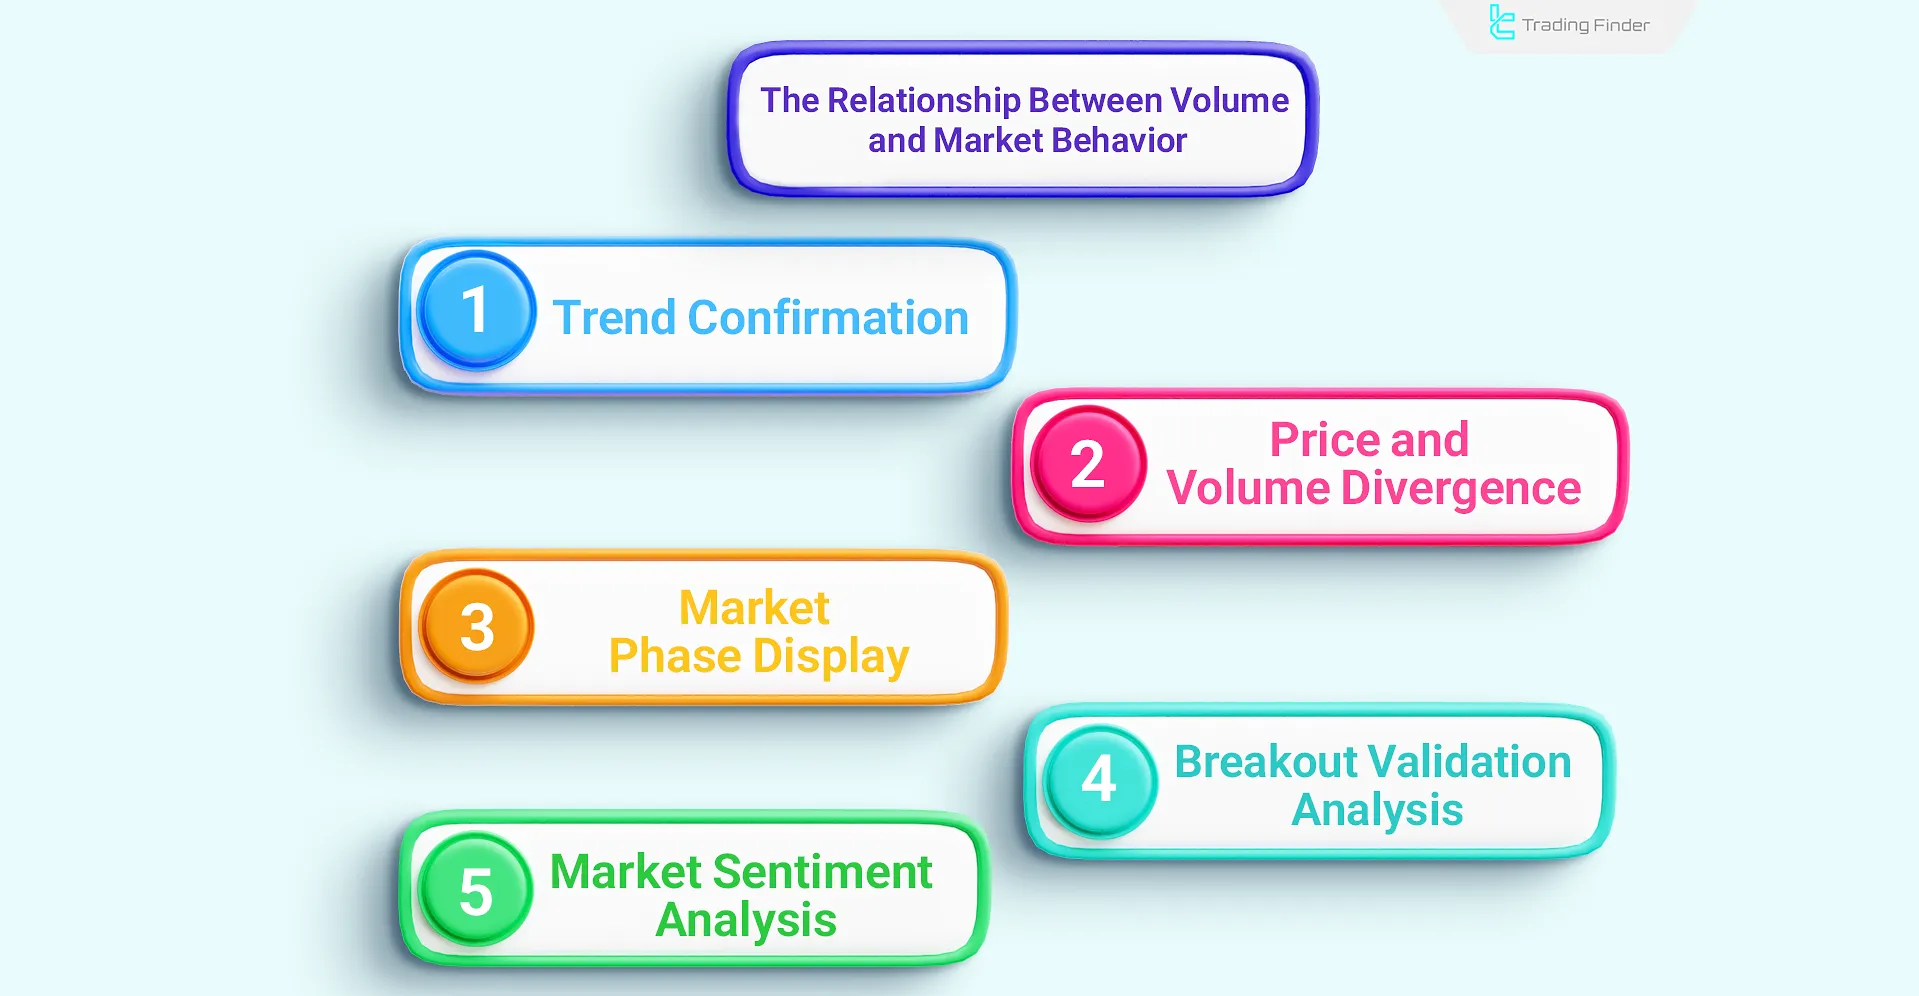
The Relationship Between Volume and Market Behavior
Trading volume (Volume) is one of the few market variables that is difficult to manipulate. This makes it a reliable tool for identifying actual liquidity flows and tracking the intentions of major players.
In financial markets, any price movement is only considered valid if it is accompanied by corresponding volume.
Otherwise, the move is seen as weak or untrustworthy. The key relationships between volume and market behavior are:
- Trend Confirmation: A price move is only valid if accompanied by increased volume. High volume during an uptrend confirms smart money entry, while low volume often signals weakness or instability in price movement;
- Volume-Price Divergence: If price reaches a new high or low but volume decreases, this may indicate a weakening trend and a potential volume divergence often considered a reversal signal in trading volume in technical analysis;
- Market Phases: In theaccumulation phase, price remains within a narrow range while volume increases, indicating entry. In the distribution phase, selling at tops with high volume points to smart money exit;
- Breakout Validation: A breakout at key levels is only valid when accompanied by high volume. Without volume, there's a higher chance of a false breakout and subsequent price reversal;
- Market Sentiment Assessment: Sudden volume surges during critical times like major news or trend shifts often stem from extreme fear or greed. If coupled with high volatility and long candlestick wicks, it may signal a market phase transition.
Trading Volume and Market Momentum
Trading Volume is not merely a measure of counting orders; this indicator has a direct relationship with Momentum, meaning the speed and intensity of price movement.
When price moves upward rapidly along with an increase in volume, the reliability of the trend is reinforced.
Conversely, a decline in volume while price continues to rise increases the likelihood of weakening momentum and the beginning of a reversal.
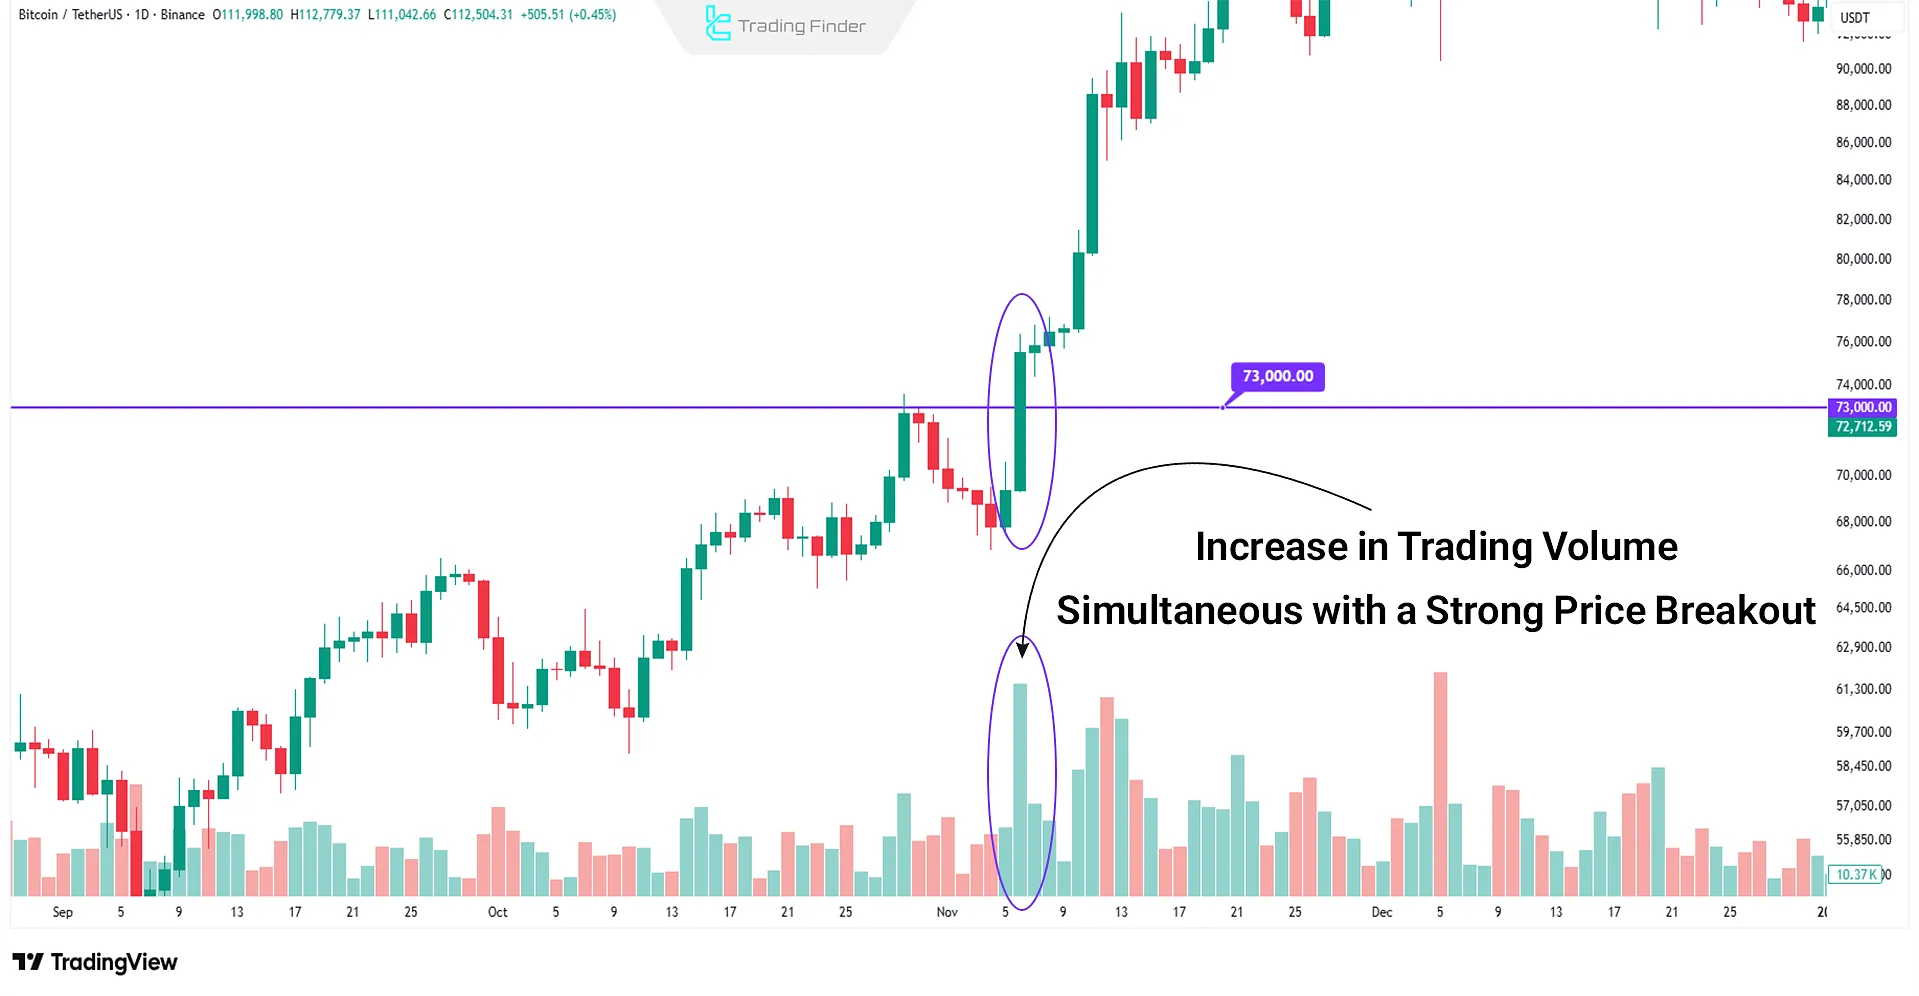
Example of the relationship between volume and market momentum
In Bitcoin’s uptrend, if Trading Volume surges simultaneously as the price breaks through a key resistance level (for instance, around $73,000), this indicates the validity of the breakout and the likelihood of the trend continuing.
However, a breakout with low volume is often considered a false breakout and may lead to a quick price reversal.
Why Is Volume Analysis Important and How Can It Be Used?
Trading volume in financial markets is the only variable that directly reflects the actual level of market activity.
Unlike price which is merely the result of the interaction between buyers and sellers volume indicates how much participation was behind a price move, as well as the strength or weakness of that move.
Key uses of trading volume in financial markets include:
- Trend Confirmation: Strong trends are typically supported by high volume; a drop in volume may indicate weakness or a potential reversal;
- Identifying Reversal Points: A volume spike at a top or bottom often serves as an early warning of a market phase change;
- Filtering False Breakouts: A valid breakout must be accompanied by high volume;
- Tracking Smart Money: Methods like VSA) Volume spread analysis( and ICT utilize volume to uncover the entry and exit points of whales and institutions;
- Asset Liquidity: High volume signals a more active and less risky market for short-term traders.
Combining volume data with price action, candlestick patterns, or advanced indicators enables traders to identify hidden liquidity flows especially relevant in markets dominated by large institutional players.
Types of Tools and Indicators Related to Volume
Various technical volume analysis tools play a critical role in identifying smart money movements, liquidity flows, and the strength of market trends. The key tools and indicators related to trading volume in technical analysis include:
- Raw Trading Volume (Volume)
- On-Balance Volume (OBV)
- Volume Profile or Volume by Price
- Money Flow Index (MFI)
- Accumulation/Distribution Line (A/D Line)
- Volume Weighted Average Price (VWAP)
- Volume Spread Analysis (VSA)
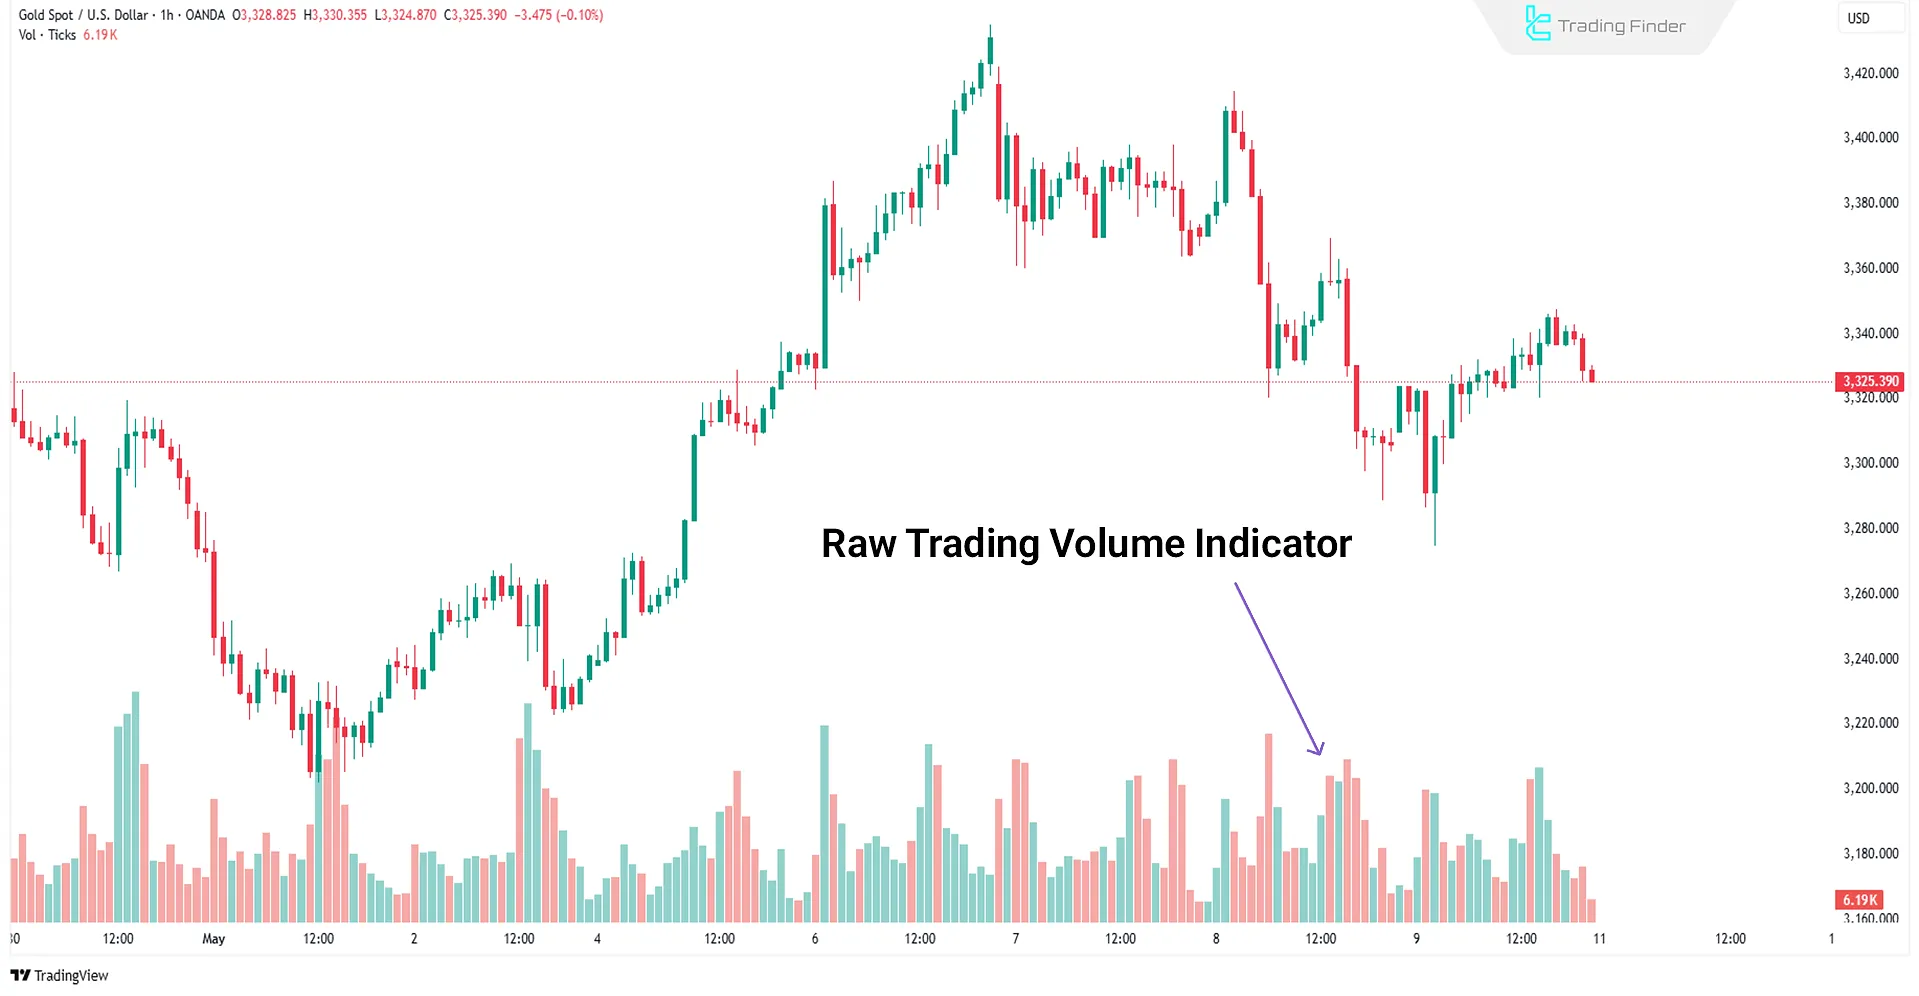
- Volume Indicator (Raw Volume)
The raw volume indicator (Volume) is a key tool in volume analysis. It shows how many units of an asset such as a stock, currency, or cryptocurrency were traded in each candlestick, without differentiating between buying and selling transactions.
- Breakout Validation: A volume increase during a support or resistance breakout confirms the validity of the move;
- Price Corrections: Adecline in volume during pullbacks increases the likelihood of trend continuation;
- Reversal Points: A volume spike at a price top or bottom, combined with meaningful candlestick patterns like Pin Bar or Engulfing, signals a potential trend reversal.
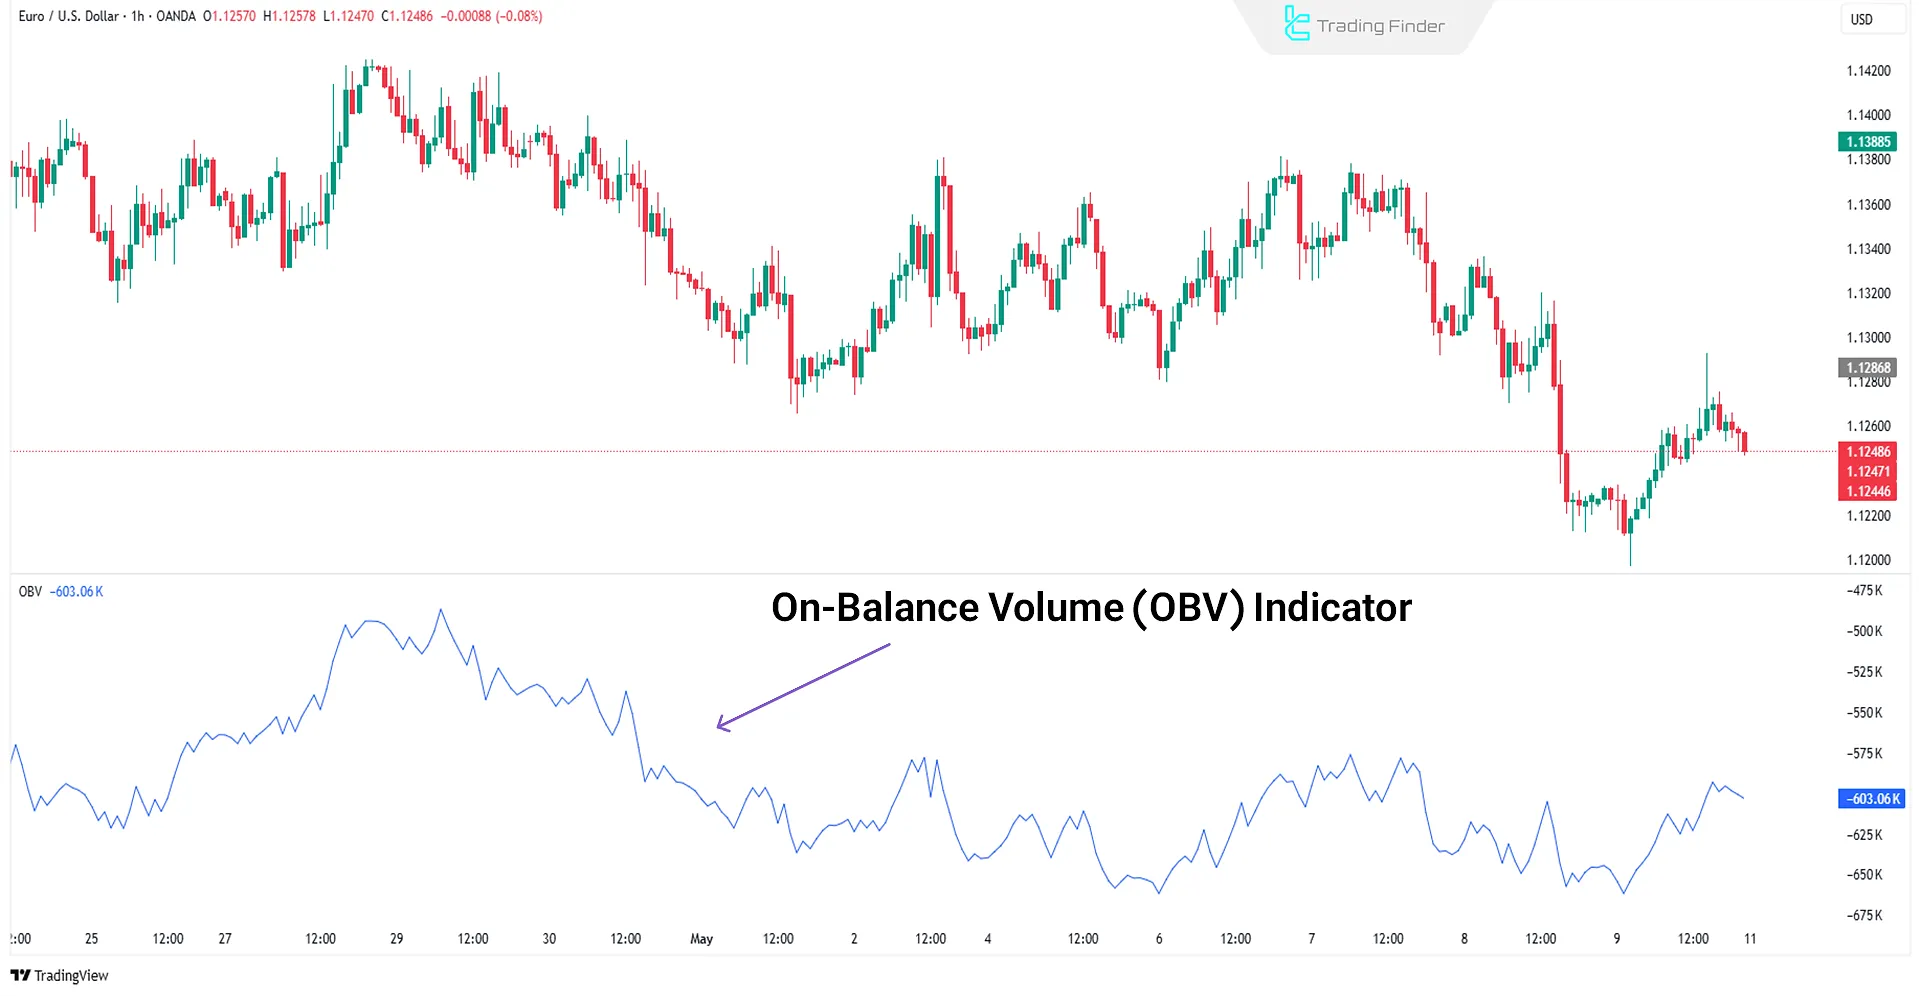
On-Balance Volume (OBV) Indicator
The OBV indicator records cumulative volume changes in the same direction as price. If volume is higher on up days, it signals money inflow; if volume increases on down days, it may indicate capital outflow.
Unlike raw volume indicators, OBV focuses on smart money flow and aims to identify the main direction of capital movement in the market:
- Volume-Price Divergence Detection: If price rises while OBV falls, the trend is weak; conversely, rising OBV in a downtrend increases the likelihood of a reversal;
- Trend or Breakout Confirmation: When both price and OBV rise together, the breakout is more reliable. Coordinated movement of OBV and price matters in strong trends;
- Tracking Smart Money: Earlier shifts in OBV compared to price can signal the activity of whales or institutions before a major trend change.
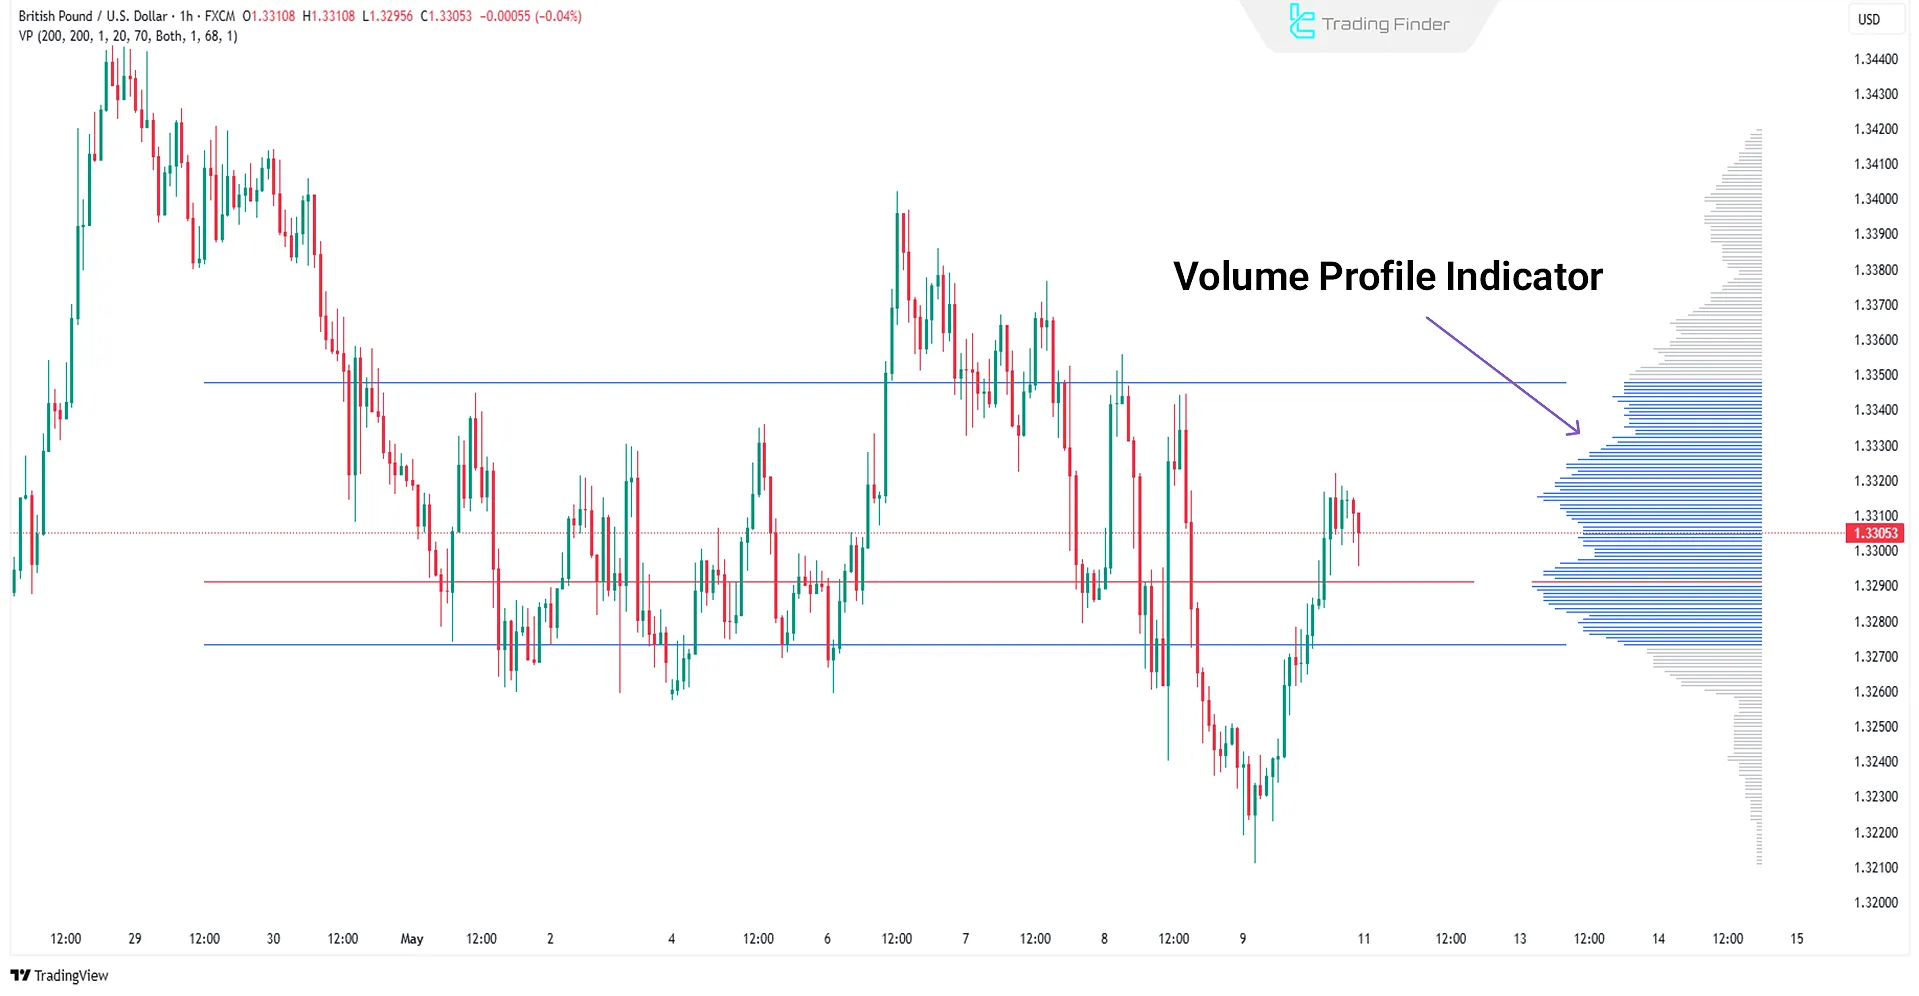
Volume Profile or Volume by Price Indicator
The Volume Profile displays trading volume at different price levels over time. It identifies high-activity zones where most buying and selling occurred, helping to pinpoint valuable and dense market areas:
- Hidden Support and Resistance Zones: Price levels with high trading volume often act as pause or reversal points;
- Market Structure Analysis: When combined with price action, Volume Profile helps define phases like accumulation, distribution, or breakout;
- Entry and Exit Validation: Entering near LVNs (Low Volume Nodes areas of fast price movement) and exiting around HVNs (High Volume Nodes areas of price consolidation) is a popular strategy;
- Session-Based Analysis: In markets like futures and crypto, Volume Profile is often used with daily or weekly session breakdowns.
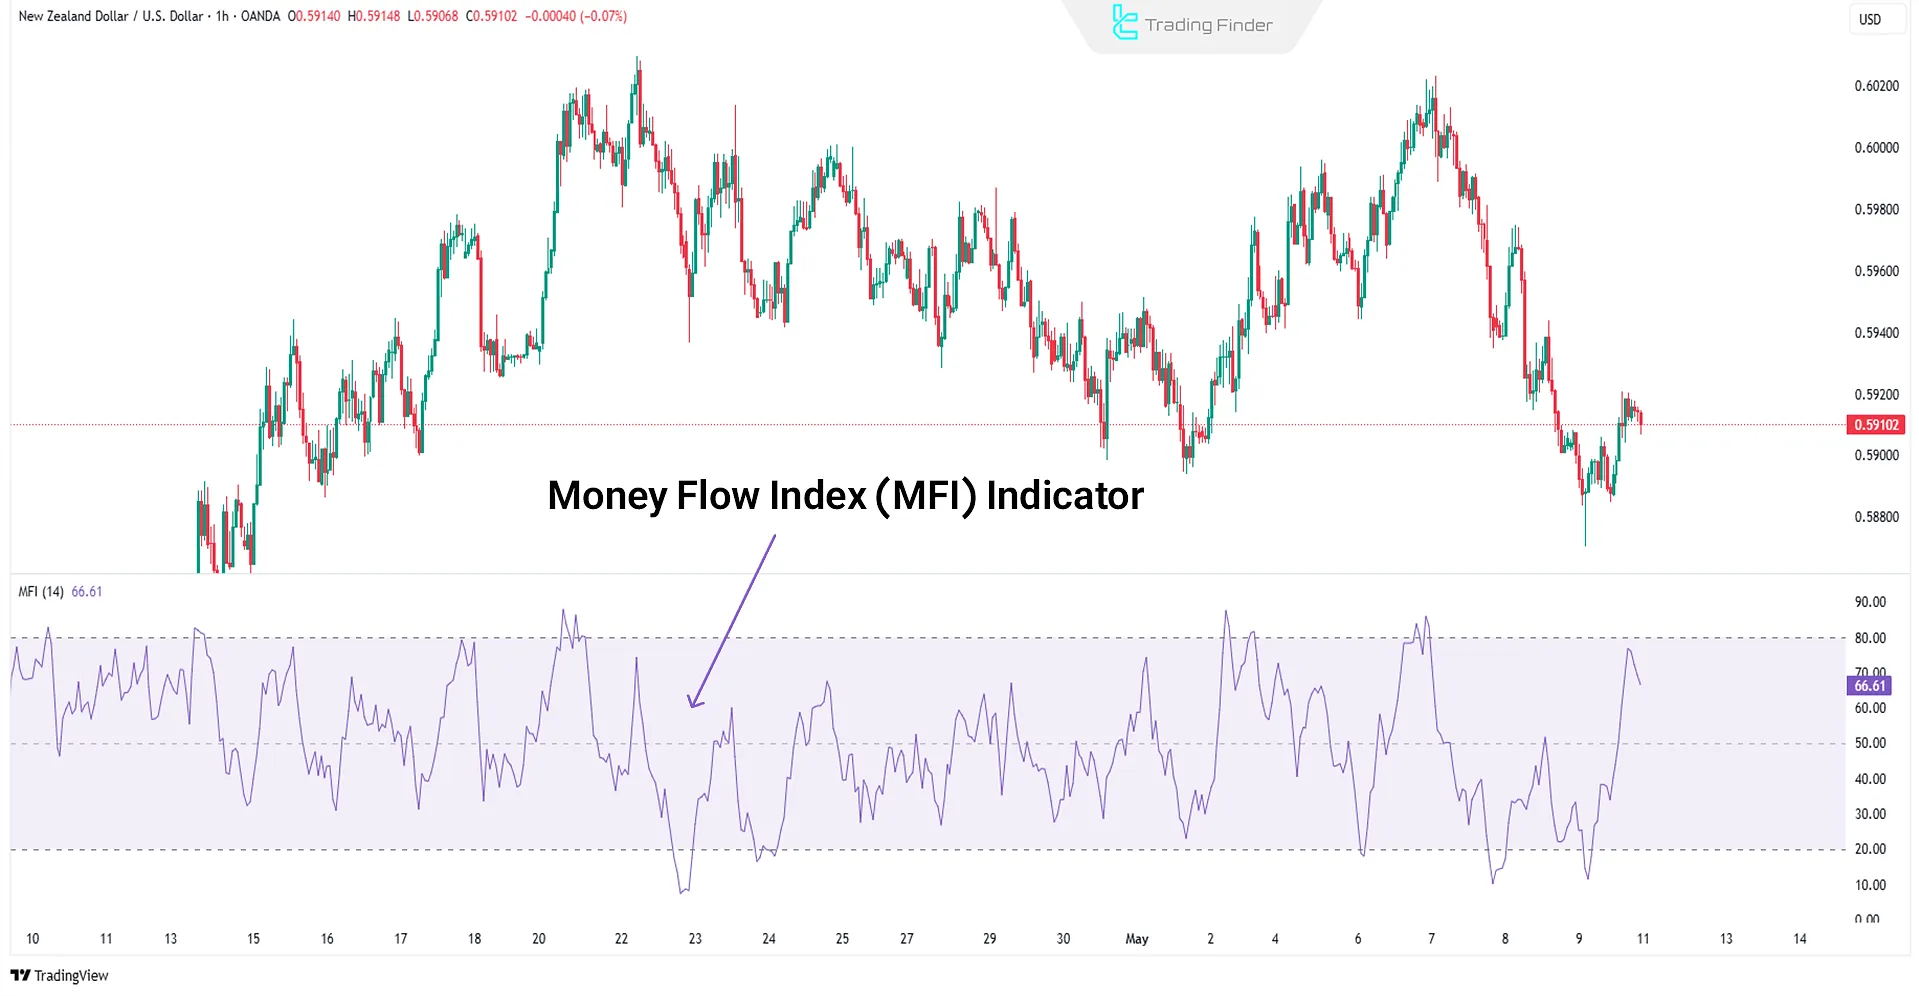
Money Flow Index (MFI) Indicator
The Money Flow Index (MFI) combines volume and price and oscillates between 0 and 100. This tool calculates the flow of liquidity while considering volume, which is why it's often referred to as the volume-weighted RSI:
- Identifying MFI Extremes: Above 80 signals overbought, and below 20 indicates oversold both levels suggest a potential reversal or price correction;
- Divergence Detection: If price reaches a new high but MFI does not confirm it, it's a negative divergence a bearish warning. Conversely, a positive divergence may suggest an upcoming bullish reversal;
- Liquidity Flow Analysis: Rising MFI along with bullish candles indicates smart money inflow; falling MFI with bearish candles, points to capital outflow;
- Filtering False Breakouts: If MFI remains below 50 during a resistance breakout, the risk of a false breakout increases.
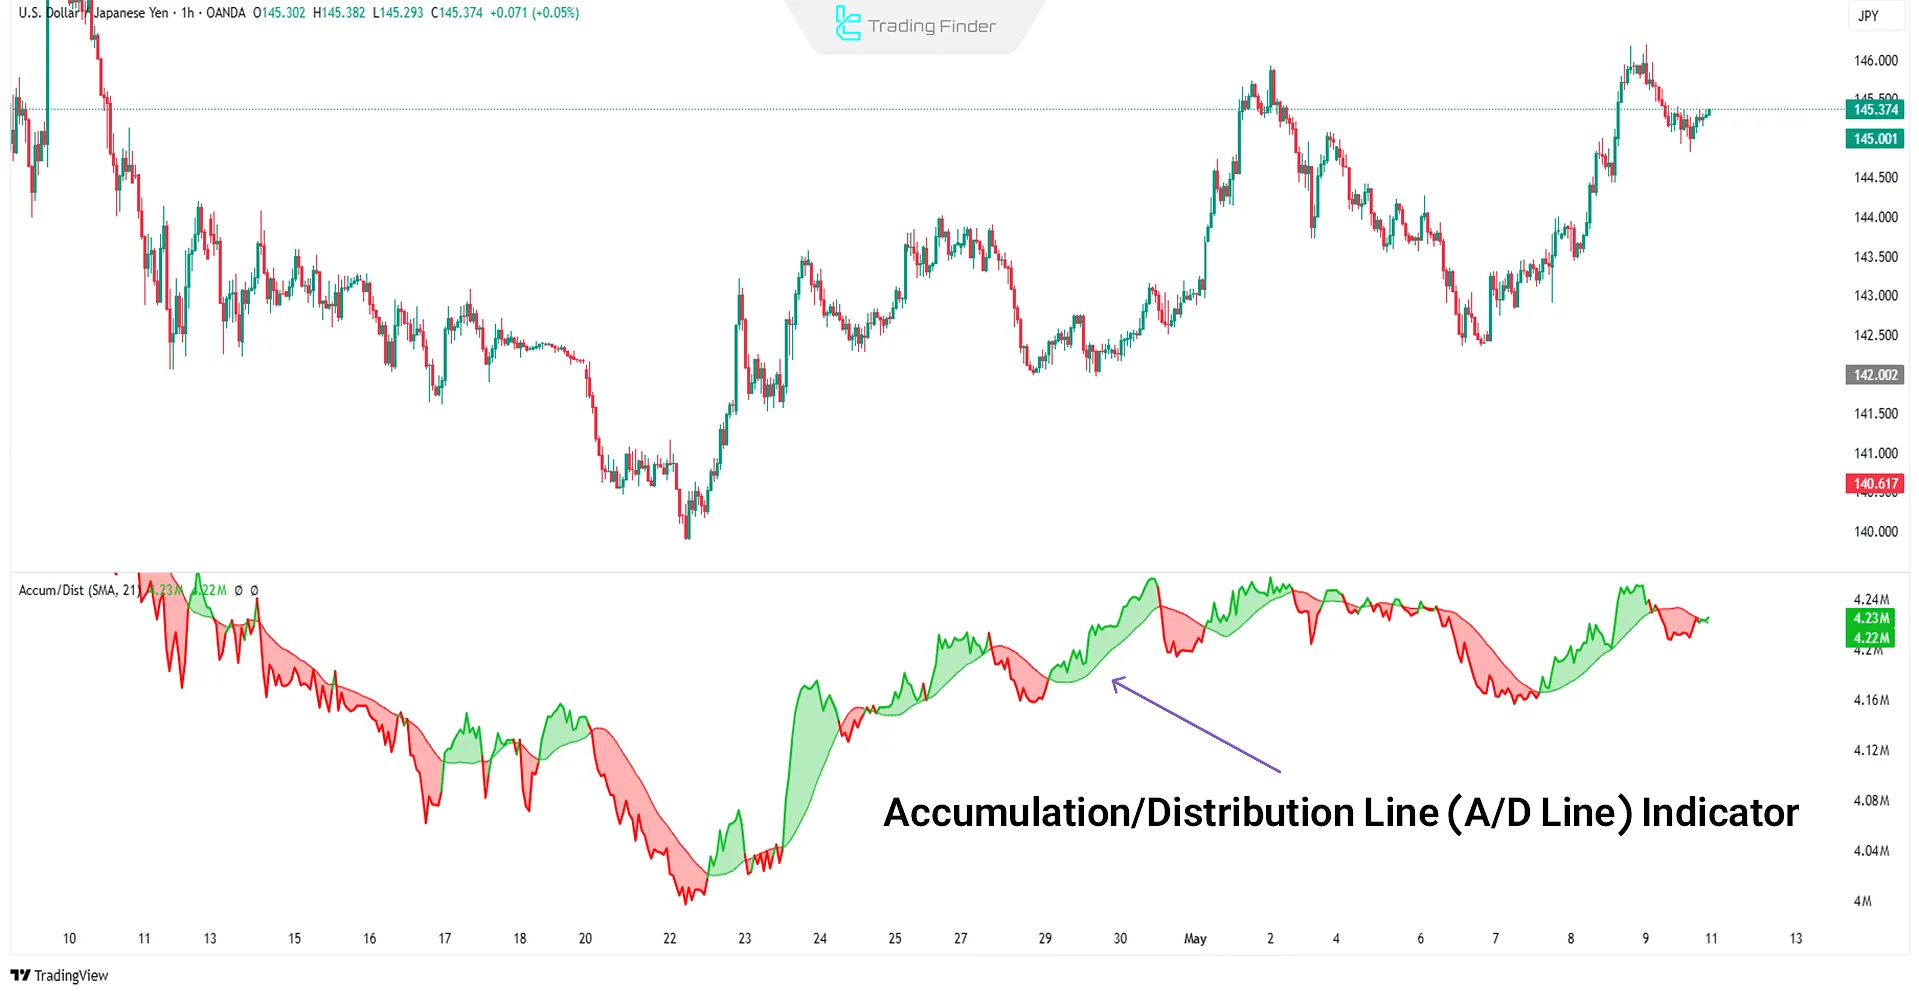
Accumulation/Distribution Line (A/D Line) Indicator
The A/D Line indicator is based on both volume and the closing position of price within the candle.
Unlike OBV, it weights volume by the candle's close location, offering a more nuanced view of liquidity movement:
- Market Phase Identification: Rising A/D with slow price movement indicates gradual accumulation. Falling A/D at tops suggests distribution and capital outflow;
- Divergence with Price: If price increases but A/D falls, the trend is weakening Conversely, when price drops and A/D rises, a bullish reversal may be forming;
- Breakout Confirmation: A/D moving in the same direction as price duringkey level breakouts increases the credibility of the trend or breakout.
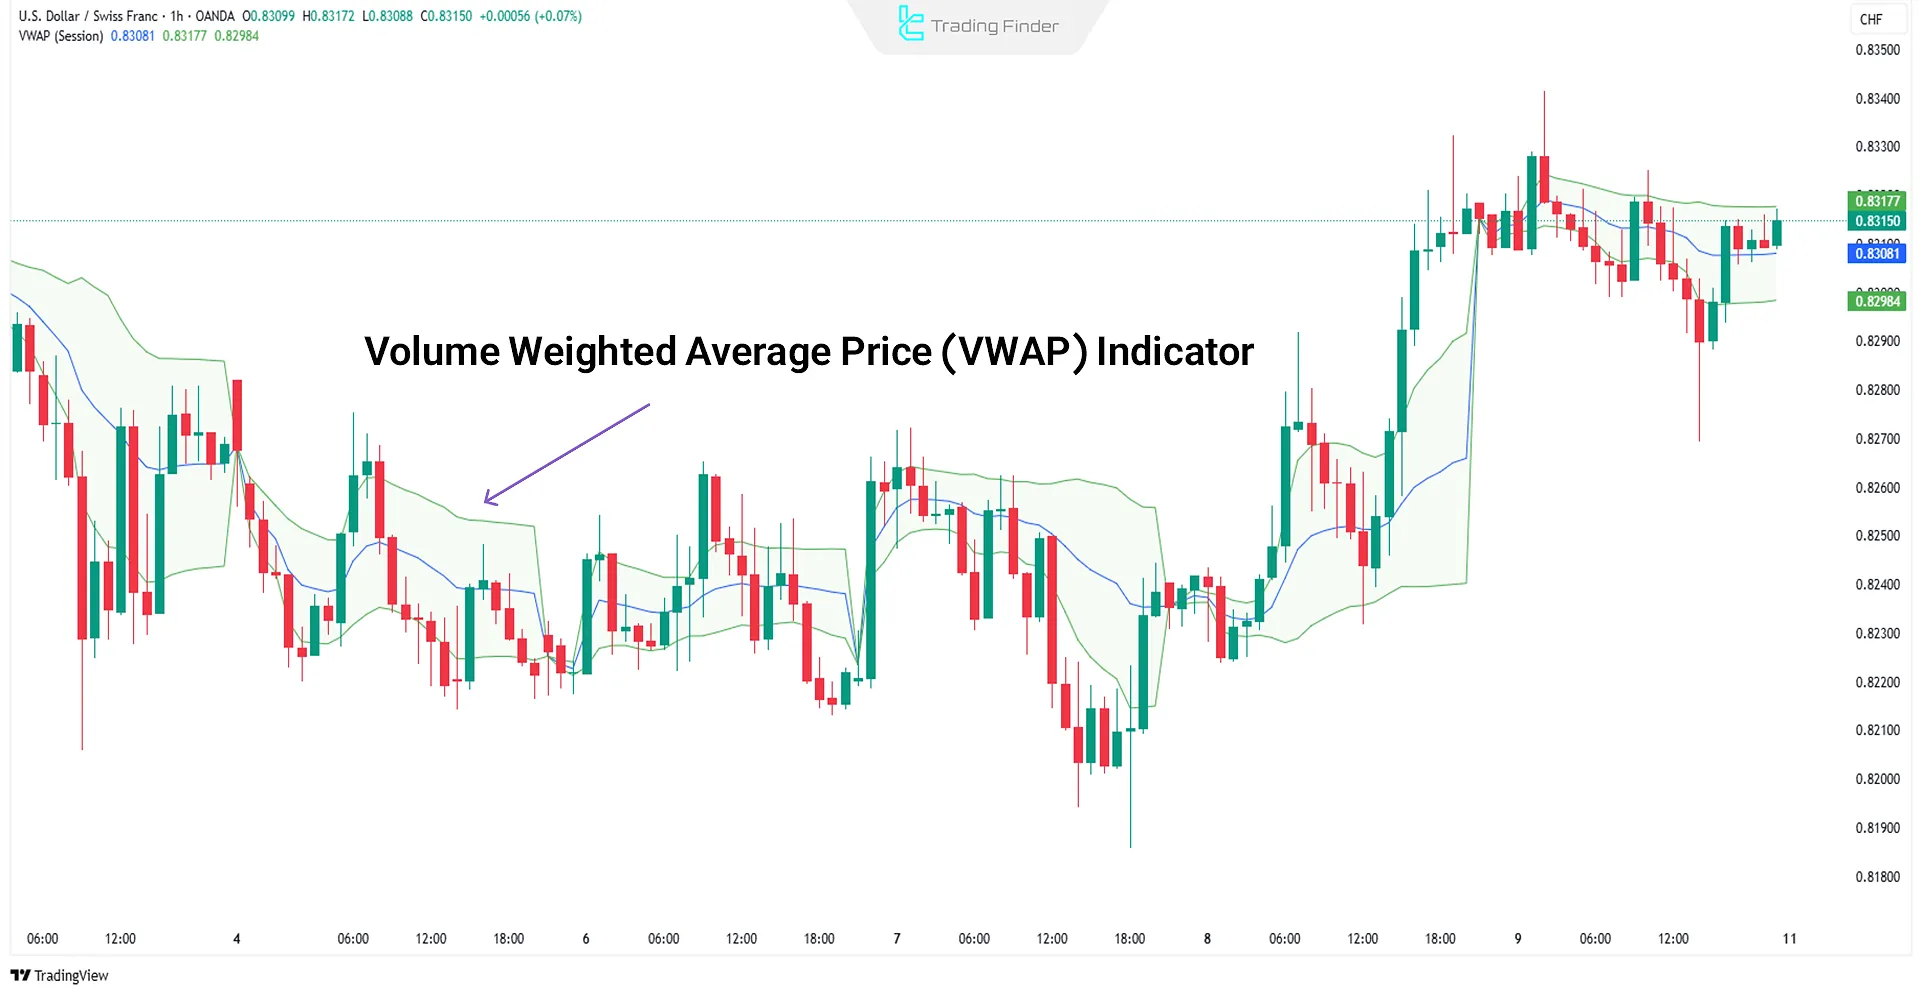
VWAP – Volume Weighted Average Price Indicator
The VWAP indicator shows the average price at which trades occurred over a specific time period typically one day.
Unlike traditional moving averages such as SMA or EMA, which consider only price, VWAP gives more weight to prices with higher trading volume.
As a result, this tool provides a more accurate representation of the market's effective price:
- Fair Value Determination: If price is above VWAP, the asset is considered overpriced; if below, it's considered underpriced;
- Daily Entry and Exit Signals: Buying below VWAP and selling above is a common rule among day traders and algorithmic strategies;
- Trend or Reversal Confirmation: If price stays above VWAP, it signals a sustained uptrend; crossing below VWAP may indicate a potential phase shift;
- Dynamic Support and Resistance: VWAP serves as a moving support or resistance level throughout the day, with short-term fluctuations often revolving around it.
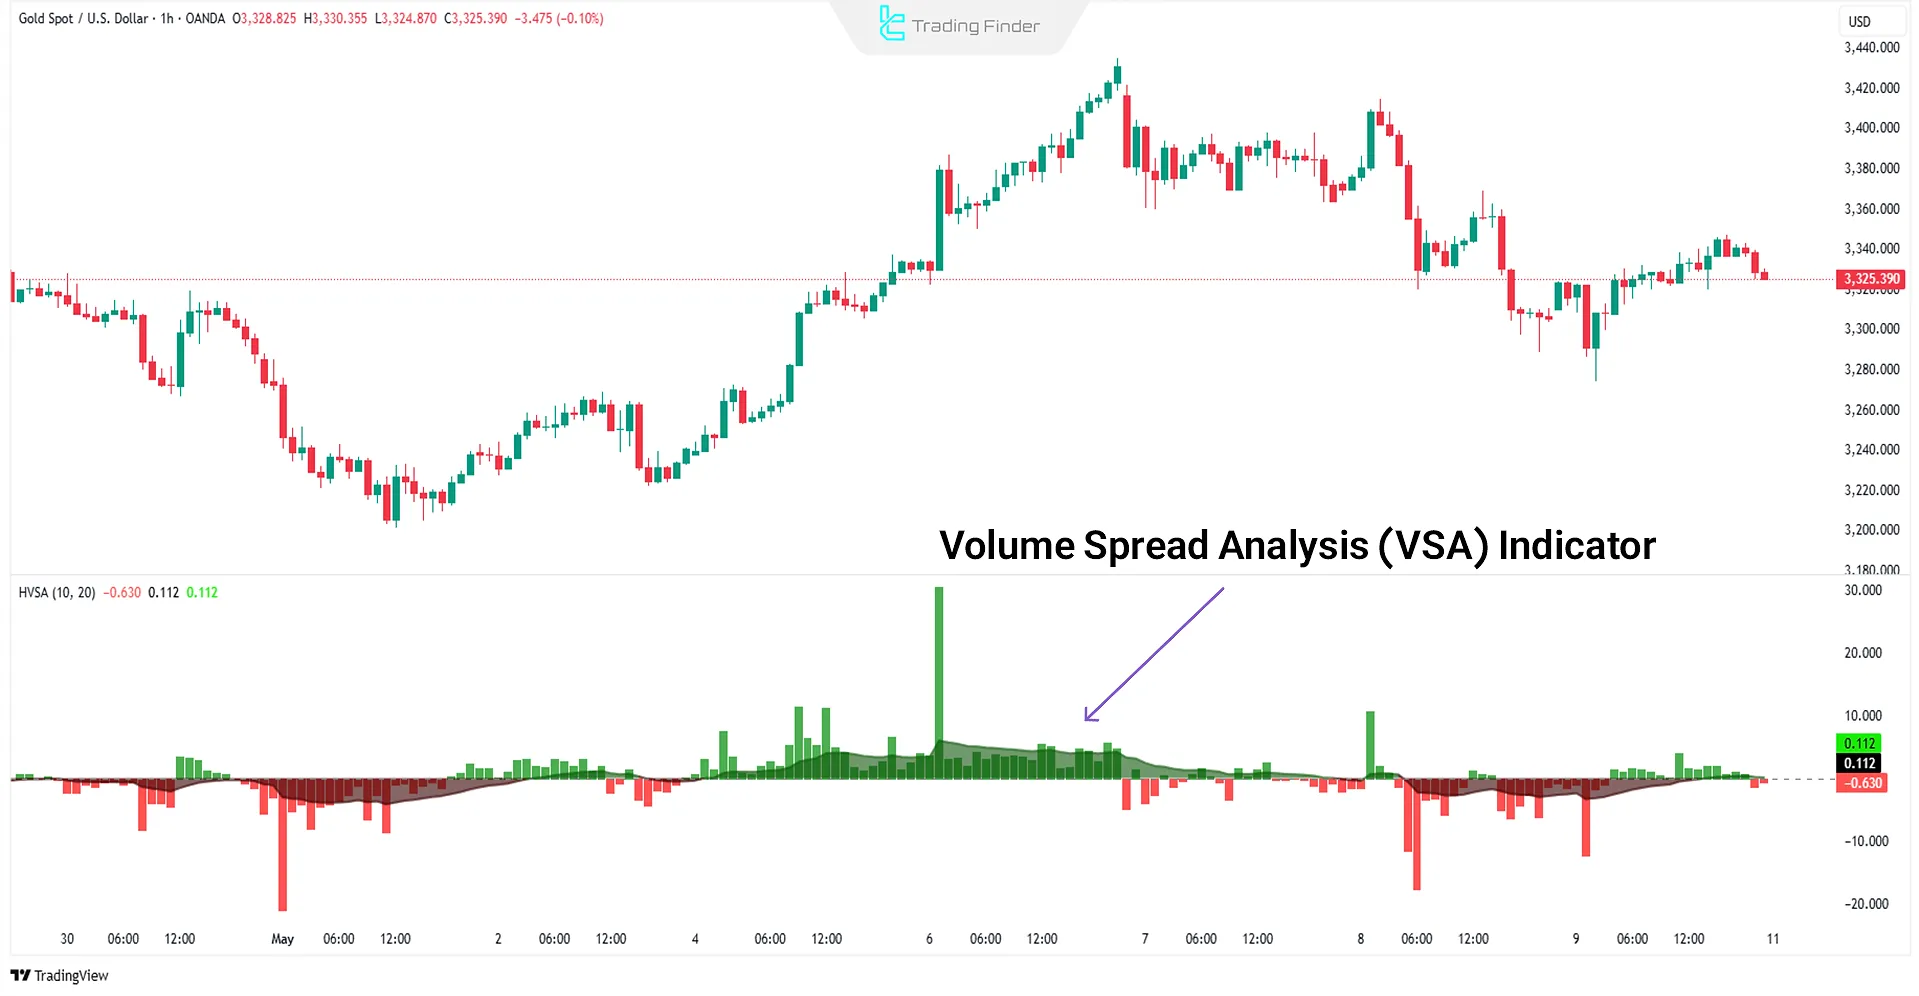
VSA – Volume Spread Analysis Indicator
VSA (Volume Spread Analysis) is a professional analytical framework designed to assess the behavior of smart money.
It evaluates the interaction of three key elements including volume, candlestick spread (range), and closing position of the candle.
Unlike standard numerical indicators, VSA focuses on market structure interpretation and the intentions of major players, allowing traders to read the market directly from volume and price behavior.
- Hidden Accumulation: High volume, narrow spread, and mid-candle close indicate the entry of large players;
- Liquidity Distribution: Wide, high-volume candles at tops suggest gradual whale exit;
- Buyer Traps: Breakout of resistance with a high-volume candle closing low is a market manipulation warning;
- Seller Traps: Fakeouts at support with high volume may signal liquidity collection by smart money;
- Market Structure Recognition: VSA aligns closely with the Wyckoff model for identifying phases of accumulation, distribution, breakout, and retest.
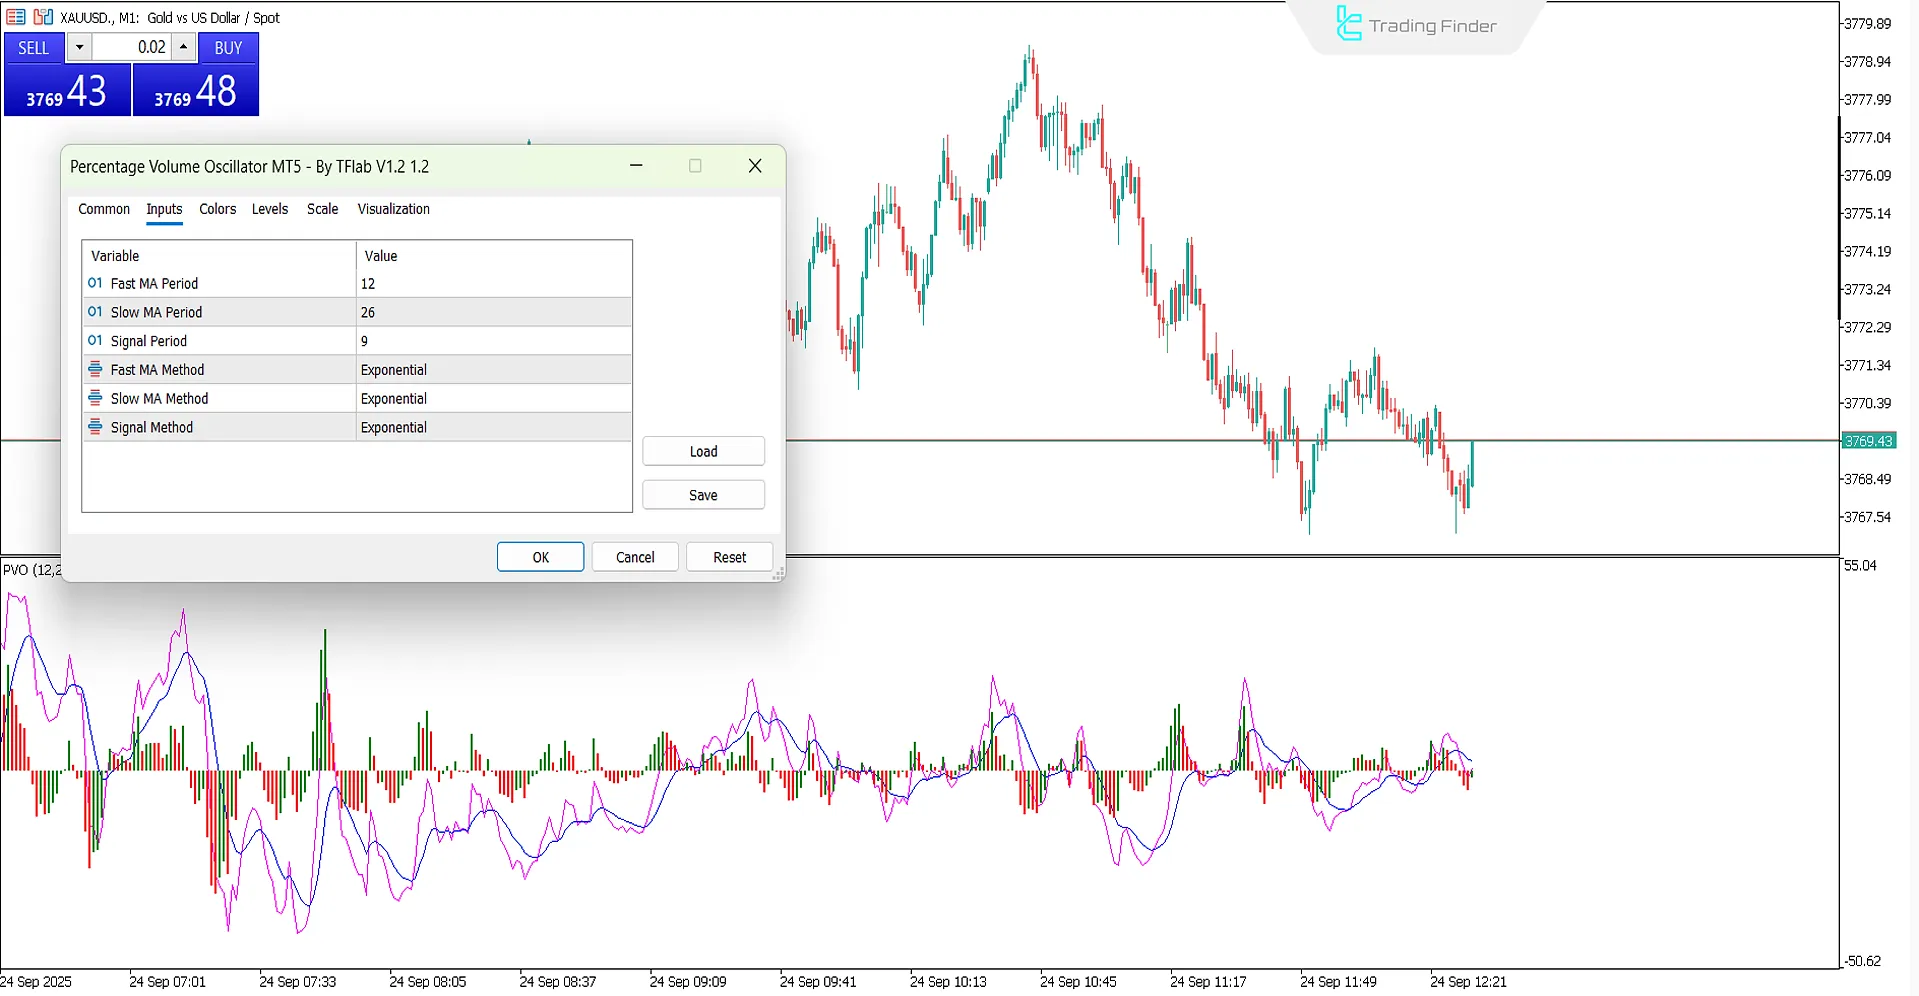
Percentage Volume Oscillator for MetaTrader
The Percentage Volume indicator is considered one of the advanced tools within the MetaTrader platform, designed to accurately examine relative changes in Trading Volume.
This indicator functions as a Volatile Oscillator and uses two moving averages, displaying their difference in the form of a histogram.
The outcome of this process is a clear picture of the strength of buying and selling flows, enabling traders to identify Entry and Exit points.
- Download Percentage Volume Oscillator for MetaTrader5
- Download Percentage Volume Oscillator for MetaTrader4
In this indicator, green histograms signal an increase in volume and strengthening of the bullish trend, while red bars indicate selling pressure dominance and the potential start of a bearish move.
Thanks to this feature, traders across various markets including forex, cryptocurrencies, stocks, commodities, and indices use it to analyze future price movements.
A practical example of applying this indicator can be seen on hourly charts.
When the blue moving average crosses above the orange signal line and oscillates in the positive zone above zero, along with the appearance of green bars, it generates a strong buy signal.
Conversely, on the 15-minute timeframe, when the moving average crosses below the signal line and moves into the negative area, accompanied by red histograms, it signals the start of a downtrend and provides an opportunity for sell trades.
The settings section of this indicator offers high flexibility, allowing users to adjust parameters such as Fast MA Period (12), Slow MA Period (26), and Signal Period (9).
This capability lets traders adapt their personal strategies across different timeframes and trading styles, whether intraday or multi-timeframe.
The Percentage Volume indicator is not only a powerful tool for analyzing volume fluctuations but, due to its Reversal Indicator nature, also provides deeper insight into supply and demand pressure.
This feature elevates its position in MetaTrader to a key level, making it one of the primary tools for precise decision-making in professional trading.
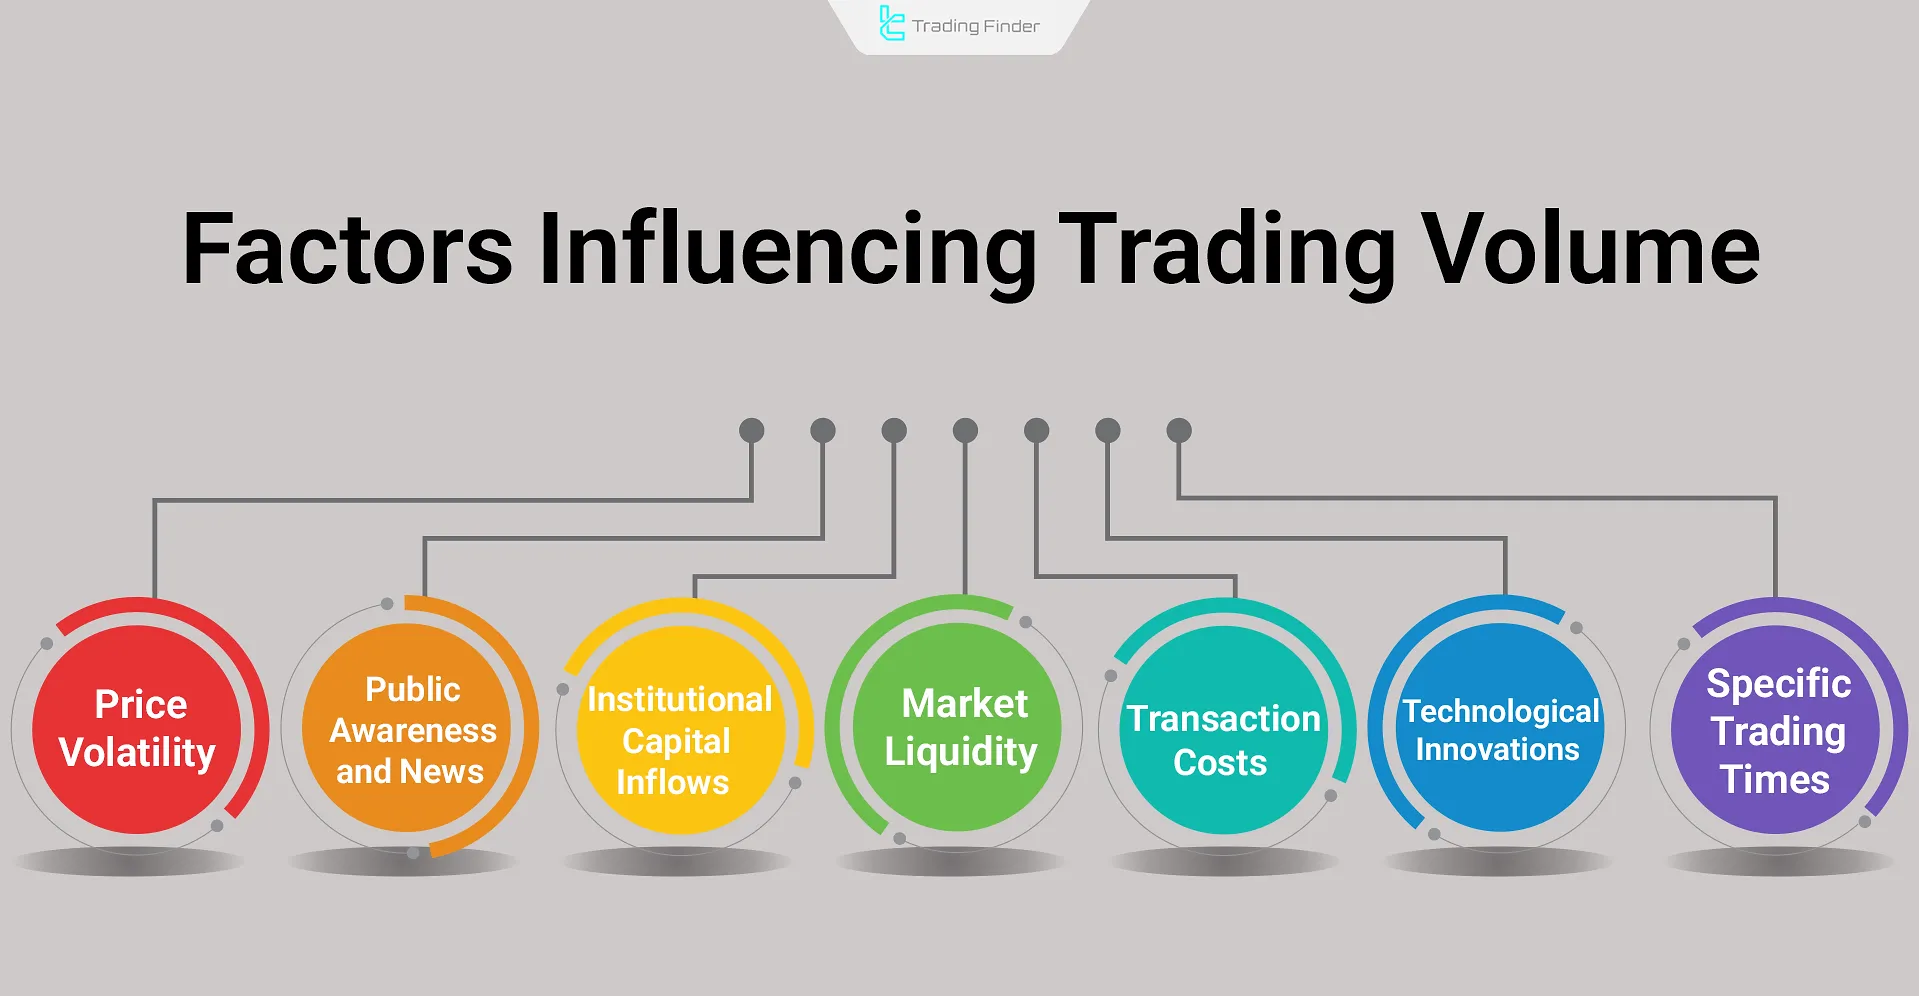
Factors Influencing Trading Volume
Trading Volume is not just a simple number; it is a direct reflection of environmental and behavioral market conditions. The most important influencing factors include:
- Price volatility: Rapid increases or decreases in rates attract traders and significantly raise volume;
- Public awareness and news: The release of positive or negative news, such as Bitcoin adoption by a major company, creates waves of trading;
- Institutional capital inflows: The presence of funds and financial institutions multiplies the overall market volume;
- Market liquidity: The more liquid an asset is, the higher its Trading Volume will be;
- Transaction costs: High fees may discourage retail traders from trading consistently;
- Technological innovations: The introduction of tools such as smart contracts or ETFs boosts volume growth potential;
- Specific trading times: Market open and close, or overlap with international markets, cause notable changes in volume.
Common Mistakes in Interpreting Market Volume
Analyzing trading volume in financial markets requires high accuracy and a deep understanding of price behavior, market structure, and the intentions of major players.
Relying solely on volume figures without considering market context and price action is one of the most common errors among professional traders. Common mistakes in volume interpretation include:
- Misinterpreting High Volume: High volume is not always a confirmation of trend strength; sometimes, it indicatesdistribution at market tops;
- Ignoring Market Context: Volume must be interpreted within the framework of trends, key levels, and price behavior;
- Overlooking Volume Type: In Forex market, Tick Volume only reflects price changes, not actual traded volume;
- Overreliance on Indicators: Using OBV or MFI alone is insufficient; combining them with price levels is essential;
- Applying Volume the Same Way in Different Market Conditions: Volume interpretation differs between range-bound and trending markets;
- Misreading High-Volume Candles: A large candle with high volume can represent exhaustion of buying or selling, or a reversal;
- Ignoring Relative Volume: Comparing current volume to historical averages (Relative Volume) is crucial for validating volume signals.
Conclusion
Trading volume in financial markets plays a significant role in technical analysis. Unlike price, which only reflects supply and demand interaction, volume reveals the real participation level behind price movements.
Tools such as OBV, VWAP, Volume Profile, MFI, and methods like VSA, analyze various types of volume to detect smart money inflows and outflows. Combining volume analysis with market structure, price action, and risk management enhances analytical accuracy.


