


TradingView is an advanced trading platform for charting and market analysis, used daily by over 50 million users worldwide. The platform was launched in 2011 by Stan Bokov, Denis Globa, and Konstantin Ivanov.
In TradingView, users by default have access to over 100 technical indicators, drawing tools, and customizable charts. In addition, with its coverage of global market data, the platform provides real-time information to traders.
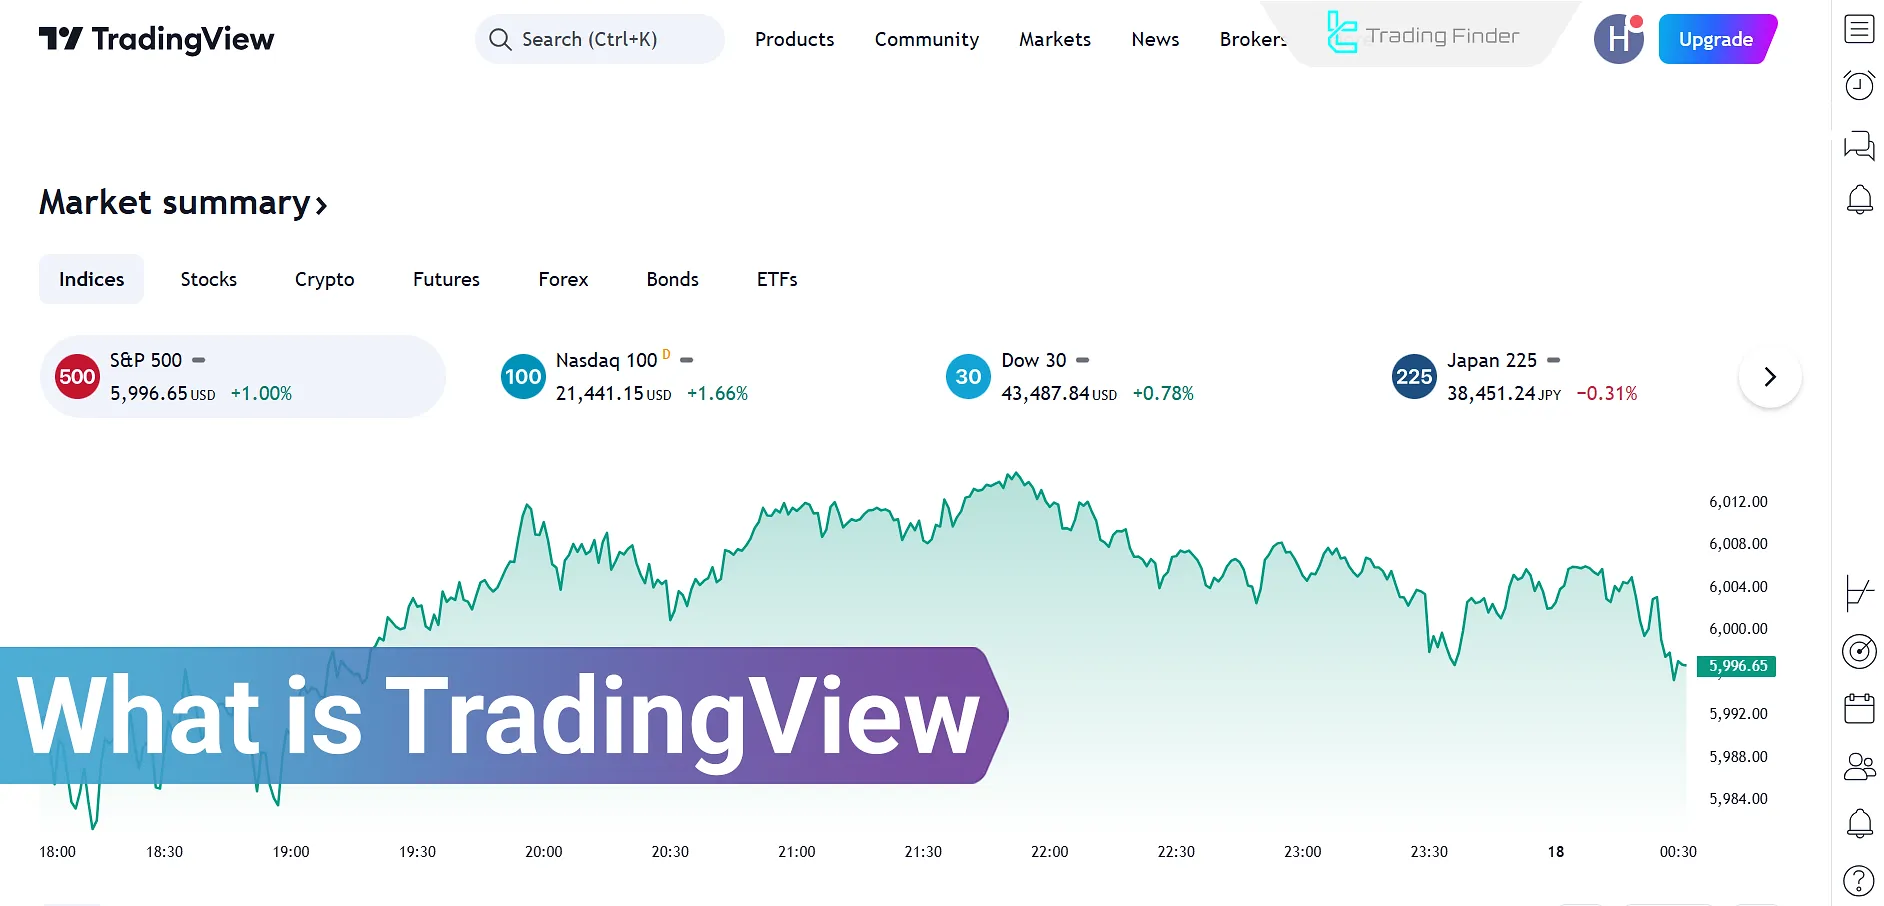
What is TradingView?
TradingView is an online platform for analyzing financial markets that offers advanced charts, an asset screener, real-time news, and the ability to build indicators with Pine Script.
Due to its simple user interface and active community, this tool is highly practical among forex, stock, and crypto traders. Tutorial video on how to use TradingView from Craig Percoco’s YouTube channel:
Login and sign up on TradingView
Signing up on TradingView takes less than two minutes, but knowing the key points for the user and using its features is essential.
Following these tips will make your user experience smoother and your use of the tools more practical.
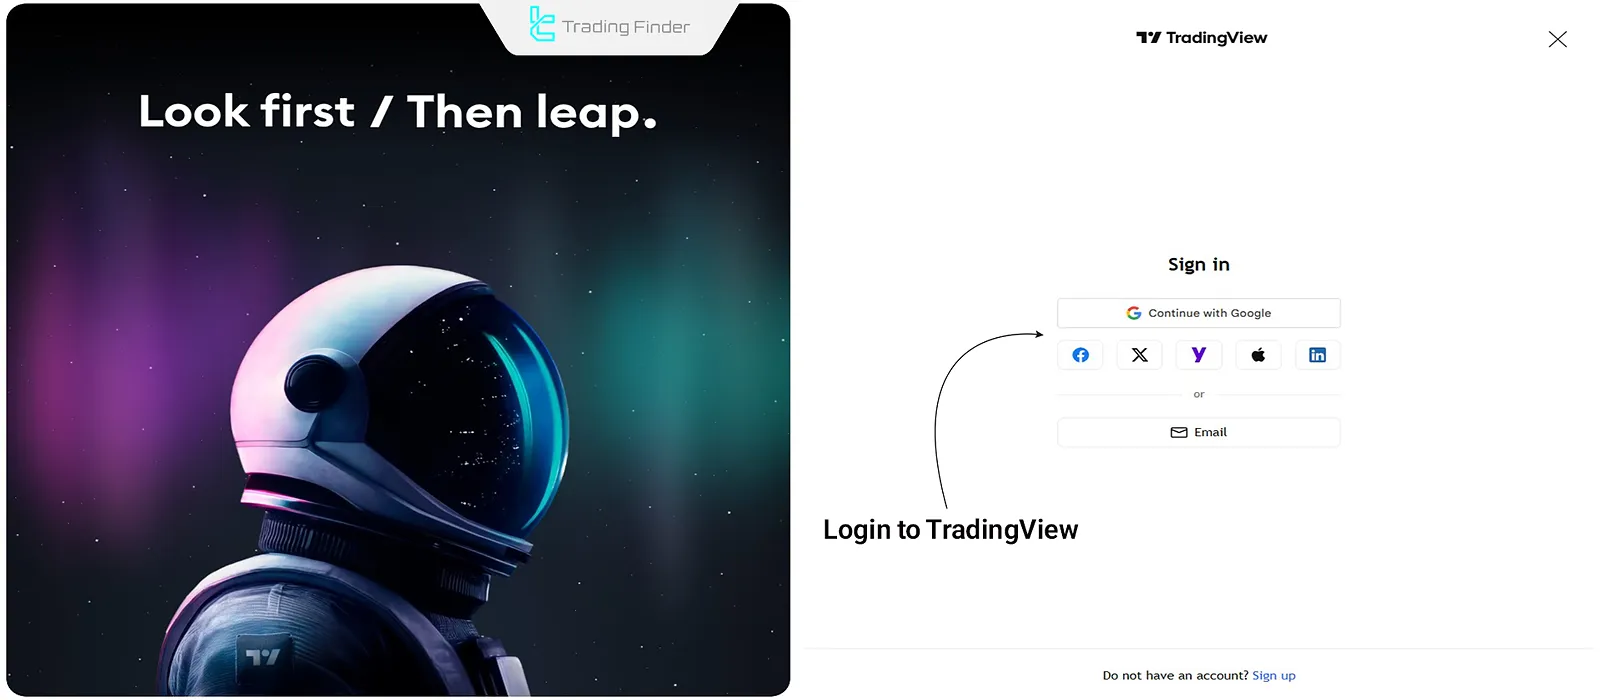
#1 Create an account
Go to the official TradingView website and click on “Sign up”. You can register with email or through your Google, Facebook, Apple, or even X (Twitter) account.
If you plan to use it long-term, it’s better to enter your personal email so you always have stable access.
#2 Choose a plan
Immediately after creating an account, your TradingView account is activated by default on the free (Basic) plan. This plan has limitations such as the number of concurrent indicators (3) and the number of alerts (one).
If you trade professionally, it’s better to test the Pro or Pro+ plan right away; because TradingView also provides a 30-day free trial.
#3 Verify and log in
After signing up, a verification email will be sent to you. By clicking the verification link, your account will be activated and you can log in.
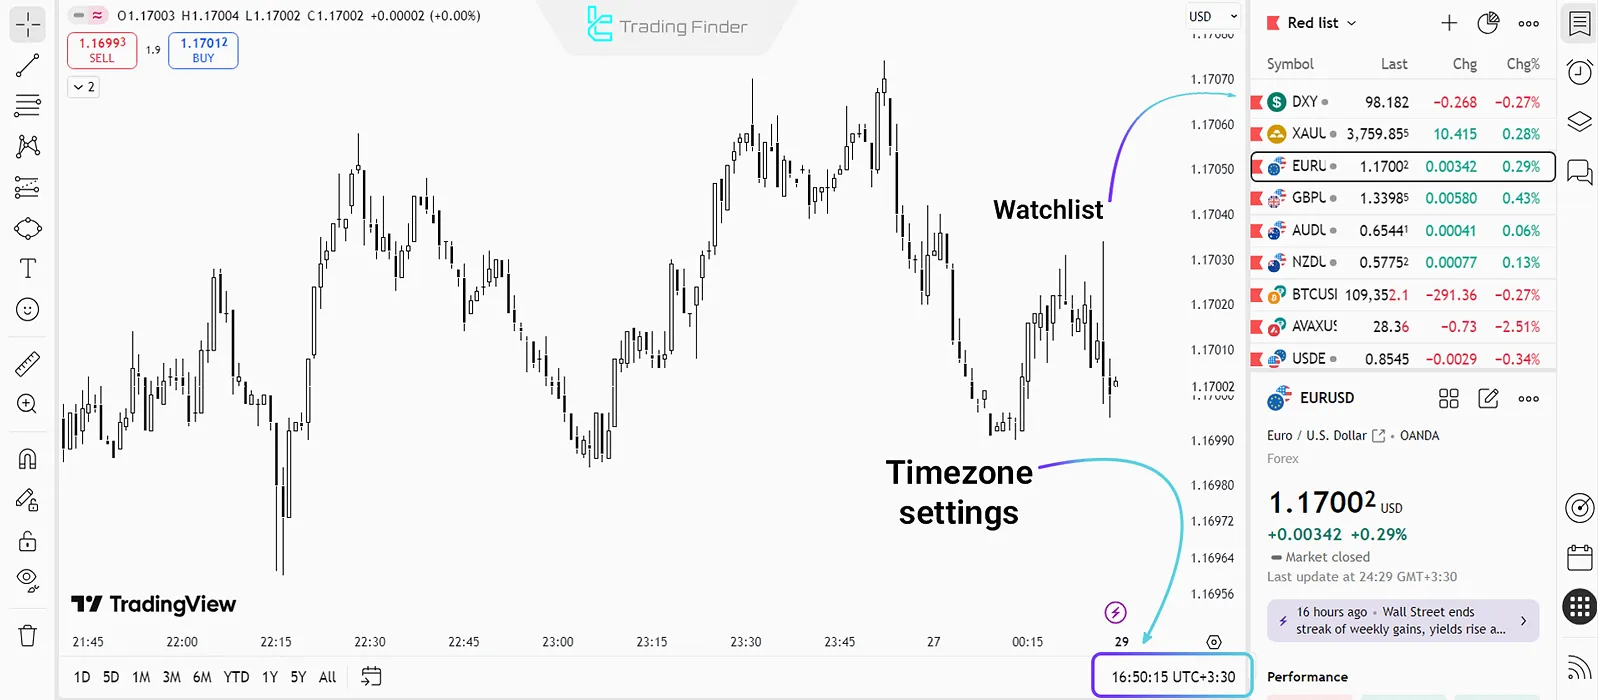
#4 Initial personalization
After logging in, it’s better to build your watchlist, set the language, and set the time zone to your target market’s time zone. This will ensure charts display exactly according to your needs.
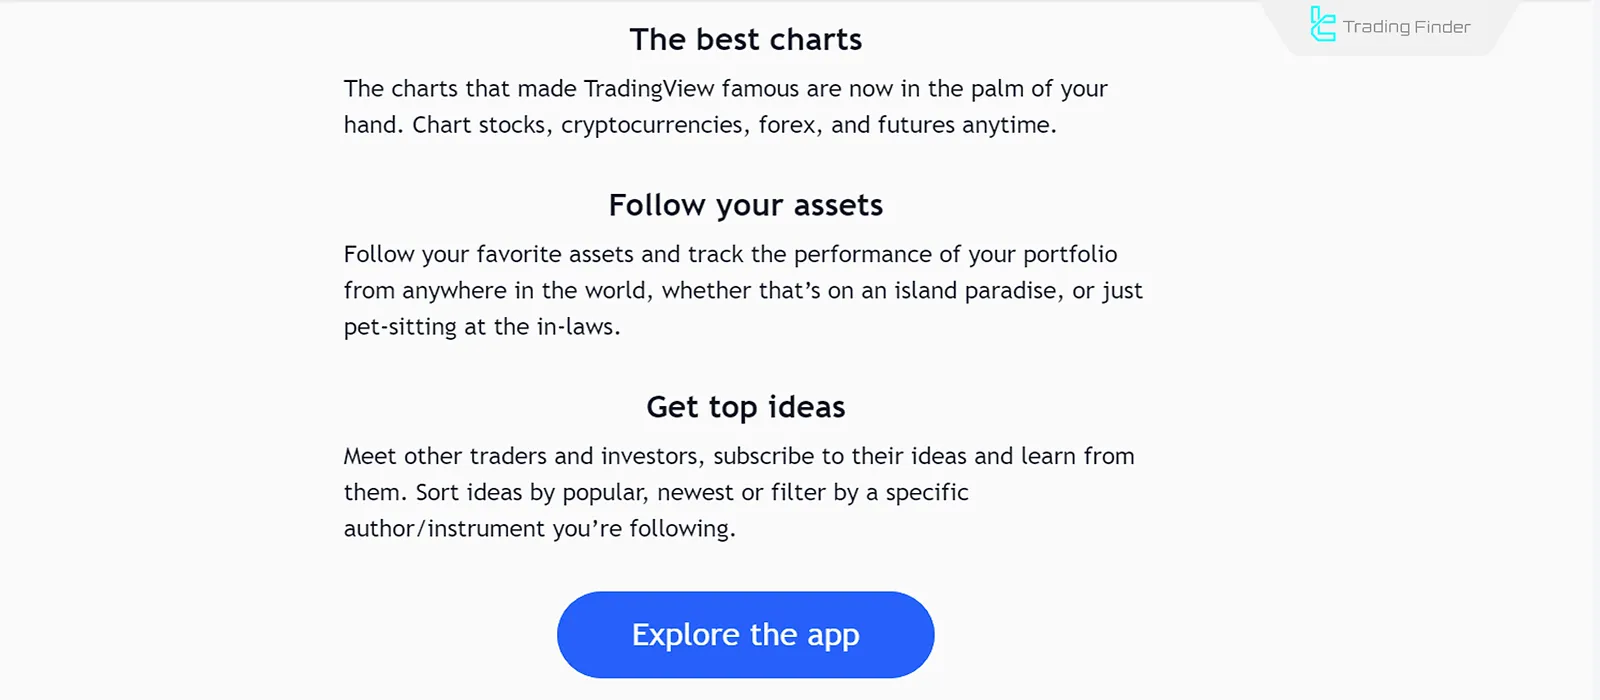
Download TradingView for mobile and desktop
TradingView is not just a website; the platform also offers dedicated versions for Windows, Mac, Android, and iOS so traders can access charts and analytical tools faster without a browser.
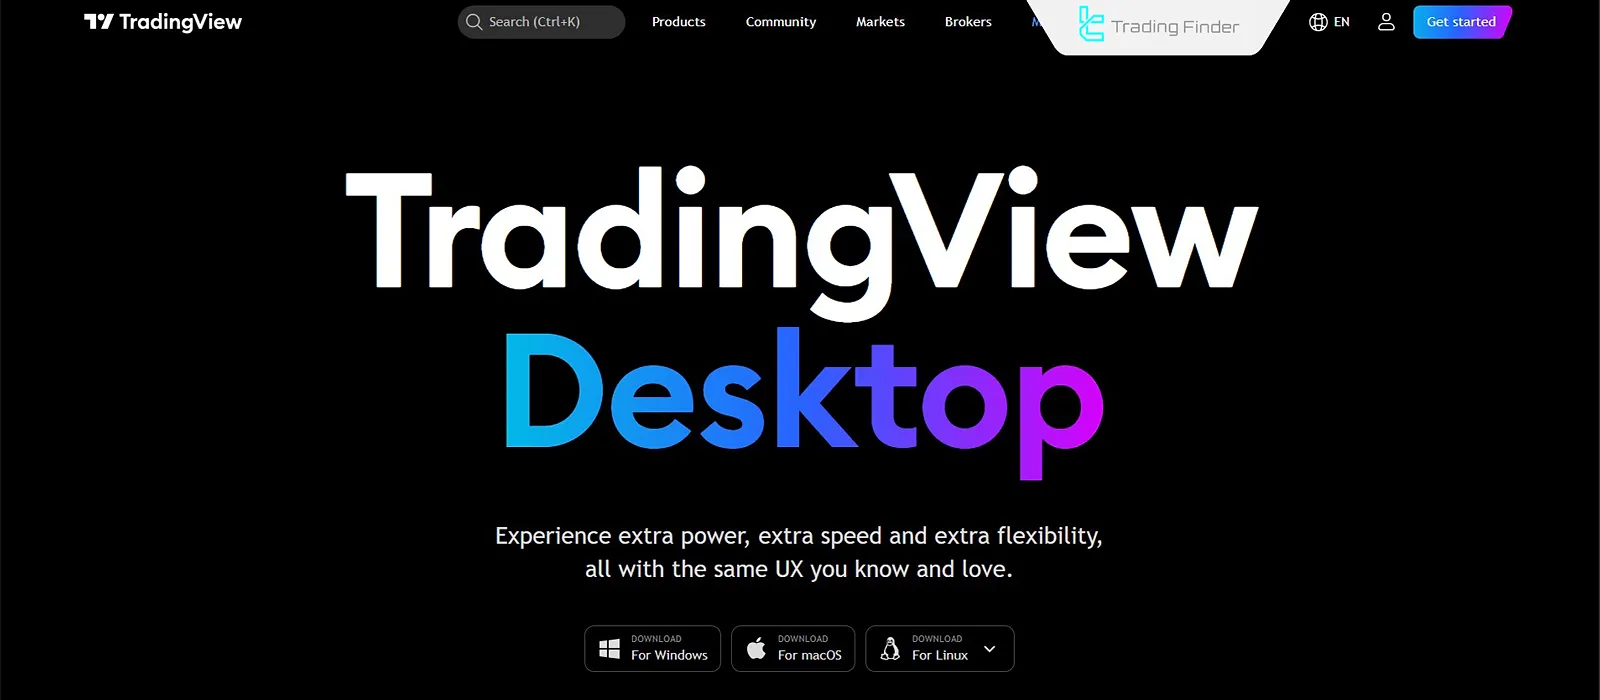
Desktop version (Windows and Mac)
By downloading the TradingView in desktop app from the official TradingView website, you can experience chart loading speeds up to twice as fast as the browser.
One of the advantages of the desktop version is better support for multiple monitors; meaning you can open several separate charts simultaneously on different displays.
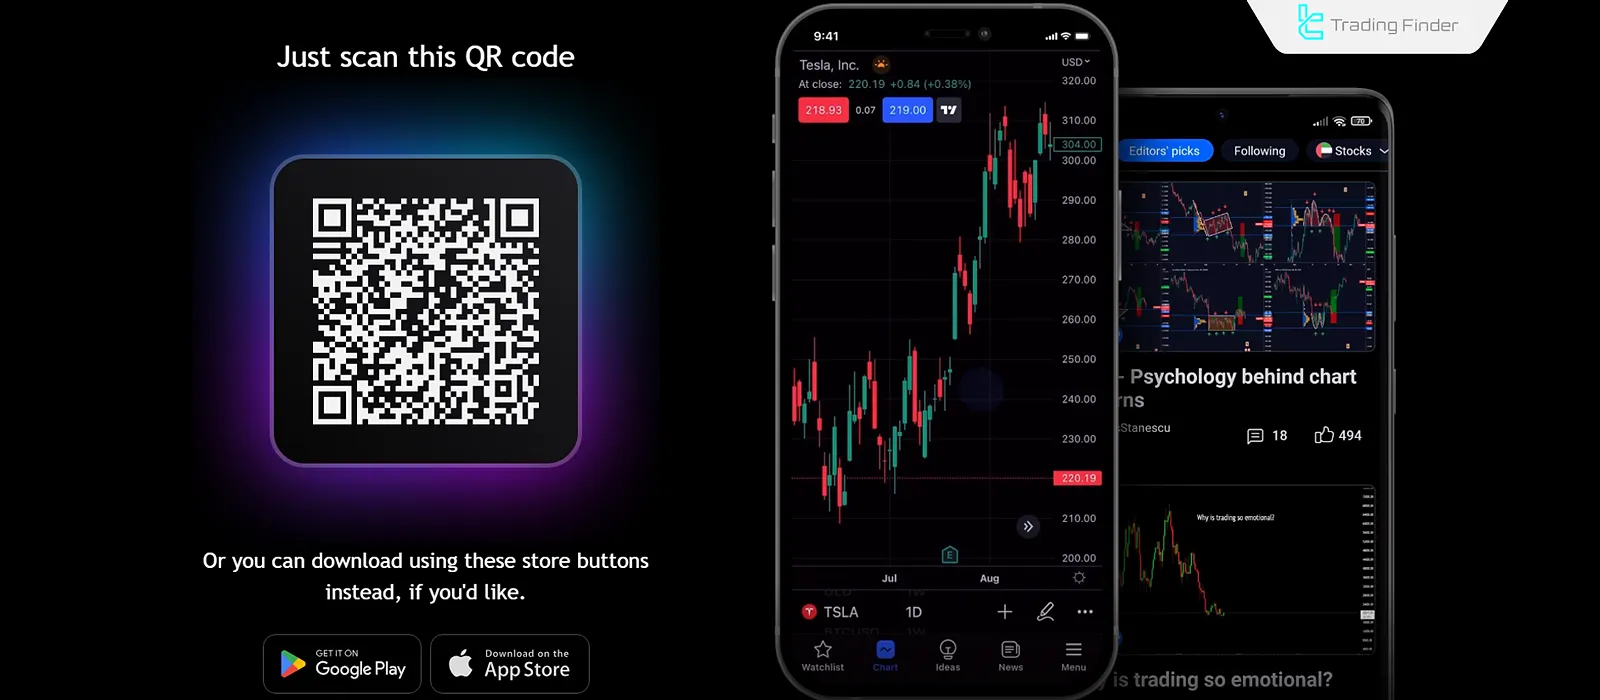
Mobile versions for Android and iOS
Downloading the TradingView app for mobile is available on Google Play and the App Store.
This version is especially designed for traders who need to monitor the market while traveling or away from home.
Core features like watchlists, alerts, and drawing tools are fully available on mobile.
Costs of using TradingView
TradingView has various subscription models, each designed for a different level of trader. Types of TradingView models:
Free model
This plan is suitable for getting started but has many limitations. You can only have 3 indicators on each chart, set only one active alert, and saved analyses are limited.
It’s sufficient for newcomers to the market or those who only want to review charts simply.
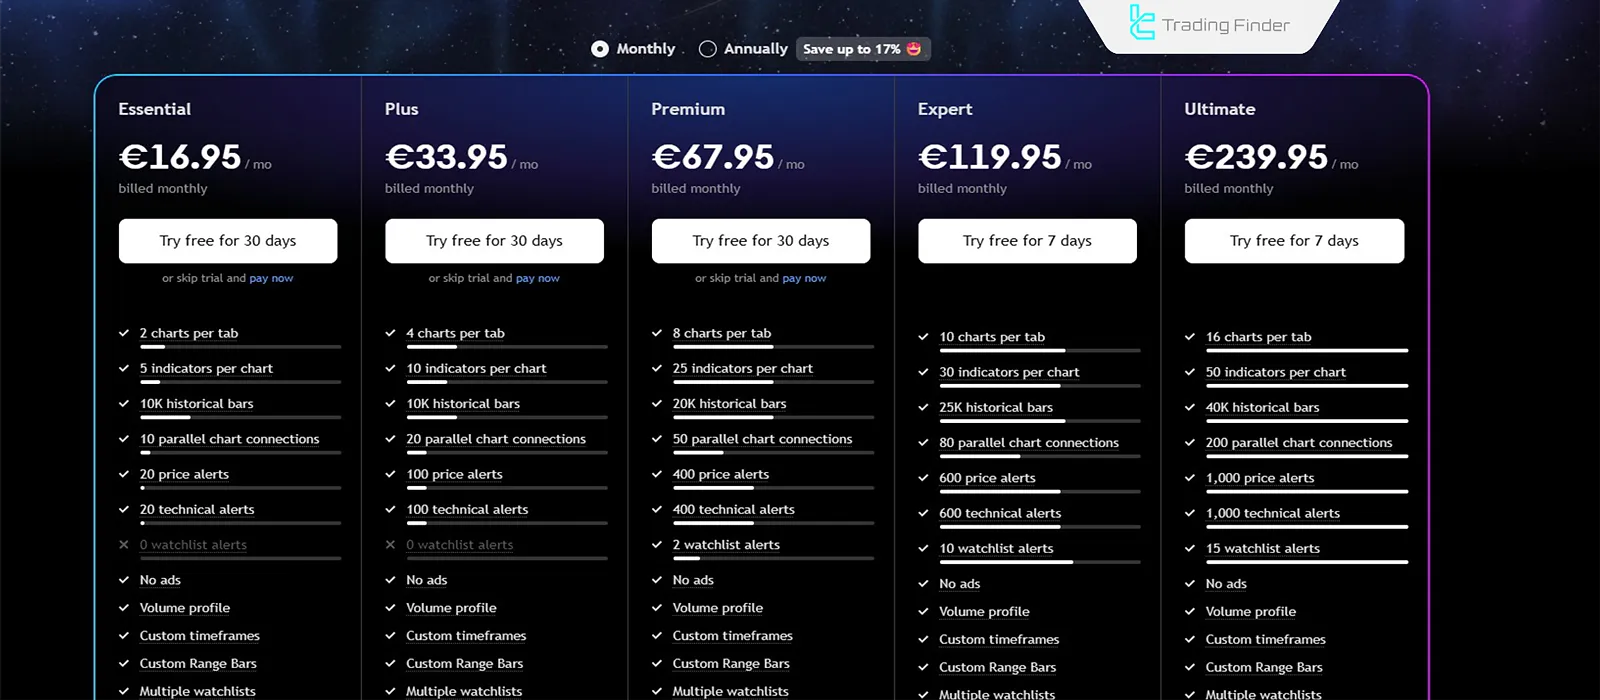
Essential model
The basic TradingView version with a monthly price of 16.95 dollars per month that provides the main analysis features.
In this plan you can have 2 charts per tab, activate up to 5 indicators on each chart, and access 10,000 historical bars.
There are also 20 price alerts and 20 technical alerts available. This version is suitable for beginners or those who need simple tools.
Plus model
This plan offers a higher level of features and is available at 33.95 dollars per month. You can open 4 charts per tab, use 10 indicators on each chart, and still have access to 10,000 historical bars.
In addition, 100 price and technical alerts can be set. This model is a suitable choice for semi-professional traders who need more tools.
Premium model
At this level, with a monthly subscription of 67.95 dollars, you will have broader access to features.
This access includes 8 charts per tab, 25 indicators on each chart, and 20,000 historical bars. You can also set up to 400 price and technical alerts and even 2 watchlist alerts.
This model is ideal for active traders and analysts who need more alerts and longer historical data.
Expert model
This version, at a monthly price of 119.95 dollars, is for professional traders. In this plan, it’s possible to have 10 charts per tab, 30 indicators on each chart, and access to 25,000 historical bars.
There is also the ability to set 600 price and technical alerts and 10 watchlist alerts. If you follow multiple strategies or markets simultaneously, this plan is a serious option.
Ultimate model
The most complete TradingView version with a monthly subscription of 239.95 dollars has the most features.
You can open 16 charts per tab, have up to 50 indicators and access 40,000 historical bars.
In addition, with 1,000 price and technical alerts along with 15 watchlist alerts, the alert limitations are almost eliminated.
This plan is designed for financial institutions, investment funds, or professional analysis teams.
Difference between TradingView and MetaTrader
Two popular tools in trading are TradingView and MetaTrader. Each has its own strengths and limitations, and the choice between them depends on the trader’s needs.
Comparison table of TradingView and MetaTrader:
Features | Trading View | Meta Trader |
Access type | Web-based + desktop and mobile apps | Desktop software + mobile app |
Charts and indicators | Very advanced charts, hundreds of built-in and custom indicators, Bar Replay | Basic indicators + custom indicators (MQL) |
Fundamental analysis | Company profiles, financial ratios, real-time economic news | Limited, mostly requires third-party tools or plugins |
Social features | Traders’ social network, idea sharing, chat and live stream | None |
Scripting | Pine Script (a simple, fast language for building indicators/strategies) | MQL4/MQL5 (a more complex but powerful language for robots and indicators) |
Trade execution | Directly only with certain partner brokers | Direct connection to most brokers, fast order execution |
Market coverage | Forex, crypto, stocks, commodities, futures | Mostly forex and CFDs (depending on the broker) |
Key Features of TradingView
TradingView has numerous features including watchlists, market filters, trading alerts, and more. Highlighted features and capabilities of TradingView:
- Technical indicators
- Advanced charts
- Drawing tools
- Mouse pointer tools
- Trading alerts
- Fundamental analysis
- Watchlist
- Price chart replay or Bar Replay
- Market screener
- News coverage
- Pine Script
- Trading ideas
- Live video streaming
- Chat with other users
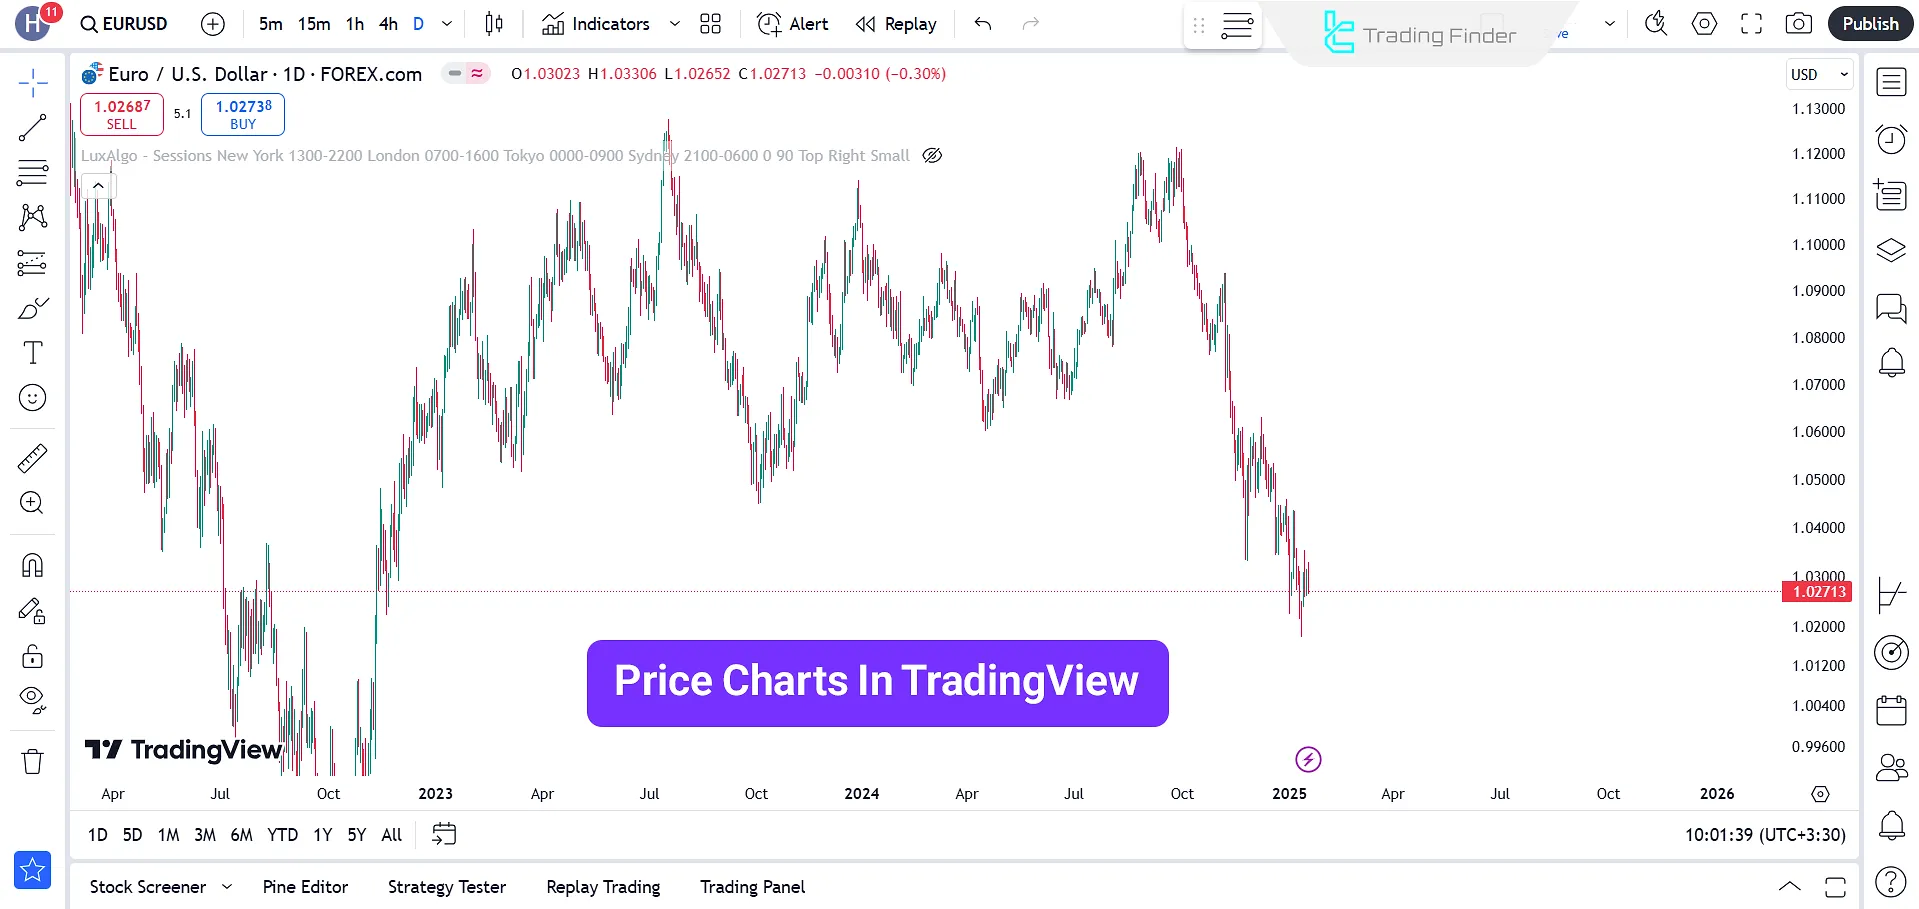
Advanced Charts
TradingView provides various chart types, including Candlestick, Heikin Ashi, Renko, Kagi, and more.
The platform allows access to multiple timeframes, different graphical themes, price action analysis, and pattern recognition.
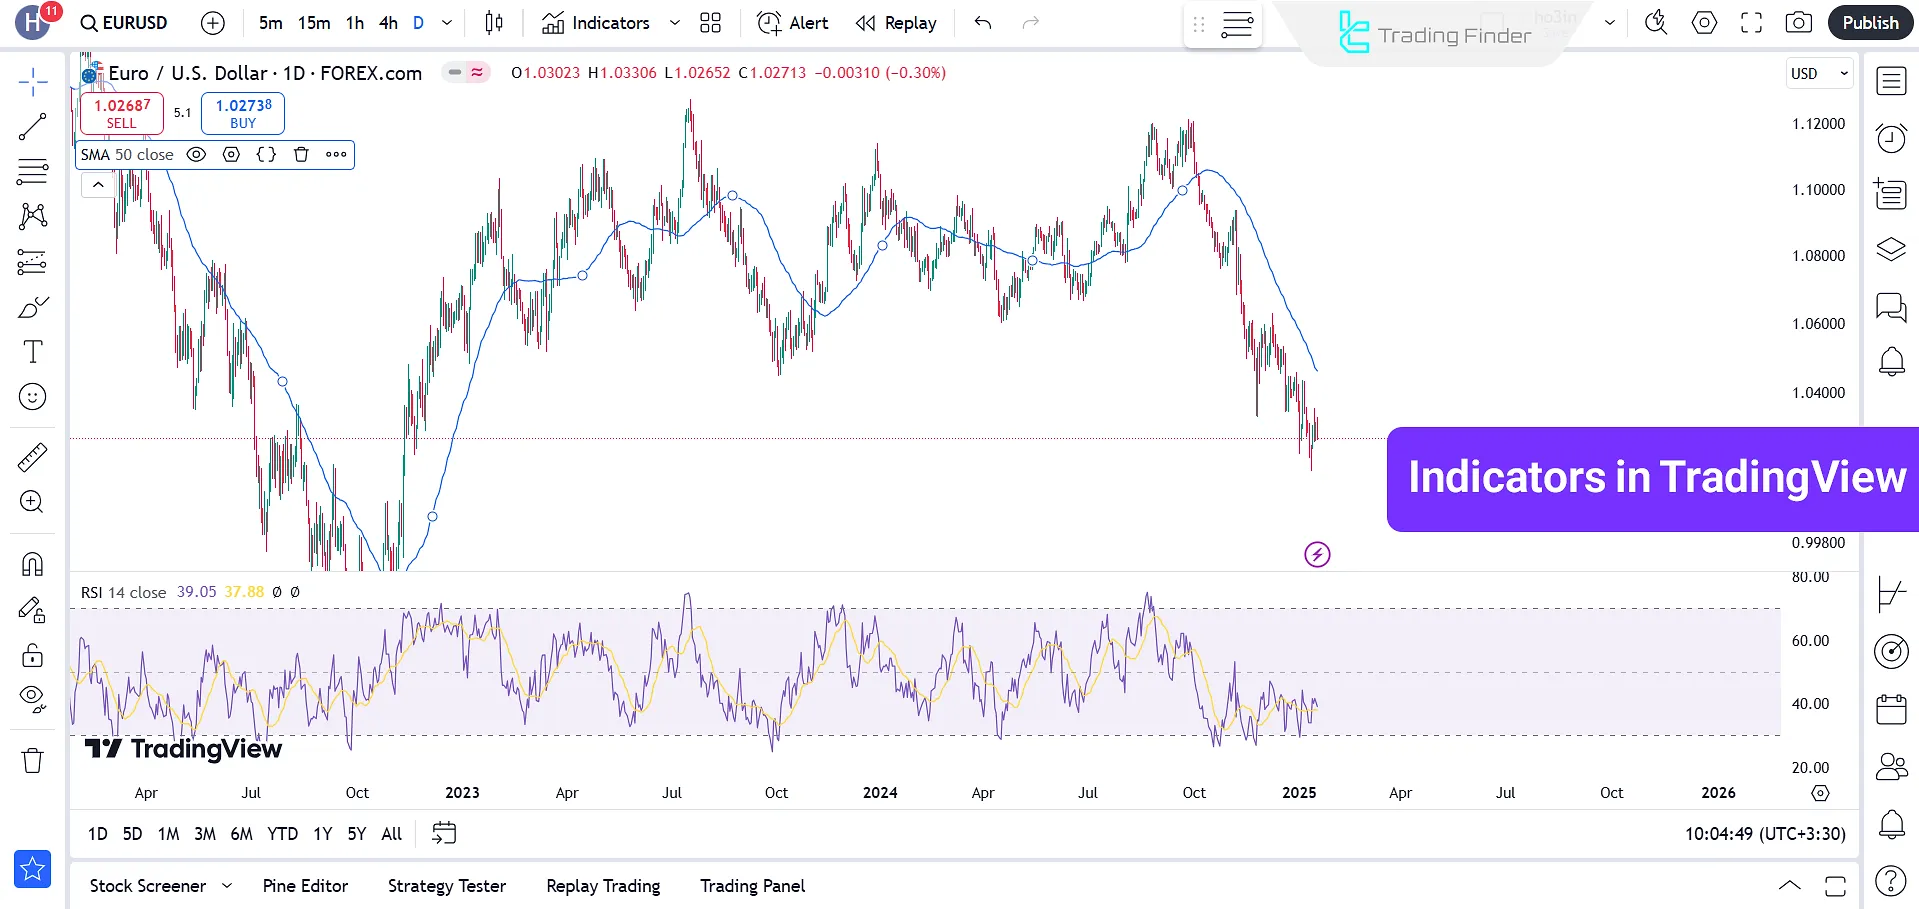
Technical Indicators
There are over 100 built-in indicators in TradingView. In addition, users can add thousands of custom indicators created by other traders from the platform’s Public Library to their charts. Common TradingView indicators:
- Moving Average (MA)
- Relative Strength Index (RSI)
- MACD
- Bollinger Bands
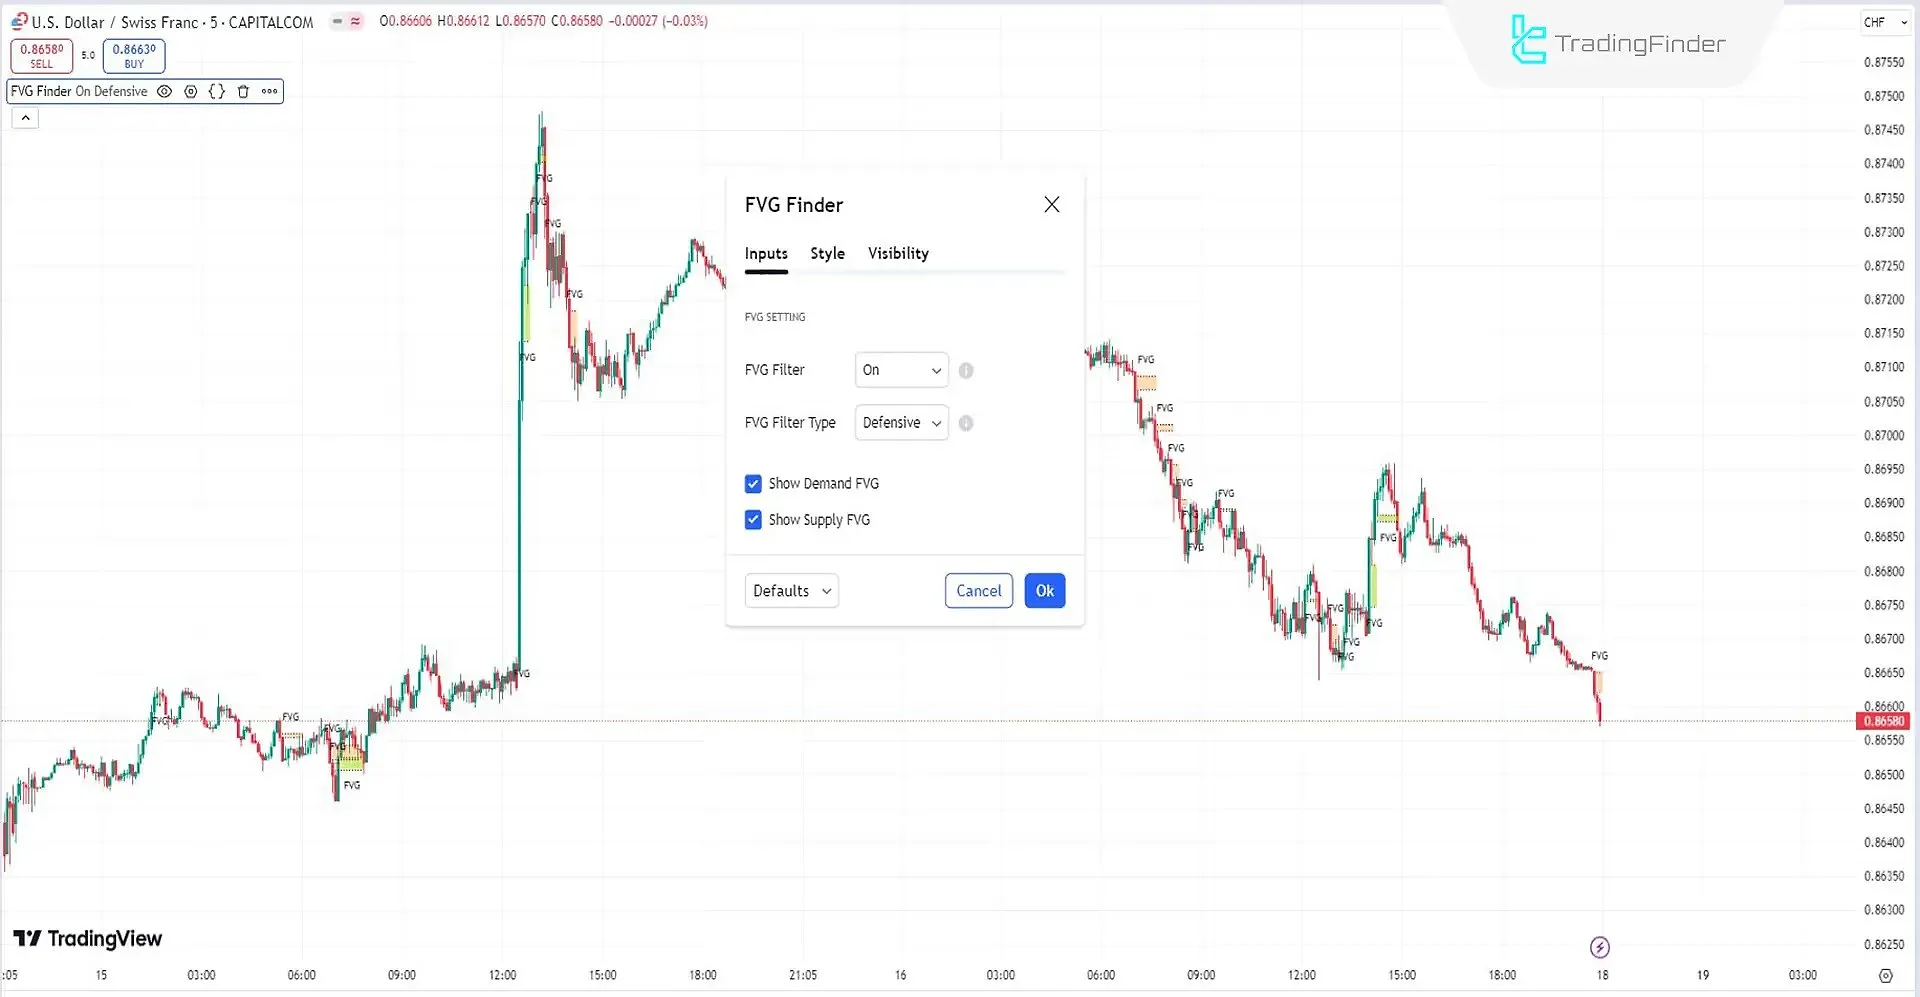
Sample of TradingFinder indicator in TradingView
The Fair Value Gap (FVG) Detector indicator is one of the key tools in ICT-style technical analysis whose main task is to identify imbalance areas in the price chart.
In this style, whenever in a strong market move the body of a candle does not fully cover the bodies of the previous and next candles, a Fair Value Gap forms.
These gaps indicate an imbalance between buyers and sellers, and the market usually tends to return to these areas to restore balance.
The FVG Detector automatically marks these areas on the chart; bullish gaps are displayed with a green box and bearish gaps with an orange box.
This feature enables the trader, without manual inspection and time consumption, to quickly identify important zones that can act as support or resistance.
This indicator falls under ICT and Smart Money tools and is very valuable for traders who work with concepts of liquidity, price imbalance, and price returning to empty zones. Tutorial video on using the FVG Detector indicator:
It is also usable in various markets such as forex, stocks, and cryptocurrencies, and is practical for day trading, scalping, and multi-timeframe styles.
In the settings section, the user can enable or disable the display of bullish gaps (Demand FVG) and bearish gaps (Supply FVG) and use various filters to remove extra gaps.
The Aggressive mode removes more gaps, while the Defensive mode focuses more on strong and valid candles and is considered more precise for many traders.
indicatorIn general, identifying FVGs in the ICT system is highly important and helps the trader recognize potential price reversal points. The FVG Detector simplifies this process and increases analysis accuracy by reducing human error.
This tool is especially one of the most essential indicators for professional traders seeking to use advanced liquidity concepts. Link to use the Fair Value Gap Detector indicator:
FVG Detector indicator in TradingView
Drawing tools
TradingView, with diverse drawing tools such as lines, Fibonacci, and technical patterns, provides precise and practical analysis for traders. TradingView tools:
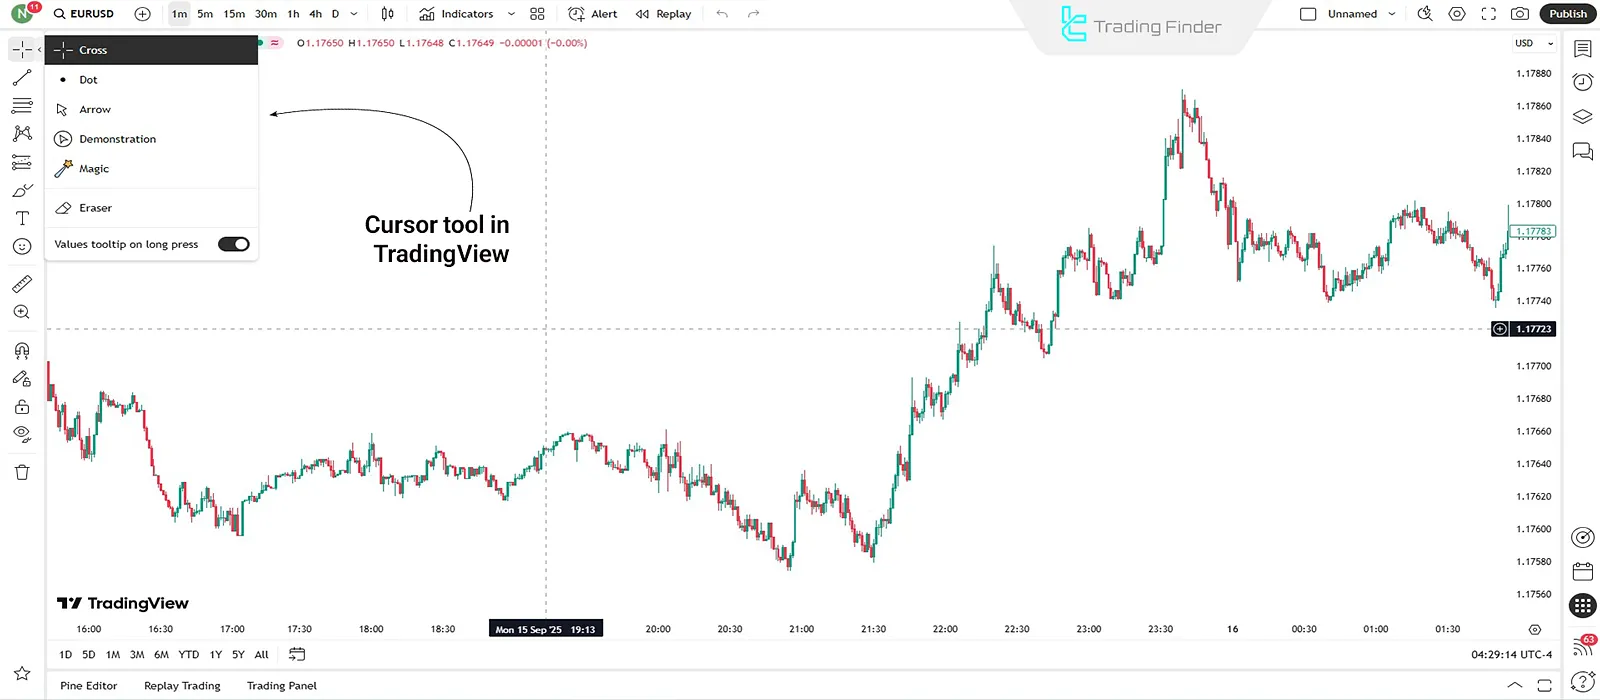
Mouse pointer tool in TradingView
The mouse pointer in TradingView is not just a simple cursor; this tool, by displaying precise price and time values on the horizontal and vertical axes, enables examining the most minute chart changes.
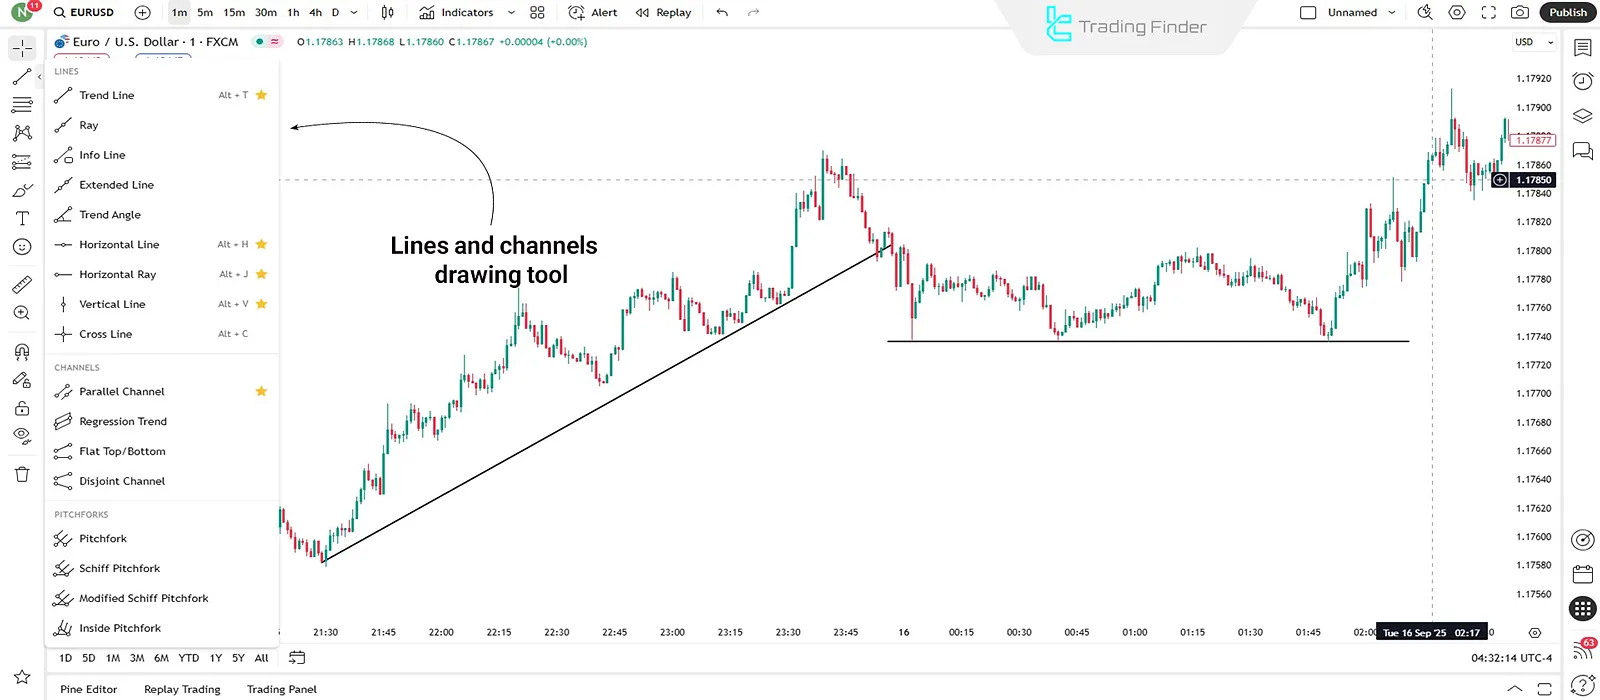
Example of using the line and channel drawing tool
One of the most widely used tools for analyzing price trends is lines and channels. In TradingView, you can draw ascending or descending trendlines, horizontal lines (support and resistance), and also parallel or deviation channels.
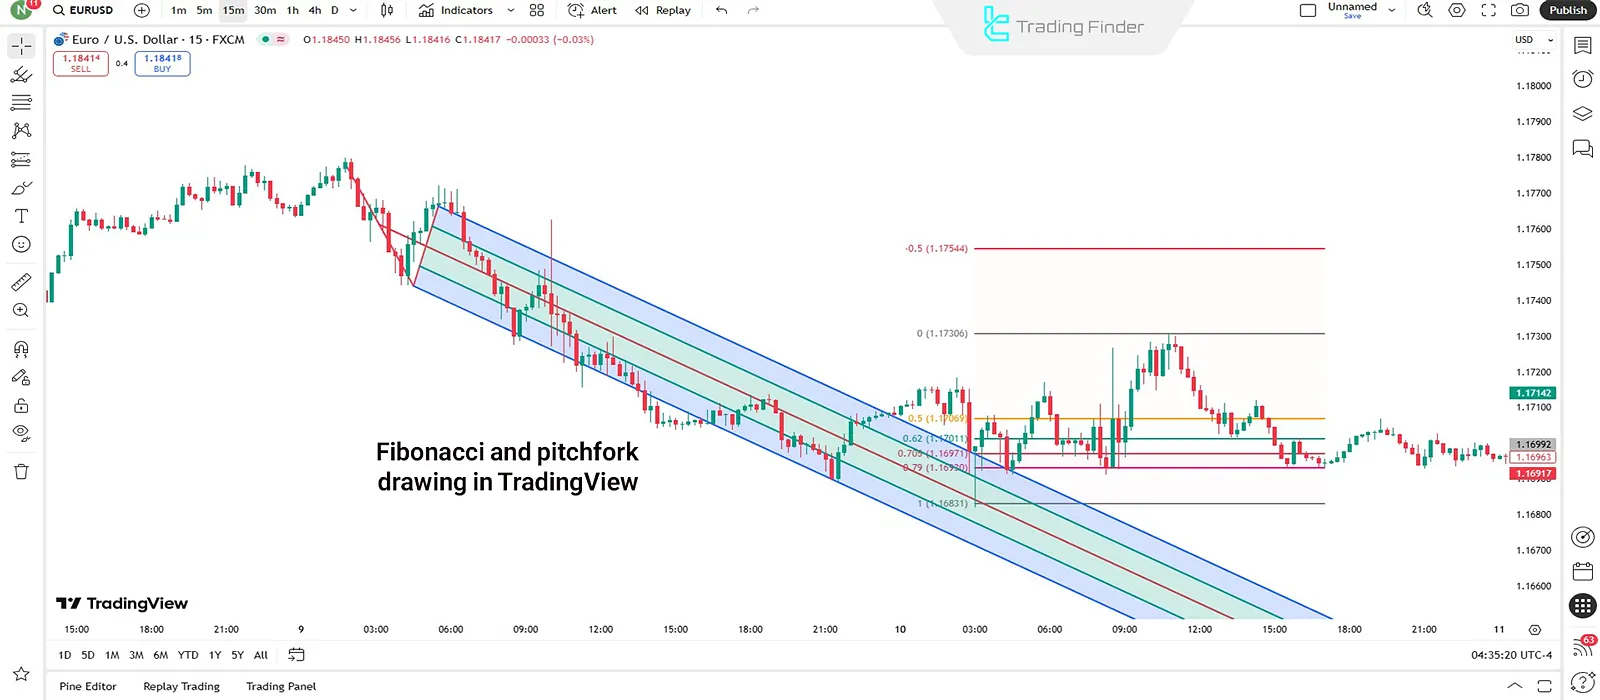
Example of using pitchfork, Gann, and Fibonacci tool in TradingView
TradingView provides an advanced set of analytical tools such as Fibonacci retracement, extension and time tools, Andrews’ Pitchfork, and Gann tools.
These tools are used to identify market reversal points, high-volatility zones, and price targets.
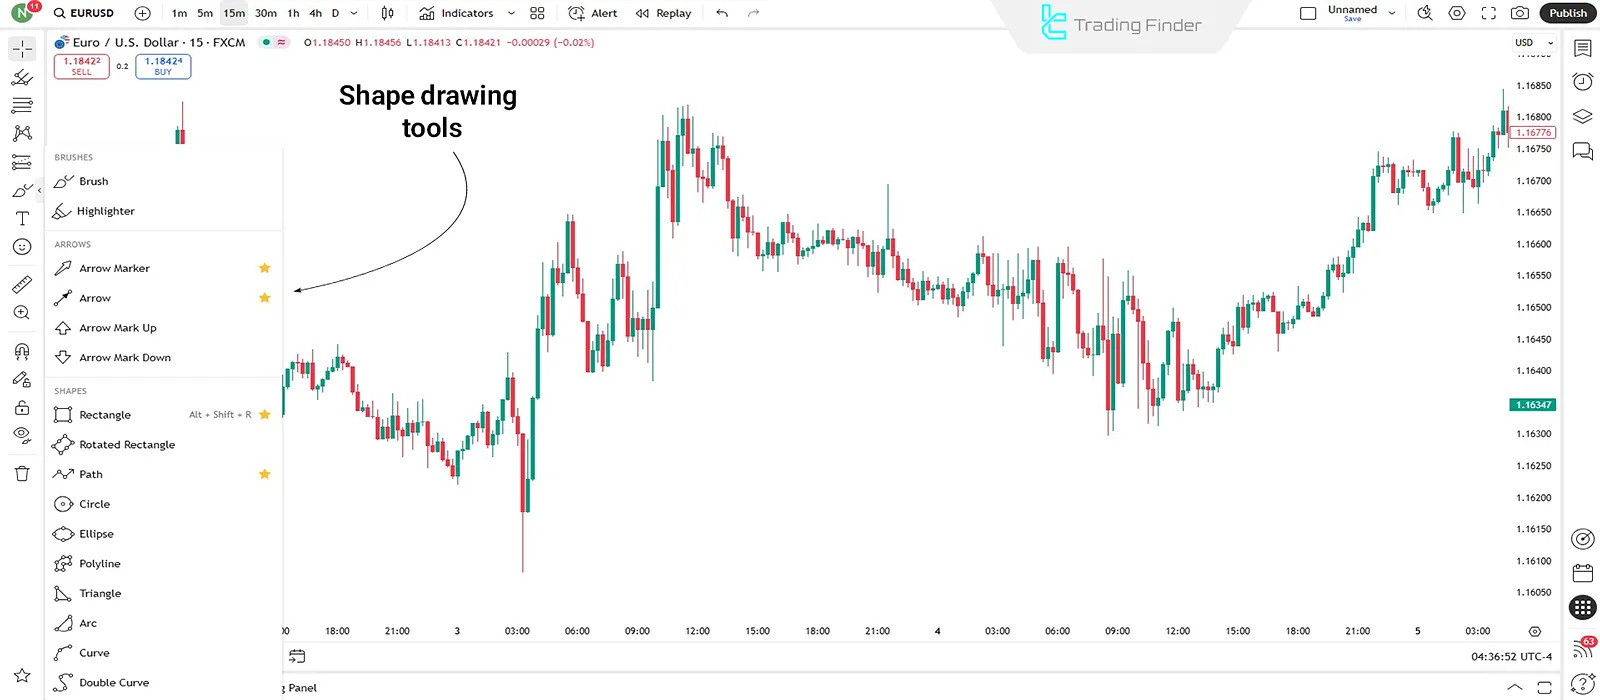
Example of using shape drawing tools in TradingView
For marking on the chart, tools such as drawing circles, rectangles, triangles, and curved lines are provided.
These tools allow traders to mark important zones, consolidation or breakout areas, and better understand the overall structure of price movements.
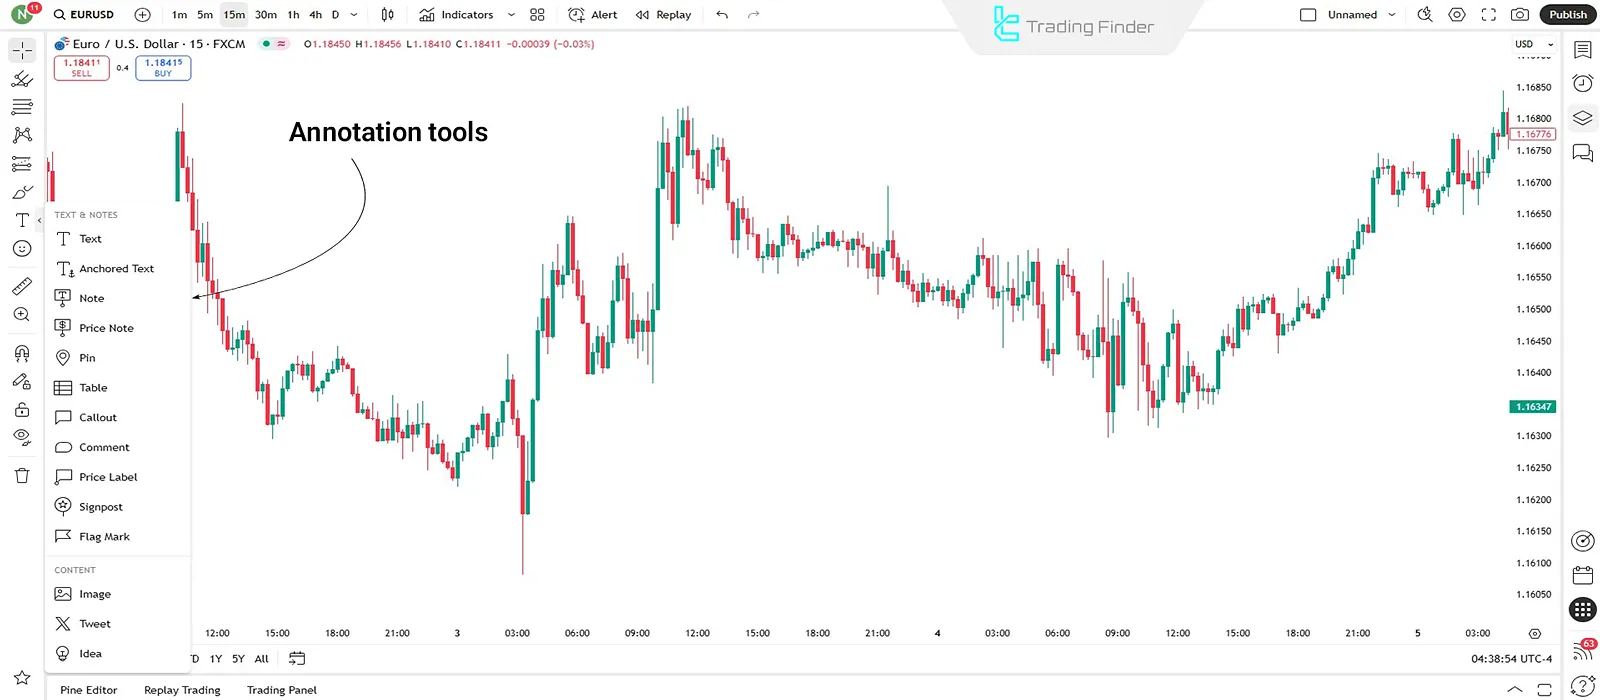
Example of using annotation tools in TradingView
Annotation tools allow the user to place notes directly on the chart. This feature is very useful for recording observations, reminding important points, or even teaching and sharing analyses.
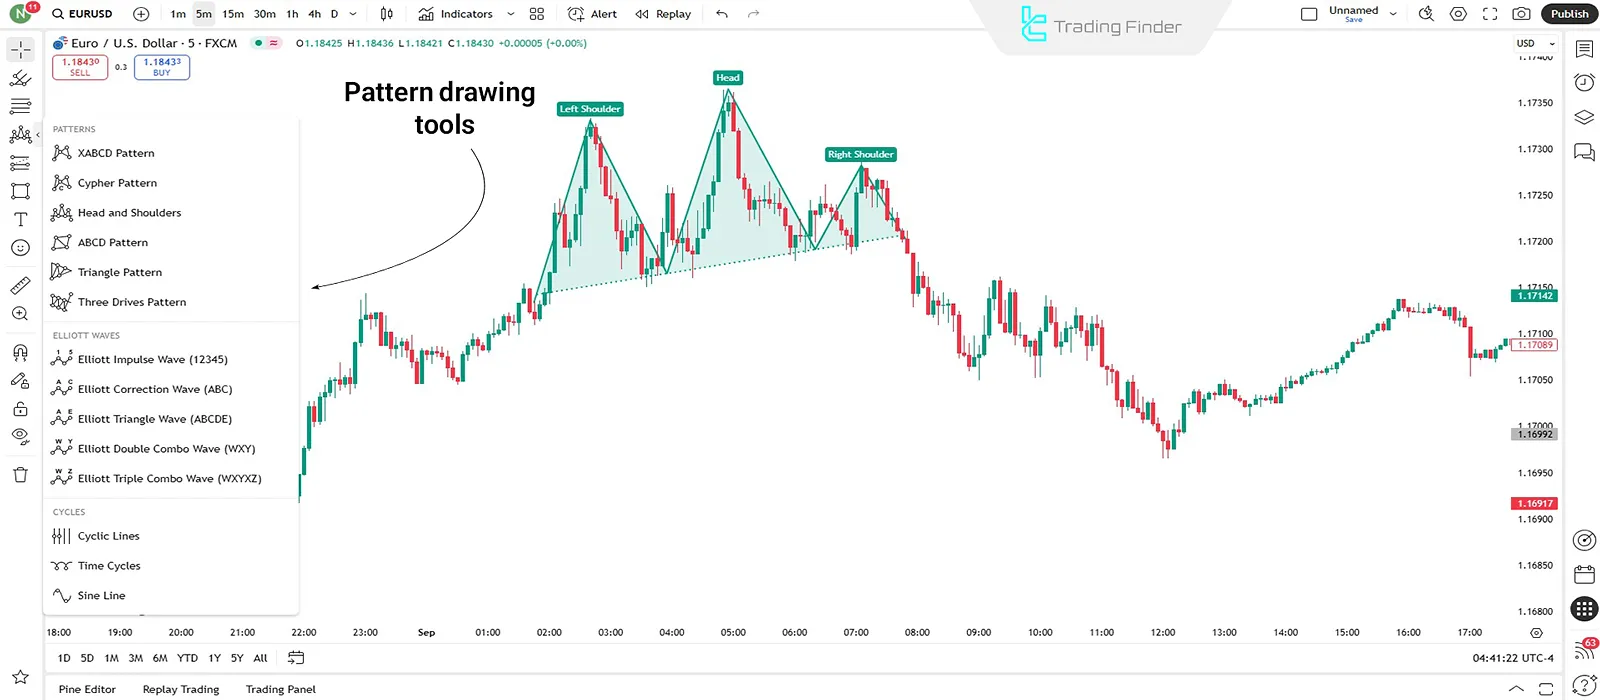
Example of using pattern drawing tools in TradingView
TradingView provides a set of tools for identifying and drawing classic technical patterns (such as head and shoulders, triangles, and flags) as well as harmonic patterns.
Traders can draw these patterns directly on the chart.
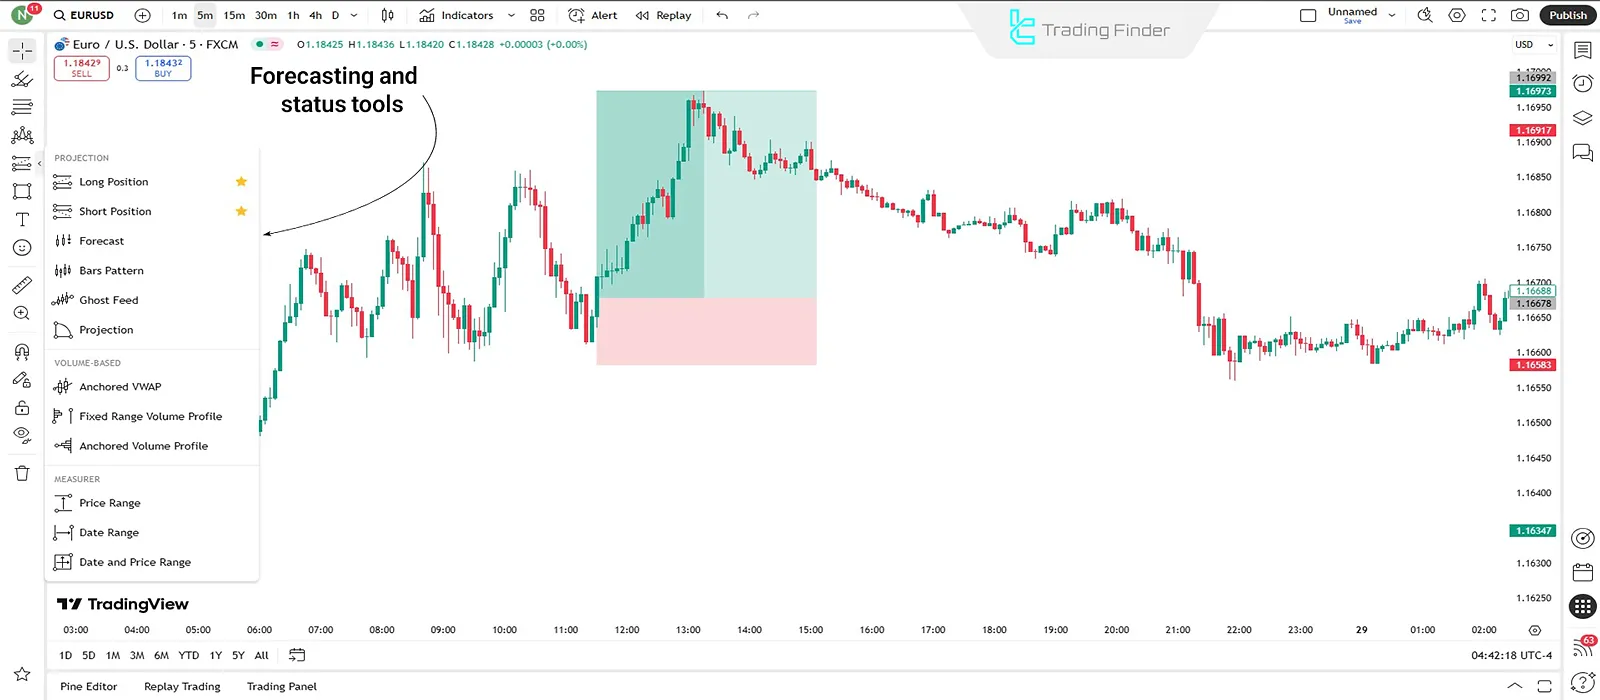
Example of using forecasting and position tools in TradingView
This category includes tools such as price movement forecasting (Forecast), long and short position measuring tools, and risk-to-reward ratio (RRR) calculation.
With these tools, the trader can simulate possible future scenarios, set profit targets and stop levels, and have better risk management.
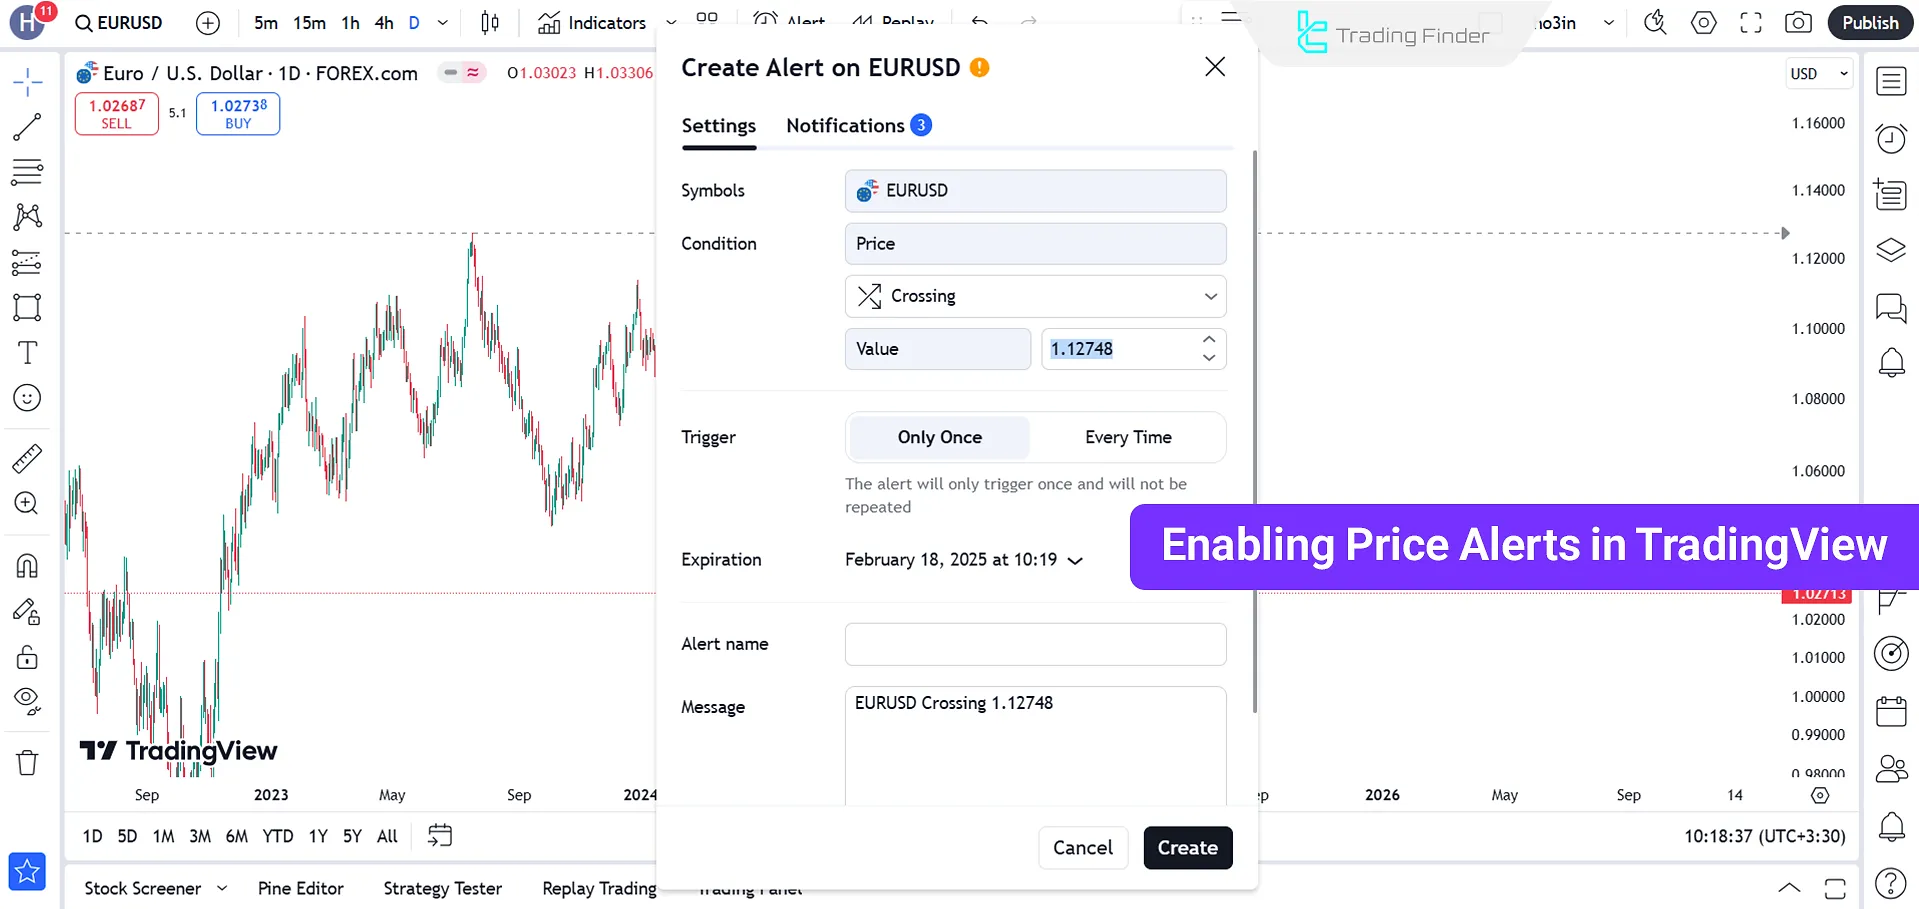
Trading Alerts
Custom alerts can be set in the TradingView platform based on price levels, technical indicators, or specific events.
Alerts are sent via visual pop-ups, email, SMS, and mobile notifications. These alerts can be received via the TradingView webhook, visual pop-ups, email, SMS, and mobile notifications.
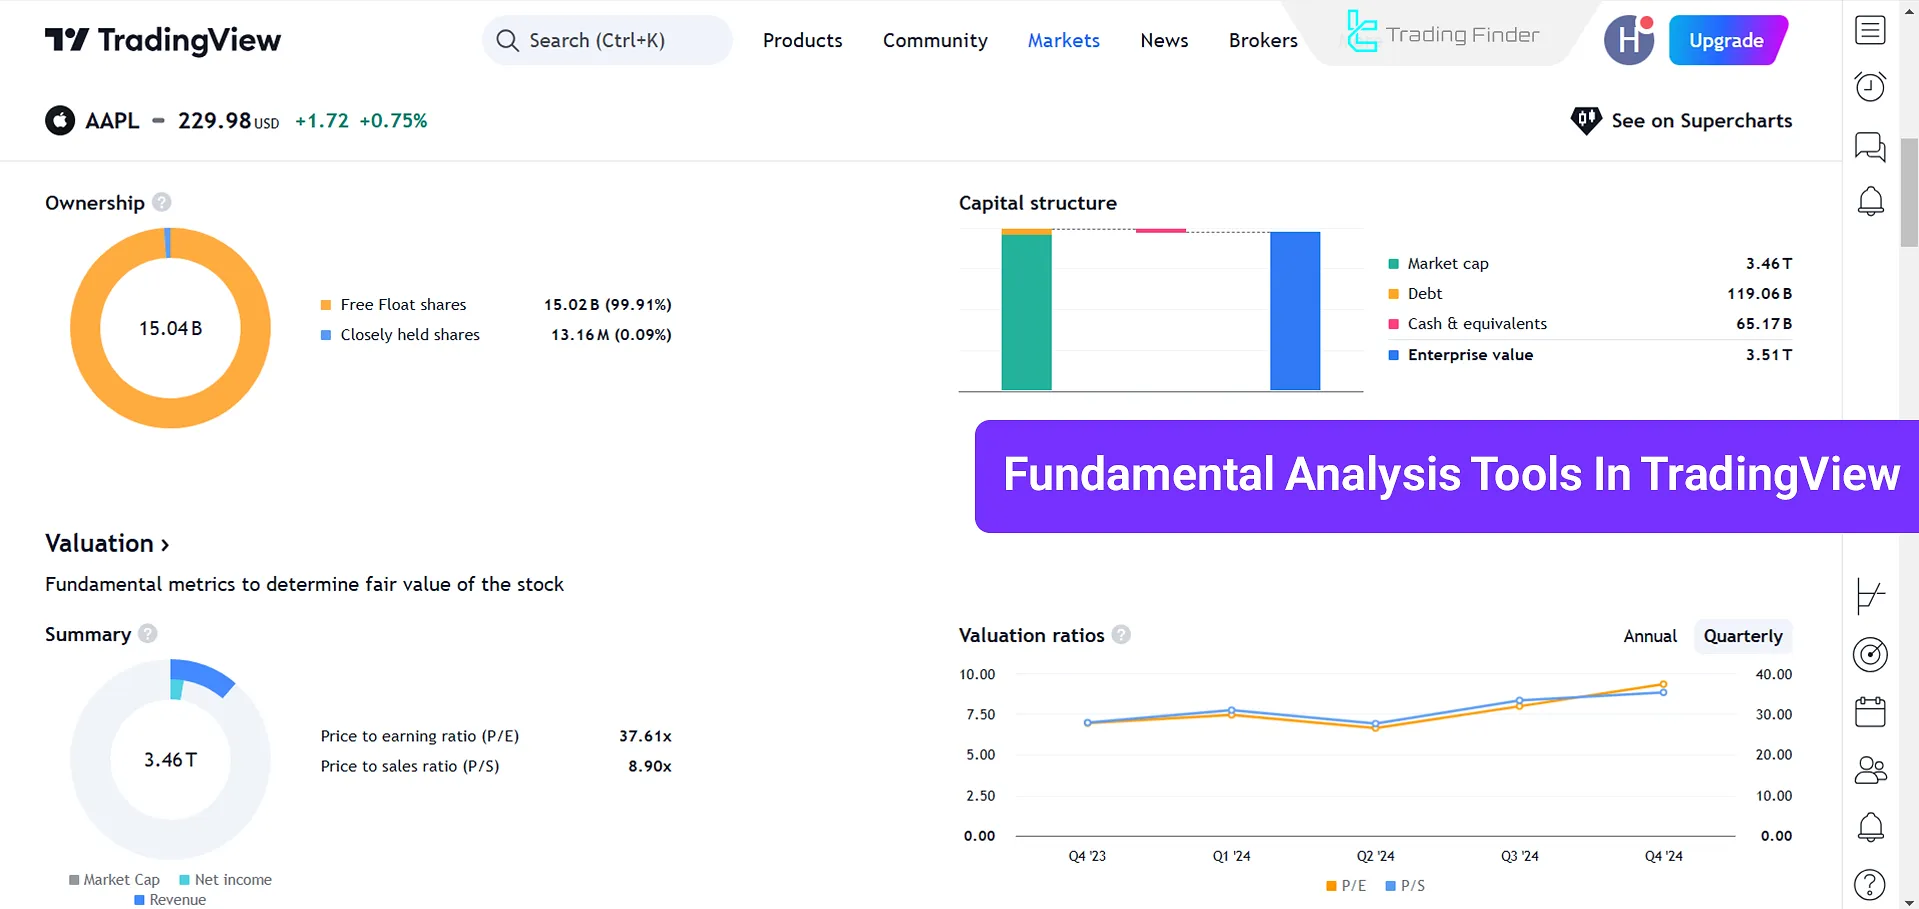
Fundamental Analysis
This platform provides tools for fundamental analysis, such as valuation ratios, financial statement analysis, and historical company data.
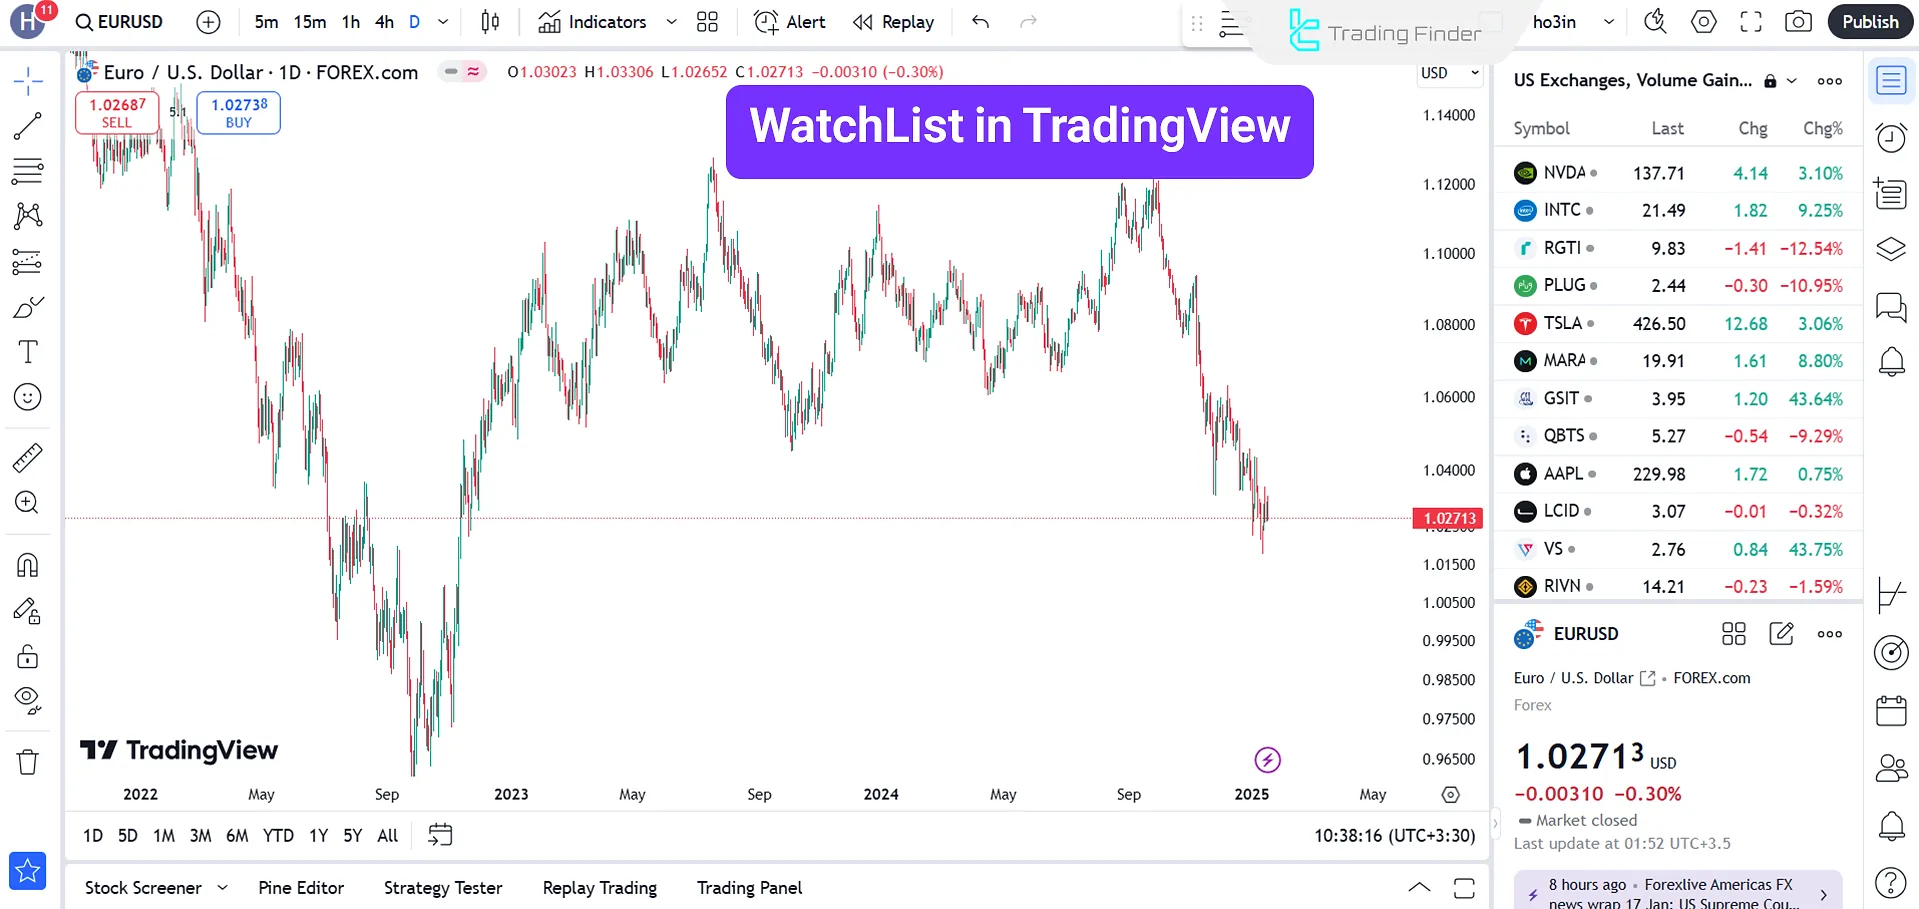
Watchlist
The watchlist in TradingView is a tool for tracking price movements and trading volume in real time.
The watchlist also allows quick switching between symbols. This tool is displayed in the widget panel on the right side of the chart.
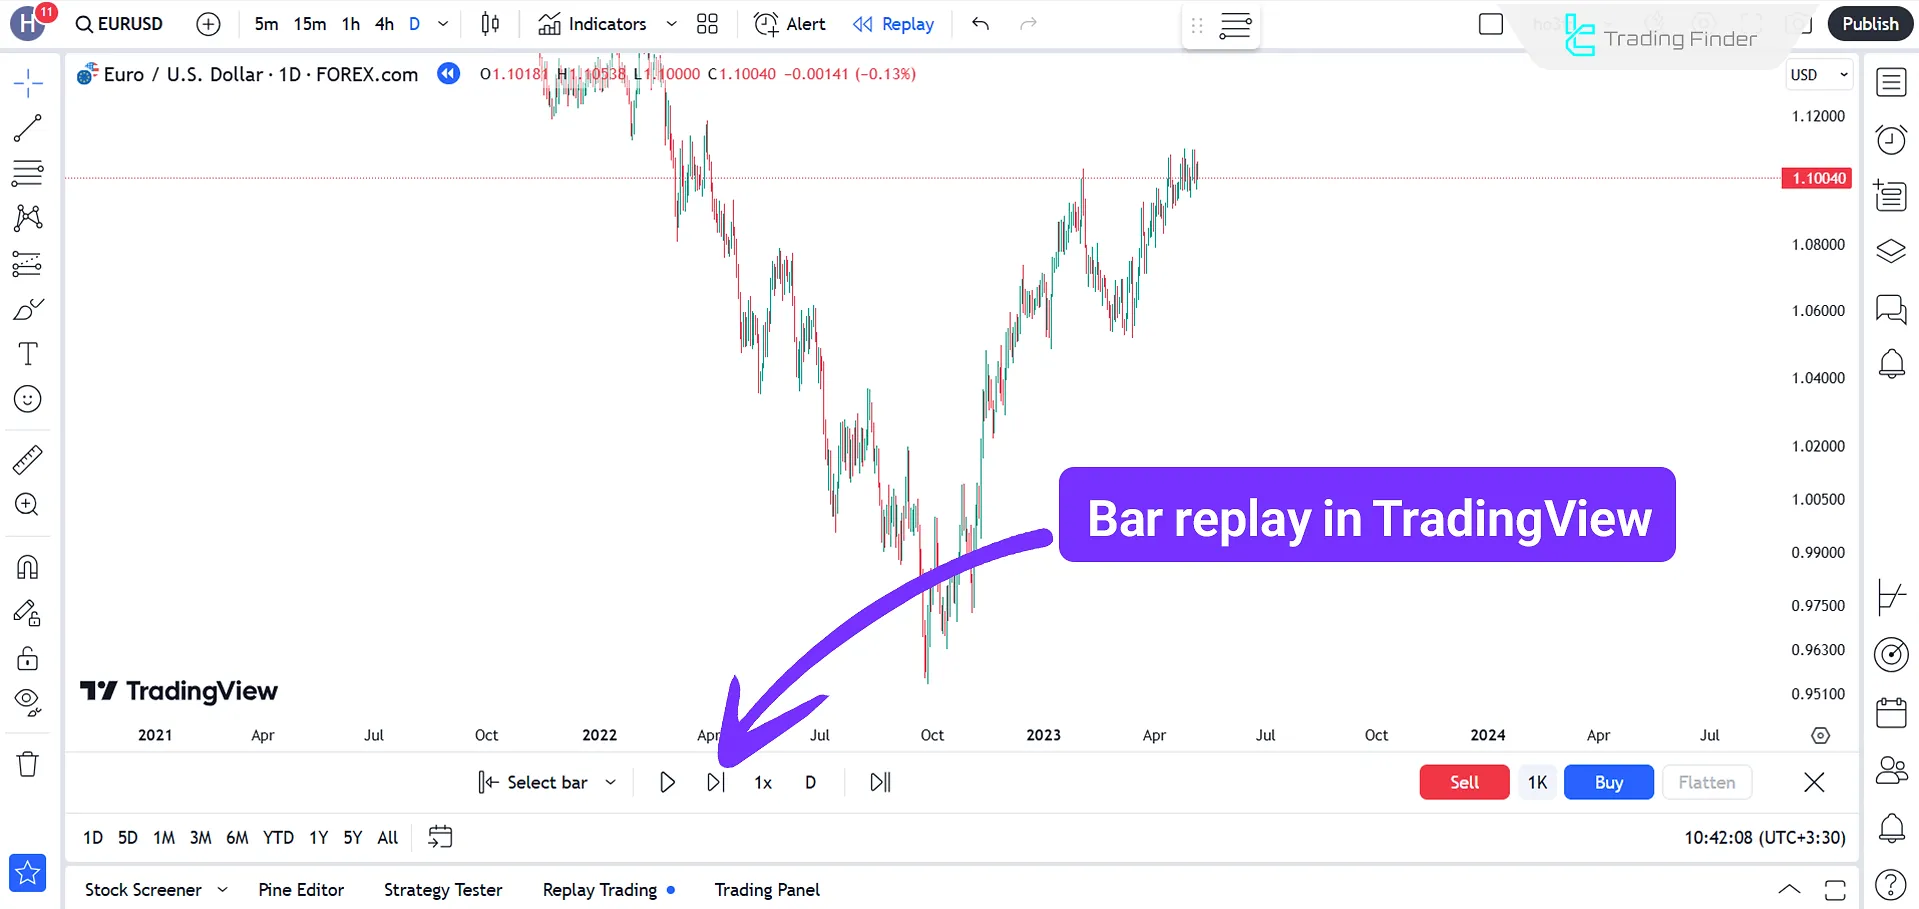
Price chart replay or Bar Replay
The Bar Replay feature allows users to simulate past price movements to test strategies and evaluate trade setups under various conditions.
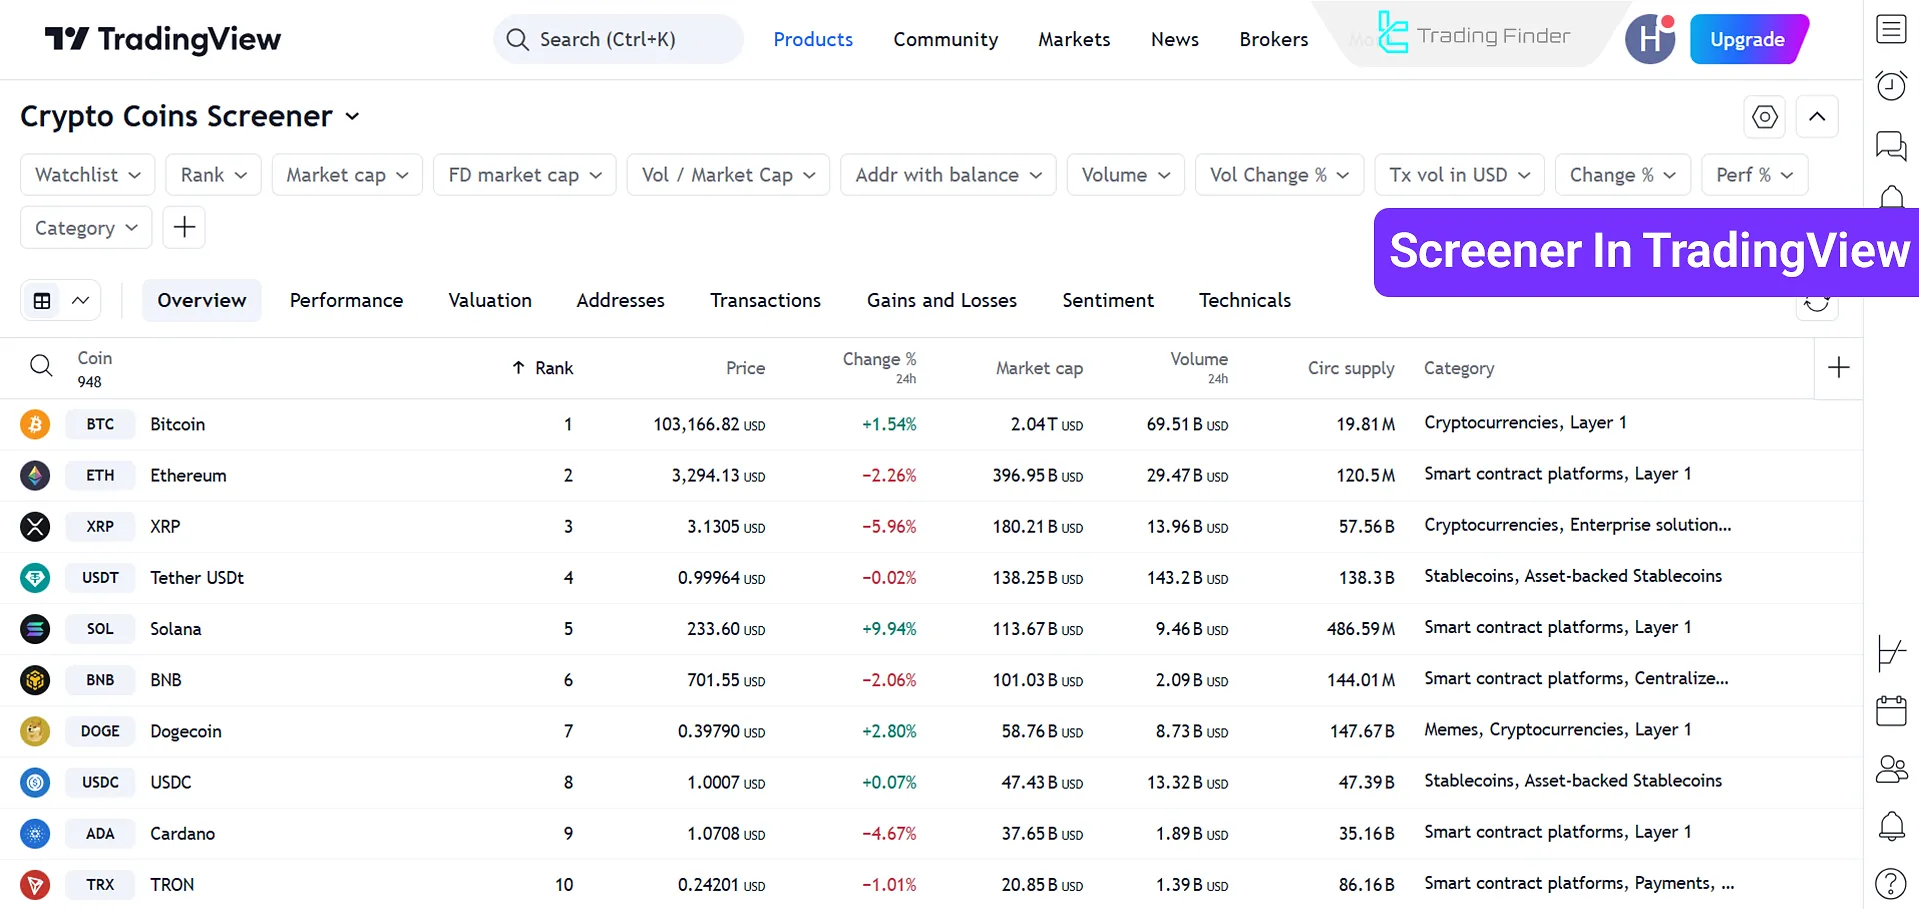
Market screener
The TradingView screener is a tool for searching assets and sorting them based on the user’s preferred parameters.
It is possible to filter stocks, currency pairs, or cryptocurrencies based on indicators, trading volume, and various technical conditions in the TradingView screener.
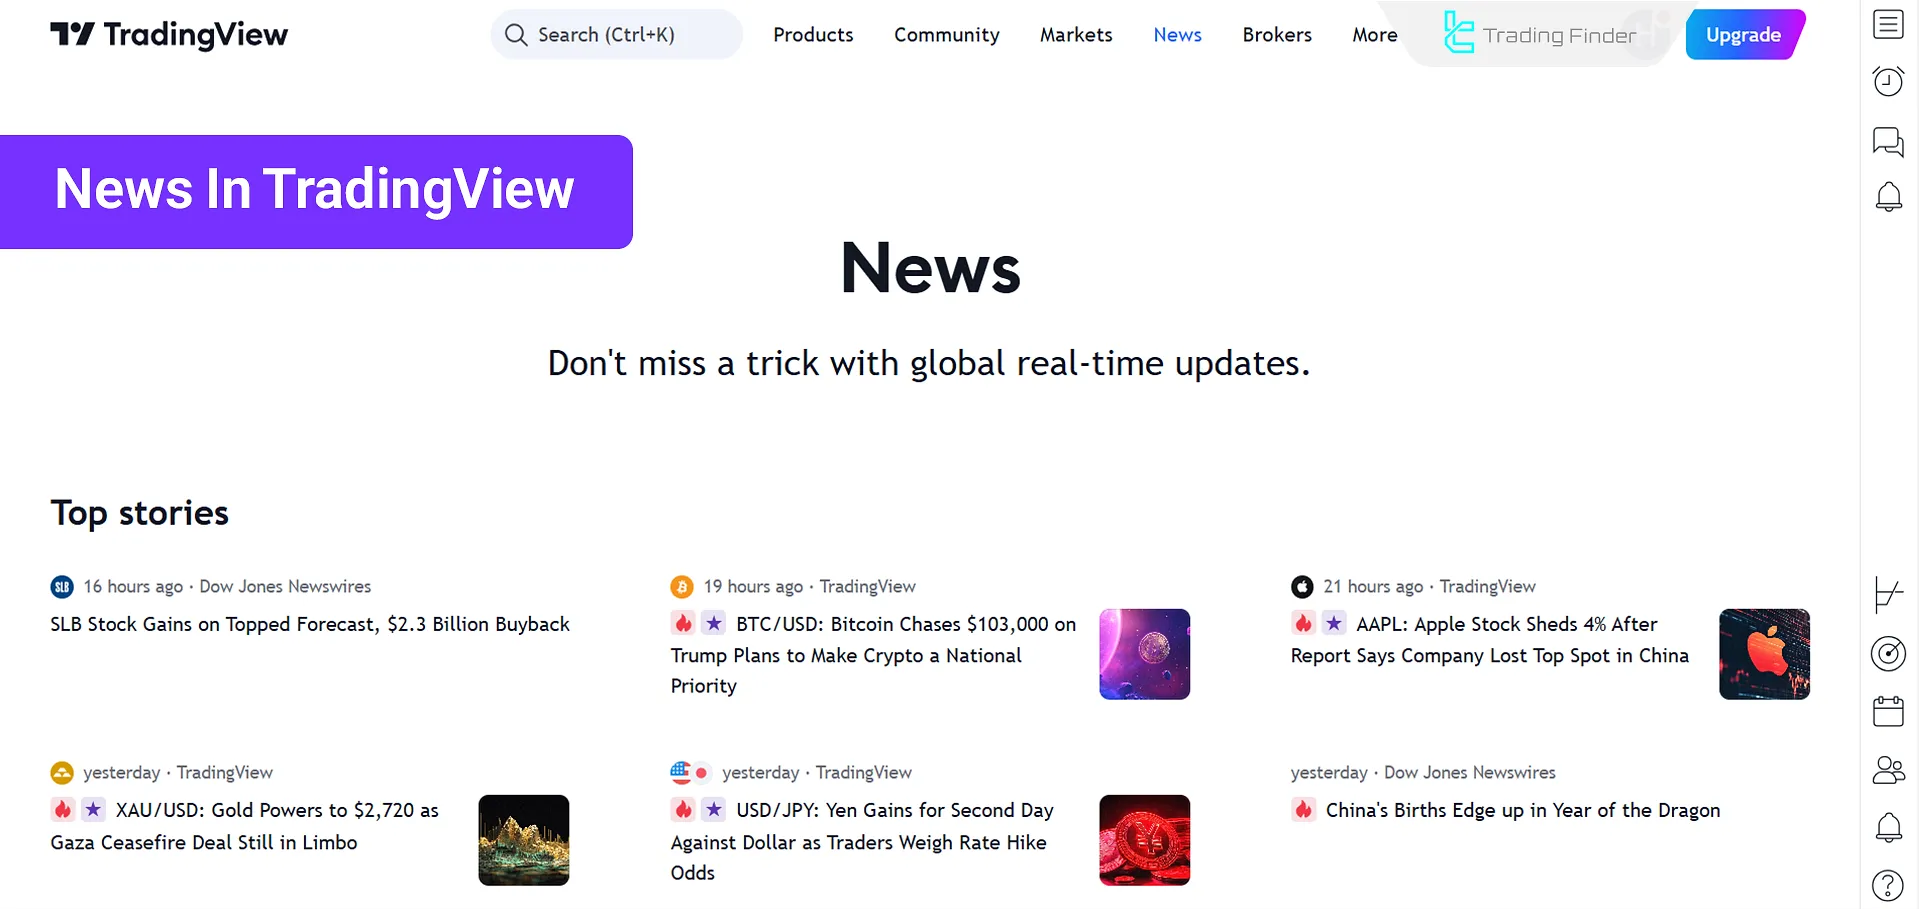
News Coverage
The News feature provides real-time and comprehensive coverage of financial news. Posts in this section are published by reputable global news agencies.
Traders can use it to react more quickly to economic events and market changes.
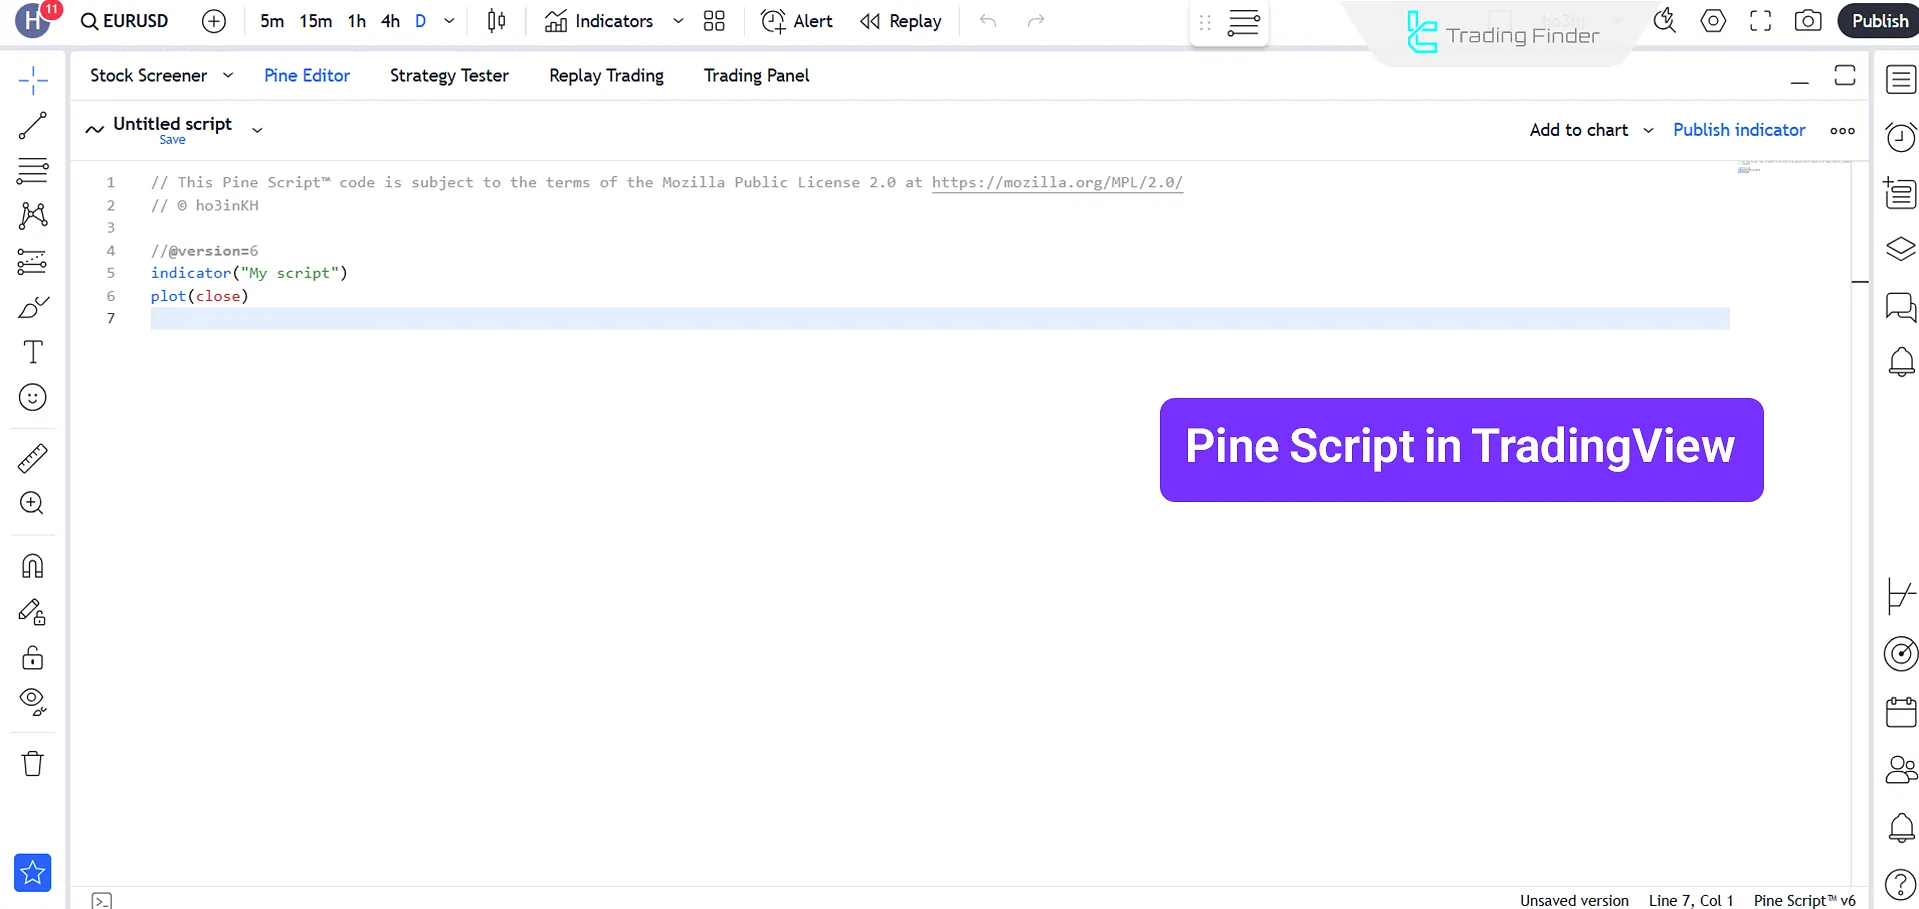
Pine Script
The platform allows users to create indicators, strategies, and alerts using the Pine Script programming language.
Check TradingFinder’s TradingView Scripts page for the most up-to-date indicators and trading strategies.
Trading Ideas
In the “Trading Ideas” section of TradingView, you can share strategies, tactics, and trading analyses with traders from other parts of the world or get inspiration from them, or even follow top analysts to receive regular updates from them.
Live Video Streaming
This trading platform supports live video streaming, enabling traders to share their market insights, analyses, and strategies with others interactively in real-time.
TradingView Chat
Using the chat feature in TradingView, you can converse with other traders in real time and use the exchange of ideas, signals, and trading experiences to improve decision-making and their application in your trades.
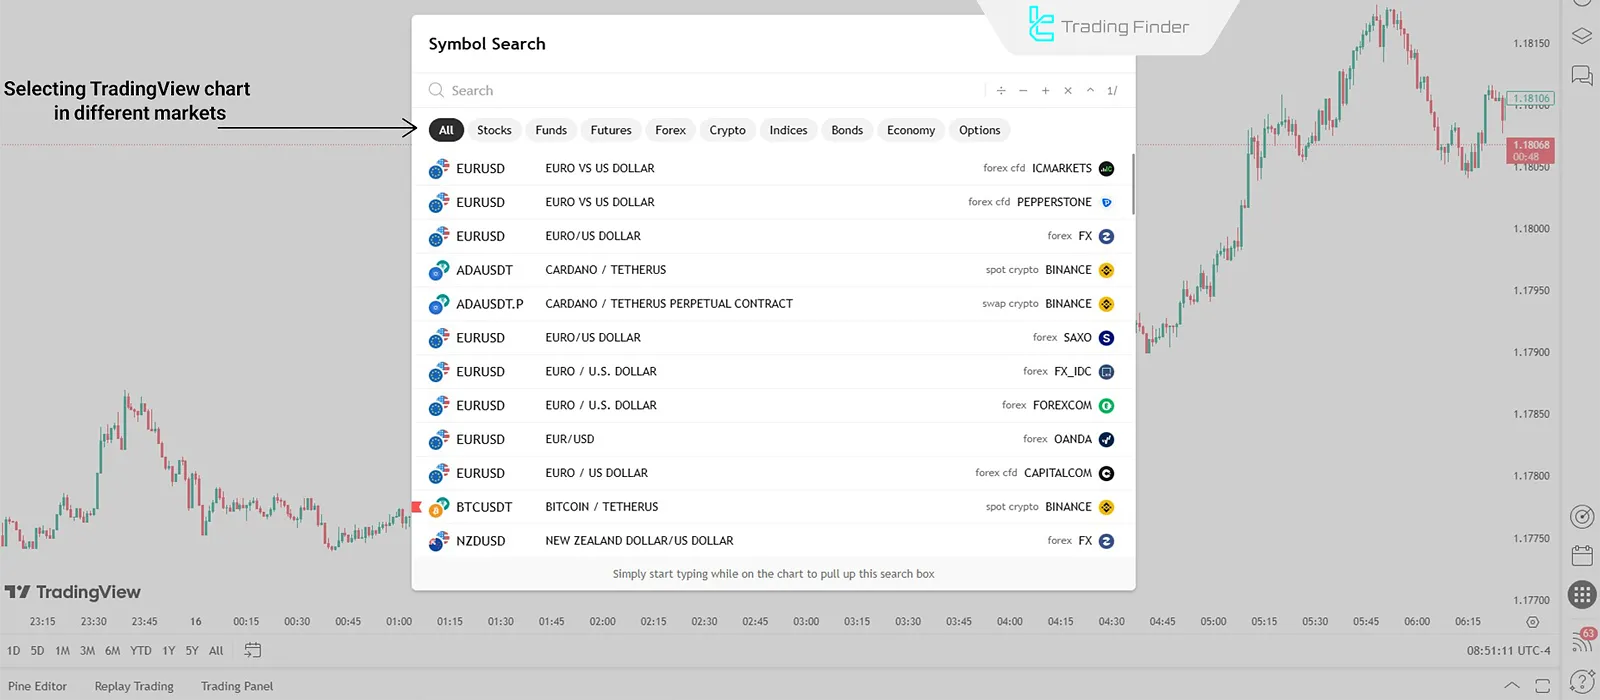
Applications of TradingView in different markets
TradingView is not just a general technical analysis software; the platform has practically become a multi-market hub where traders can monitor and analyze all major markets in one environment without needing multiple different software.
Applications of TradingView in different markets:
Forex
In the forex market, speed and accuracy in analysis are highly important.
TradingView allows you to review currency pairs with real-time data, use forex-specific indicators such as currency strength indexes or comparative tools for multiple pairs, and even view broker spreads on the chart.
Cryptocurrencies (Crypto)
One of the most widely used parts of TradingView is its comprehensive coverage of the crypto market. Almost all major exchanges such as Binance, Bybit, and Coinbase are supported on this platform.
A trader can compare the price of a coin from the perspective of several exchanges simultaneously, build a dedicated watchlist, and use price alerts to be informed of sudden movements of Bitcoin and altcoins.
Stock exchanges
In addition to global markets, TradingView also supports many regional exchanges such as the New York Stock Exchange (NYSE), Nasdaq (NASDAQ), and even some local markets.
Users can search for different stocks with tools like the Stock Screener, view company fundamental analysis (P/E, EPS, balance sheet) directly on the stock profile, and combine the data with technical charts.
Futures and derivatives markets (Futures)
Professional futures traders can review futures contracts of indices and commodities (such as gold, oil, wheat) in TradingView.
One important advantage of this section is the ability to compare contracts of different months on one chart, which leads to a better understanding of market structure (contango or backwardation).
Advantages and disadvantages of TradingView
Despite the countless advantages of the TradingView site, this platform is not without flaws. Advantages and disadvantages of TradingView:
Advantages | Disadvantages |
Providing a wide range of tools for technical and fundamental analysis | Limitations in the free version |
A platform for trading various markets and assets | Limited customer support |
Easy comparison of different instruments on a single chart | Lack of cooperation with all brokers and exchanges |
User-friendly interface with customizable layouts | Occasional delays in real-time data updates |
Access across web, desktop, and mobile platforms | Advanced features may require higher subscription costs |
Security and privacy in TradingView
One of the concerns of traders is the security of accounts and privacy on international platforms such as TradingView.
TradingView adheres to high standards in this area. Important points to increase TradingView security:

Encryption and account security
All communications in TradingView are encrypted with SSL/HTTPS. There is also the option to enable two-factor authentication (2FA), which, by connecting to Google Authenticator or SMS, multiplies account security.
Personal data management
TradingView does not store sensitive financial information (such as bank card numbers or exchange account details).
Even if you connect your trading account to TradingView through a broker, the core payment and asset data remain on the broker’s side.
Privacy in published content
The ideas, analyses, and charts you publish on your profile can be public or private depending on your choice. Therefore, if you do not want your personal analyses to be accessible to everyone, simply save them as Private.
Final word
TradingView provides traders with customizable online price charts and analytical tools including technical indicators, drawing tools, bar replay, and watchlists.
By offering tools such as trading alerts and extensive news coverage, TradingView helps users stay informed about market developments.
Ultimately, the limitations of the free version and the lack of broad support for all brokers create challenges for some traders.


