![Market Crash Alert Indicator for MetaTrader 4 - Free Download [TFlab]](https://cdn.tradingfinder.com/image/464870/2-109-en-market-crash-alert-mt4-1.webp)
![Market Crash Alert Indicator for MetaTrader 4 - Free Download [TFlab] 0](https://cdn.tradingfinder.com/image/464870/2-109-en-market-crash-alert-mt4-1.webp)
![Market Crash Alert Indicator for MetaTrader 4 - Free Download [TFlab] 1](https://cdn.tradingfinder.com/image/464862/2-109-en-market-crash-alert-mt4-2.webp)
![Market Crash Alert Indicator for MetaTrader 4 - Free Download [TFlab] 2](https://cdn.tradingfinder.com/image/464863/2-109-en-market-crash-alert-mt4-3.webp)
![Market Crash Alert Indicator for MetaTrader 4 - Free Download [TFlab] 3](https://cdn.tradingfinder.com/image/464868/2-109-en-market-crash-alert-mt4-4.webp)
The Market Crash Alert indicator is a technical analysis tool designed to identify sudden and sharp price fluctuations in financial markets. This trading tool identifies unusual price movements by analyzing the size of candlestick bodies over specific time frames.
Accordingly, whenever sudden price changes occur and candlesticks with significantly larger bodies than the previous average are formed, the indicator flags them as critical alerts, displaying changes through the power of coloredoscillator bars or a textual warning on the chart.
Market Crash Alert Indicator Table
The following table outlines the general features of the Market Crash Alert indicator:
Indicator Categories: | Oscillators MT4 Indicators Trading Assist MT4 Indicators Momentum Indicators in MT4 |
Platforms: | MetaTrader 4 Indicators |
Trading Skills: | Elementary |
Indicator Types: | Reversal MT4 Indicators |
Timeframe: | Multi-Timeframe MT4 Indicators |
Trading Style: | Intraday MT4 Indicators |
Trading Instruments: | Share Stocks MT4 Indicators Indices Market MT4 Indicators Commodity Market MT4 Indicators Stock Market MT4 Indicators Cryptocurrency MT4 Indicators Forex MT4 Indicators |
Market Crash Alert Indicator Overview
The Market Crash Alert Indicator identifies abnormal market movements by measuring the range of candlestick changes; essentially, its core function revolves around detecting candles with high momentum.
The graphical output appears as bars on the oscillator panel:
- Green bars: Indicate buying pressure and strong bullish movements;
- Red bars: Indicate selling pressure and steep bearish moves.
The values of these bars are measured based on relative movement strength.
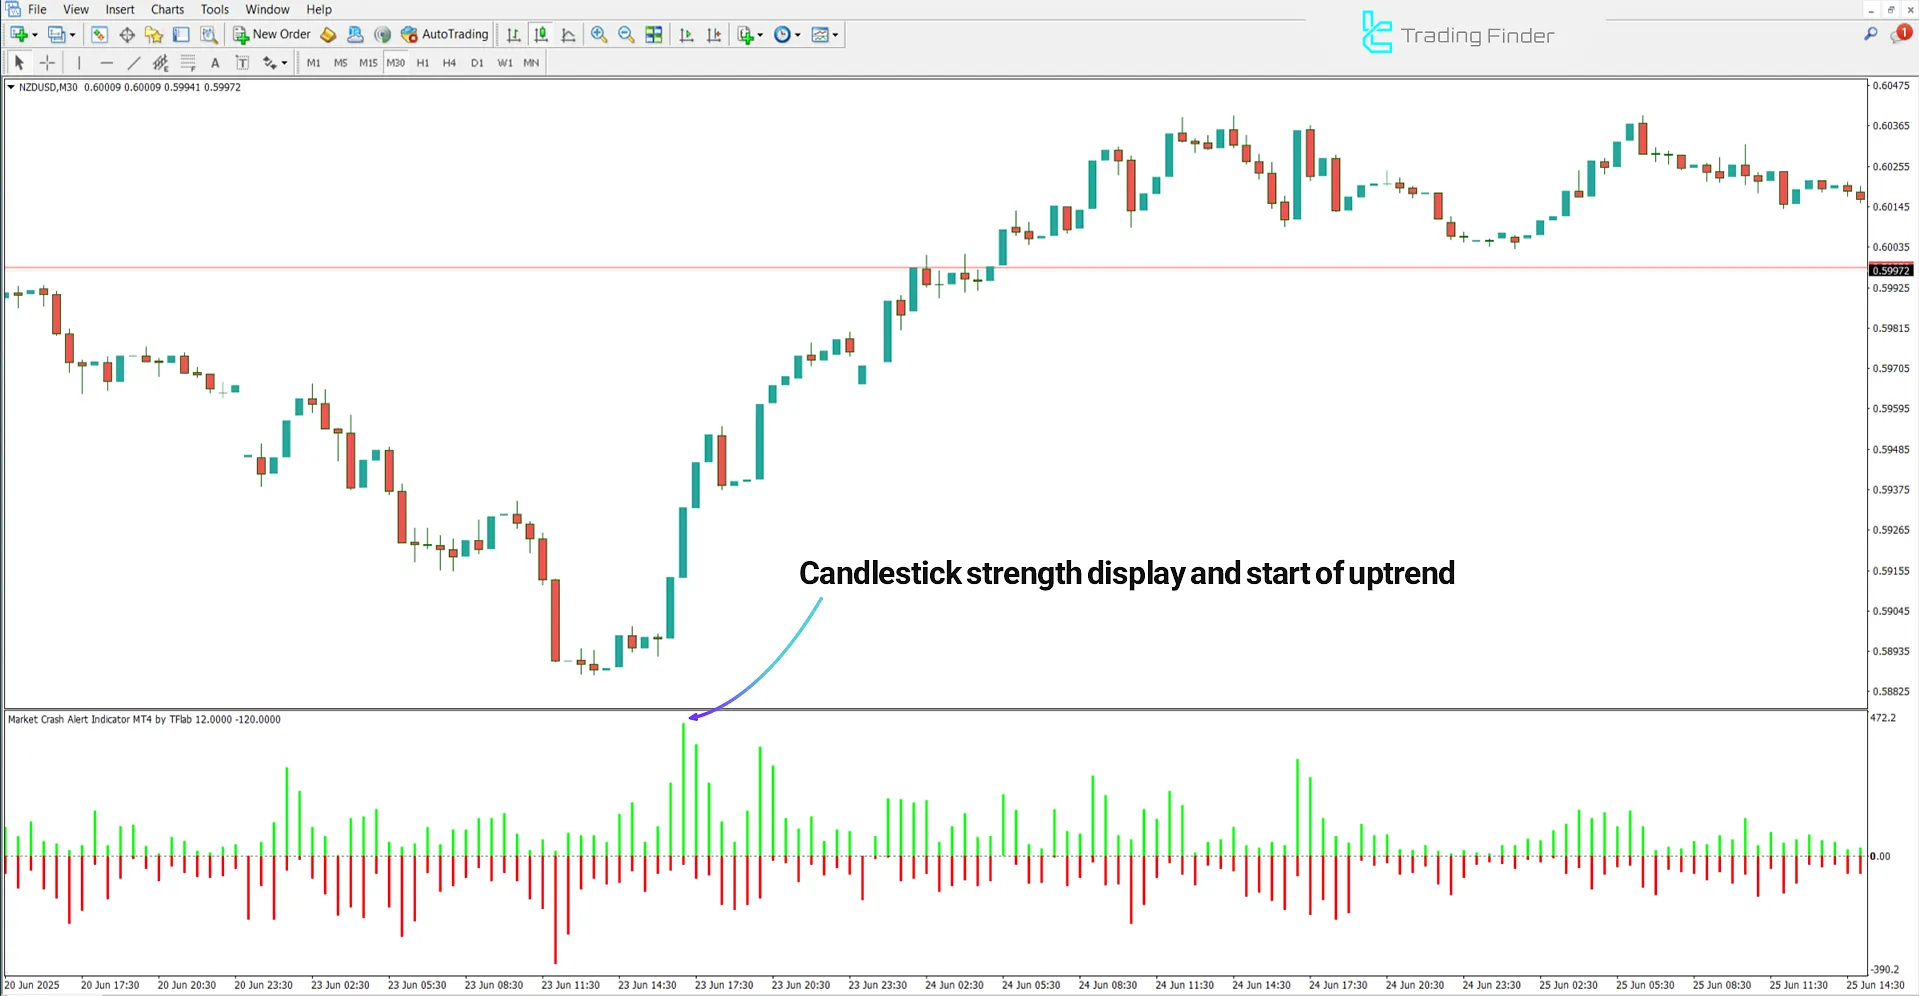
Uptrend Conditions
The price chart below displays the NZD/USD currency pair in a 30-minute timeframe. When the strength of the green bar exceeds that of the red bar, it indicates that buyers are dominating the market.
If the green bar also surpasses the sensitive level (1000+), this may signal the formation of a bullish momentum move and a suitable zone for entering buy trades.

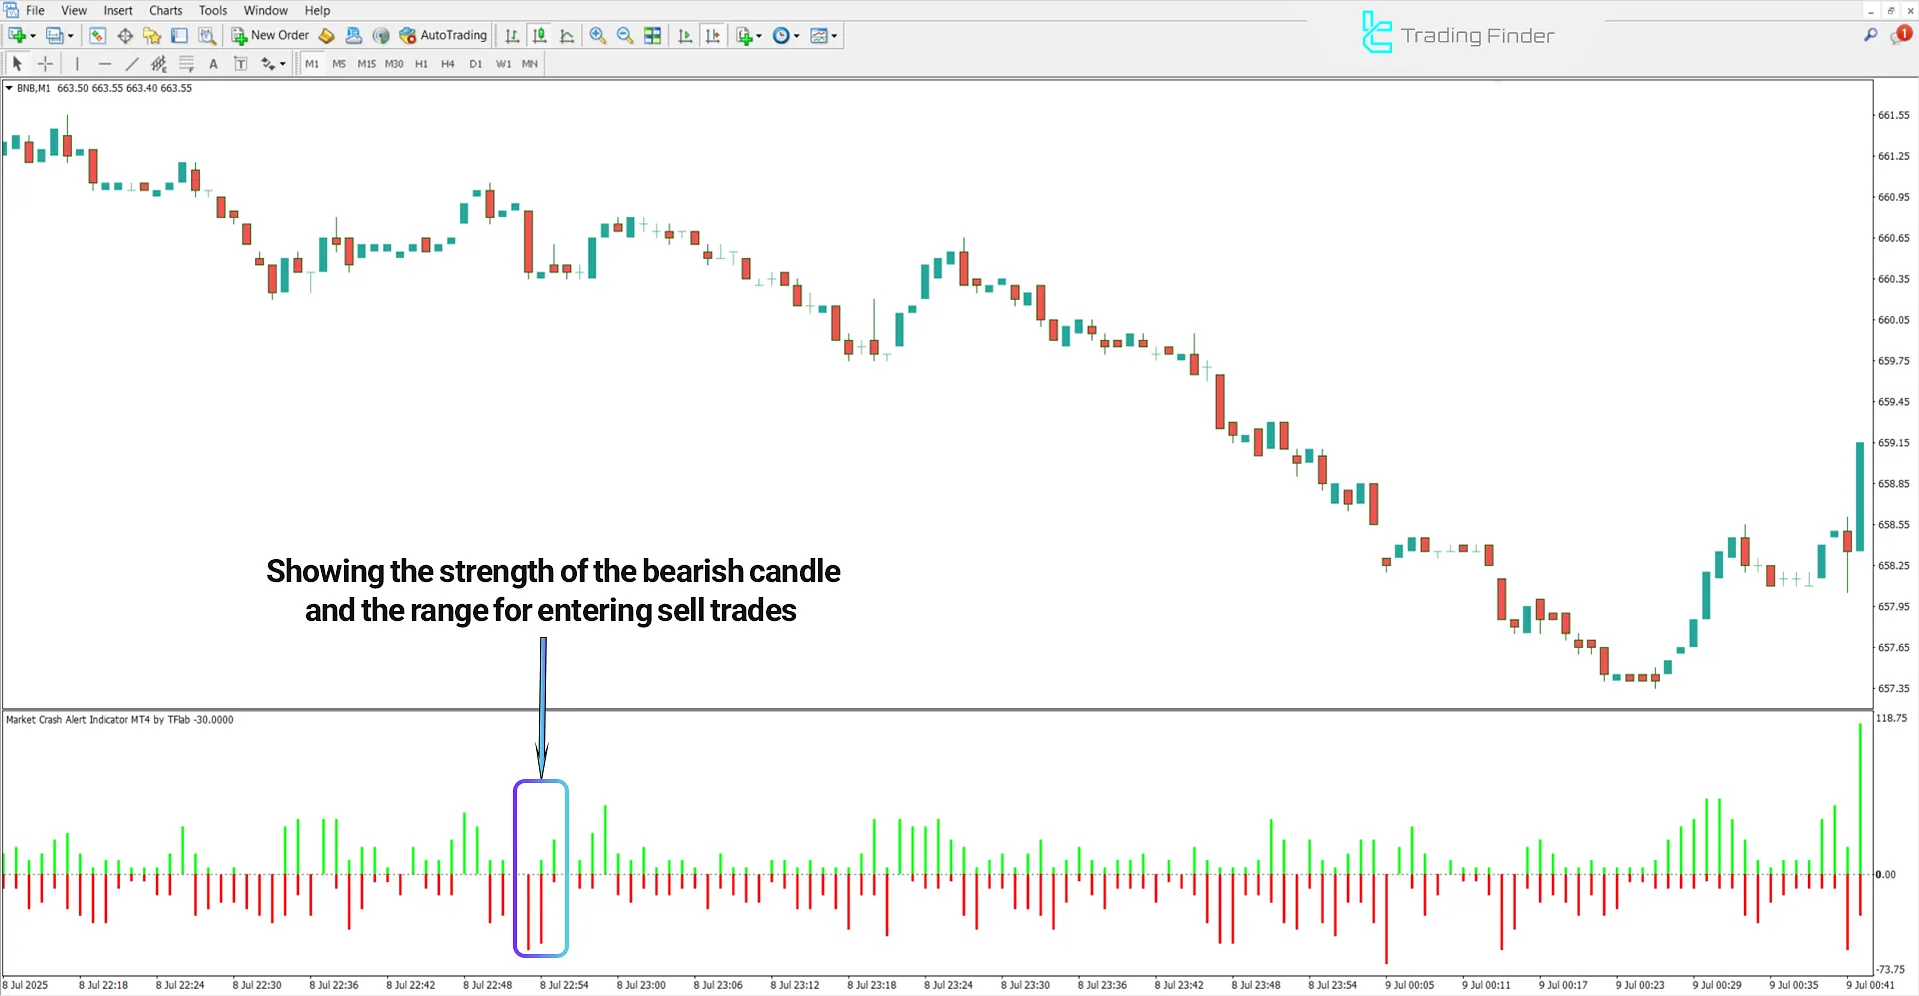
Downtrend Conditions
The image below shows the BNB cryptocurrency index in the 4-hour timeframe. In this oscillator, when the strength of the red bar exceeds that of the green bar, this reflects selling pressure and a bearish trend formation.
If under such conditions the red bar drops below the sensitive level (1000-), it can be interpreted as a strong bearish momentum move. A textual alert provides a valid entry zone.

Market Crash Alert Indicator Settings
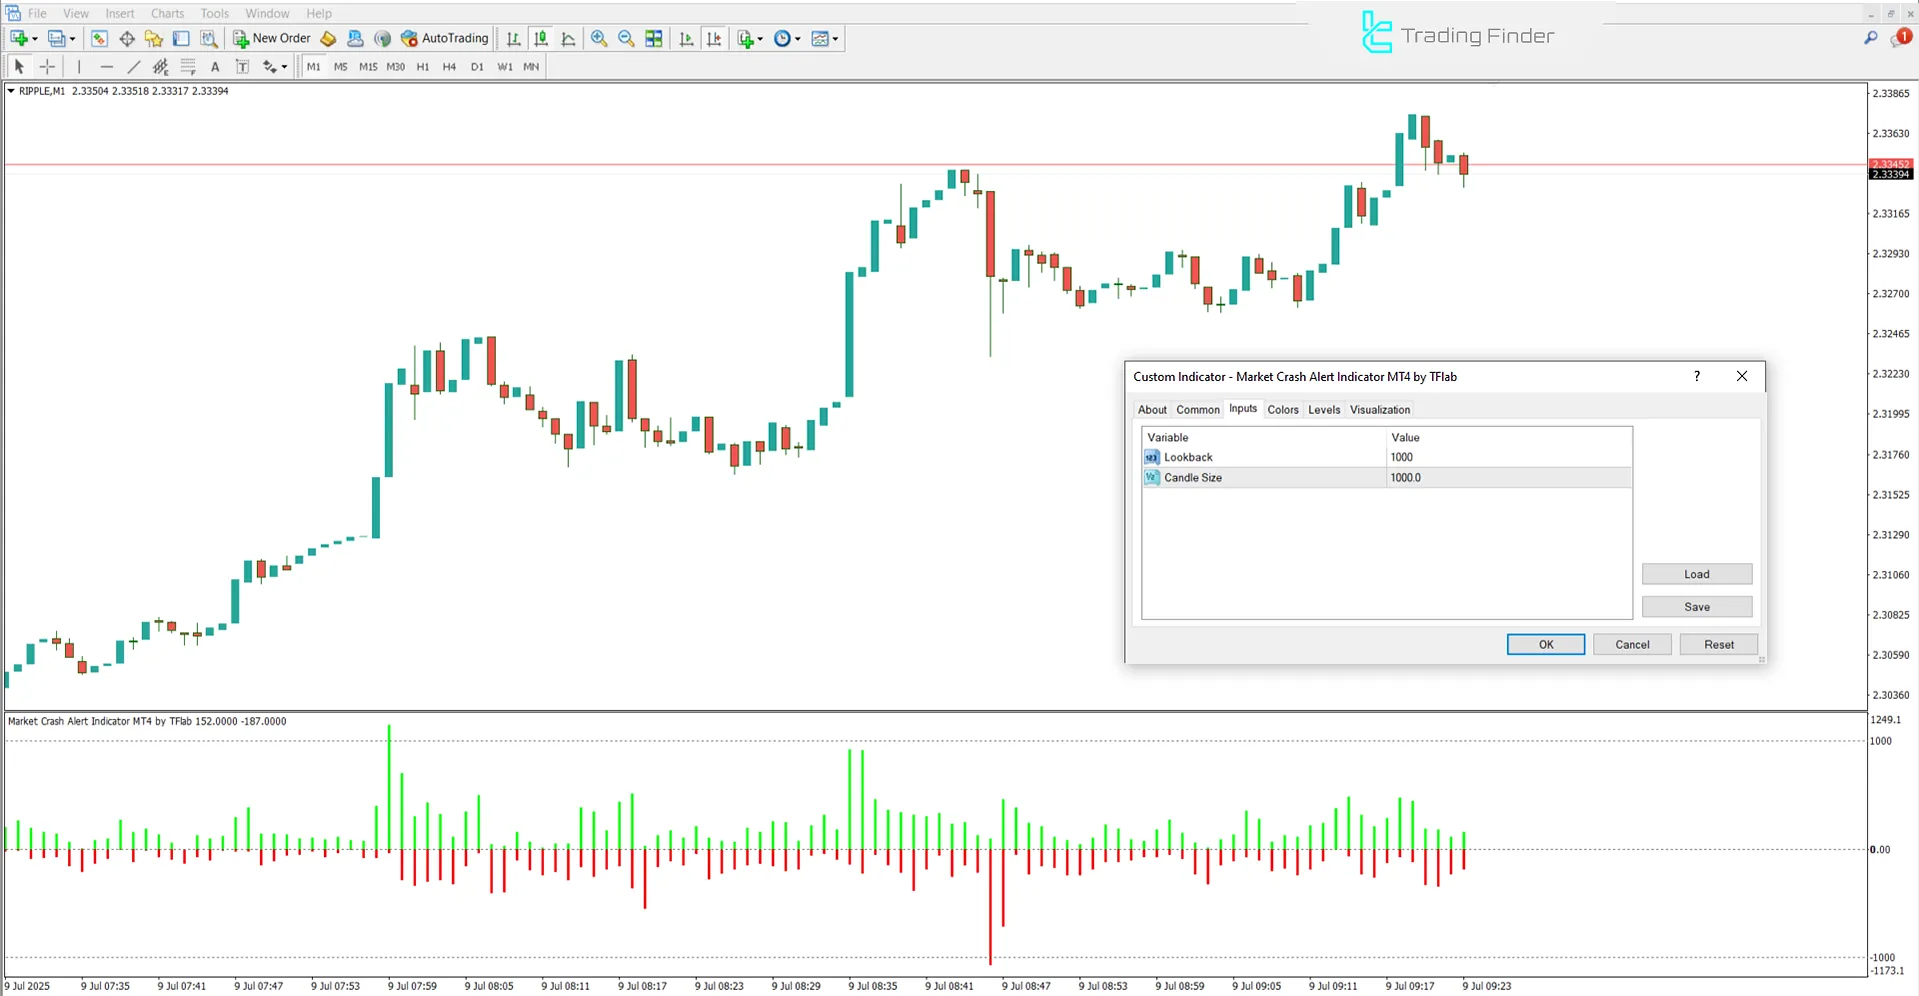
The image below shows the customizable settings panel of the Market Crash Alert Oscillator:

- Lookback: Historical reference window;
- Candle Size: Candlestick size measurement.
Conclusion
The Market Crash Alert Oscillator is a powerful technical analysis tool for examining real-time market fluctuations, focusing on identifying candlestick strength by comparing the frequency of green and red bars.
Not only does the indicator display the price direction, but it also conveys the intensity and quality of movements using the 1000+ and 1000- levels.
Market Crash Alert MT4 PDF
Market Crash Alert MT4 PDF
Click to download Market Crash Alert MT4 PDFWhat parameter does the Market Crash Alert Indicator measure?
This indicator measures the strength of candlestick fluctuations by evaluating the difference between bullish and bearish candles. Its output is a visual representation of relative buy and sell power as colored bars in the oscillator window.
What’s the difference between the green and red bars in the Market Crash Alert Indicator?
In this trading tool, the green bar represents bullish strength, while the red bar indicates bearish strength. The relative dominance of one bar over the other reveals the likely market direction.


