![Money Flow Index Levels Indicator for MT4 Download - Free - [TradingFinder]](https://cdn.tradingfinder.com/image/318896/13-94-en-mfi-levels-mt4-01.webp)
![Money Flow Index Levels Indicator for MT4 Download - Free - [TradingFinder] 0](https://cdn.tradingfinder.com/image/318896/13-94-en-mfi-levels-mt4-01.webp)
![Money Flow Index Levels Indicator for MT4 Download - Free - [TradingFinder] 1](https://cdn.tradingfinder.com/image/318895/13-94-en-mfi-levels-mt4-02.webp)
![Money Flow Index Levels Indicator for MT4 Download - Free - [TradingFinder] 2](https://cdn.tradingfinder.com/image/318898/13-94-en-mfi-levels-mt4-03.webp)
![Money Flow Index Levels Indicator for MT4 Download - Free - [TradingFinder] 3](https://cdn.tradingfinder.com/image/318897/13-94-en-mfi-levels-mt4-04.webp)
The MFI Levels Indicator is designed to display key price reaction levels in the Forex market. This indicator, built for MetaTrader 4, draws 3 support levels and 3 resistance levels based on the Money Flow Index (MFI).
The MFI Levels Indicator includes one main level, which by default is updated every four hours, along with six additional levels.
Specification Table of the MFI Levels Indicator
The specifications for the MFI Levels Indicator are shown in the table below:
|
Indicator Categories:
|
Pivot Points & Fractals MT4 Indicators
Support & Resistance MT4 Indicators
Levels MT4 Indicators
|
|
Platforms:
|
MetaTrader 4 Indicators
|
|
Trading Skills:
|
Intermediate
|
|
Indicator Types:
|
Breakout MT4 Indicators
Reversal MT4 Indicators
|
|
Timeframe:
|
Multi-Timeframe MT4 Indicators
|
|
Trading Style:
|
Day Trading MT4 Indicators
Fast Scalper MT4 Indicators
Scalper MT4 Indicators
|
|
Trading Instruments:
|
Forward Market MT4 Indicators
Stock Market MT4 Indicators
Cryptocurrency MT4 Indicators
Forex MT4 Indicators
|
Bullish Trend Conditions
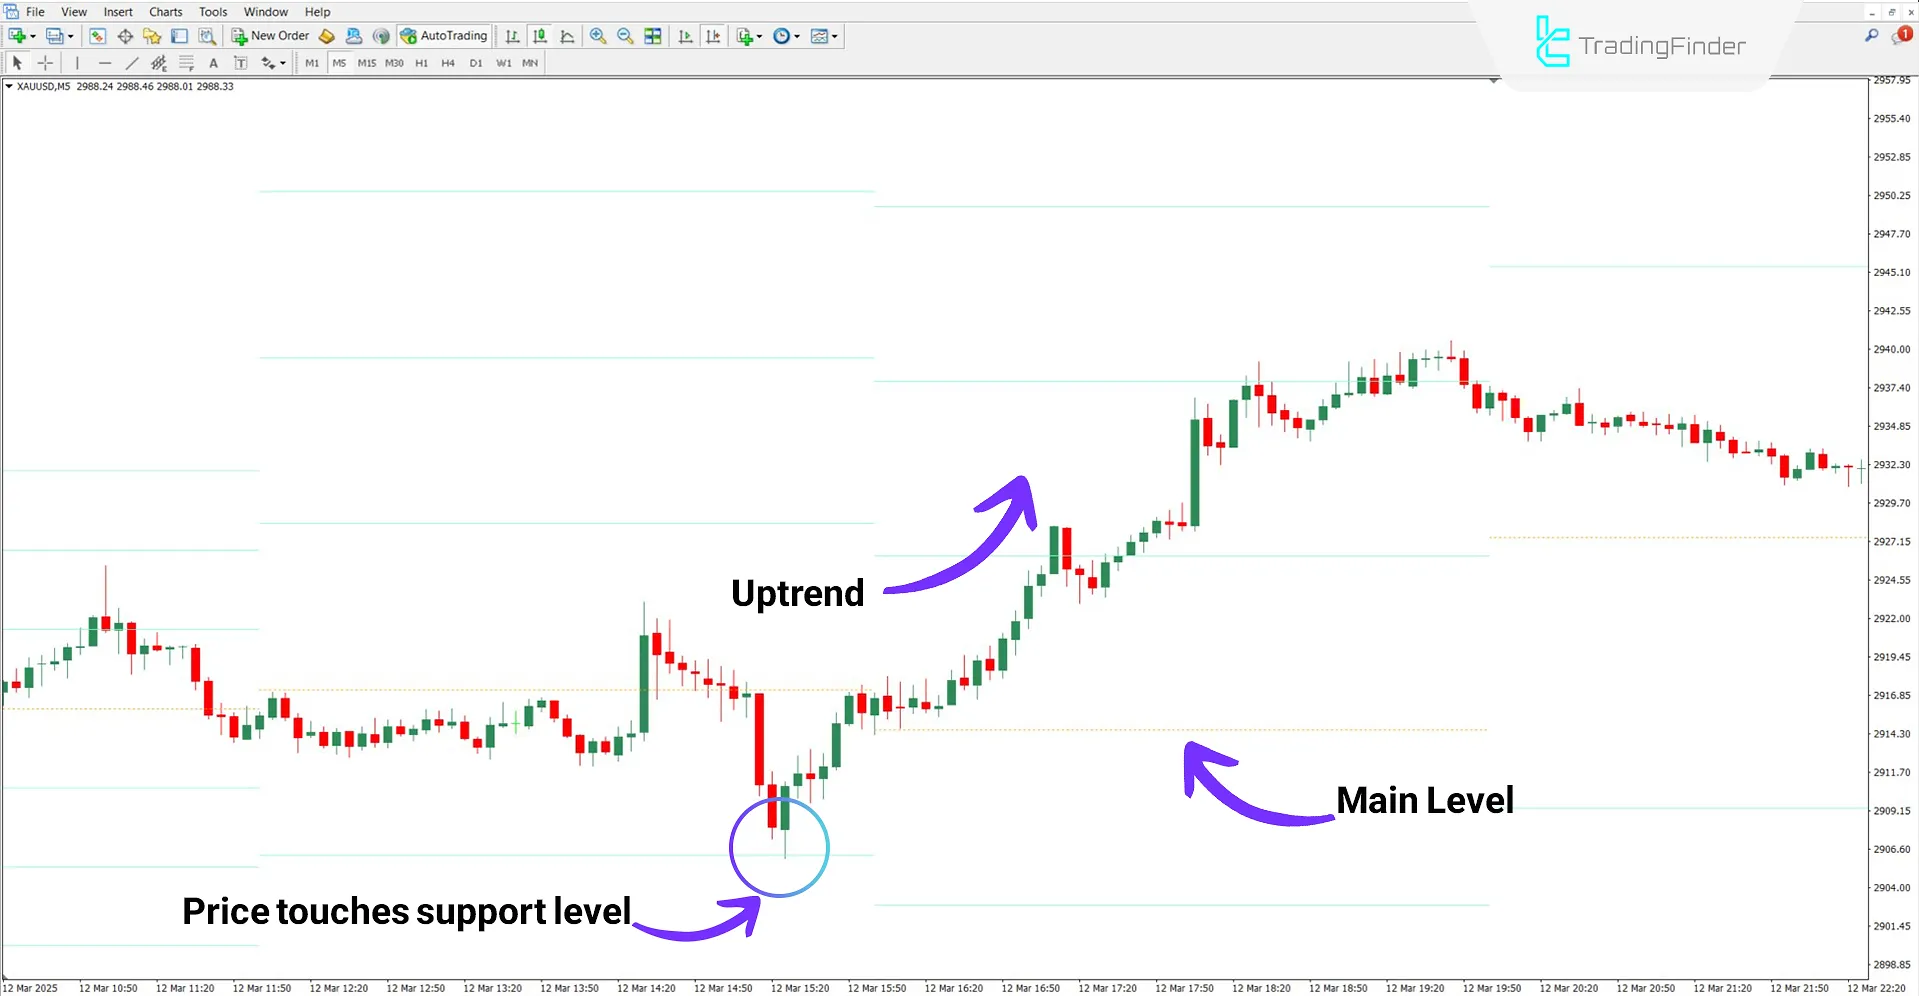
The XAU/USD 5-minute chart, the price touches the support level and rises. As shown in the image, the bullish move successfully breaks through resistance levels, indicating buying pressure and the strength of the uptrend.

Bearish Trend Conditions
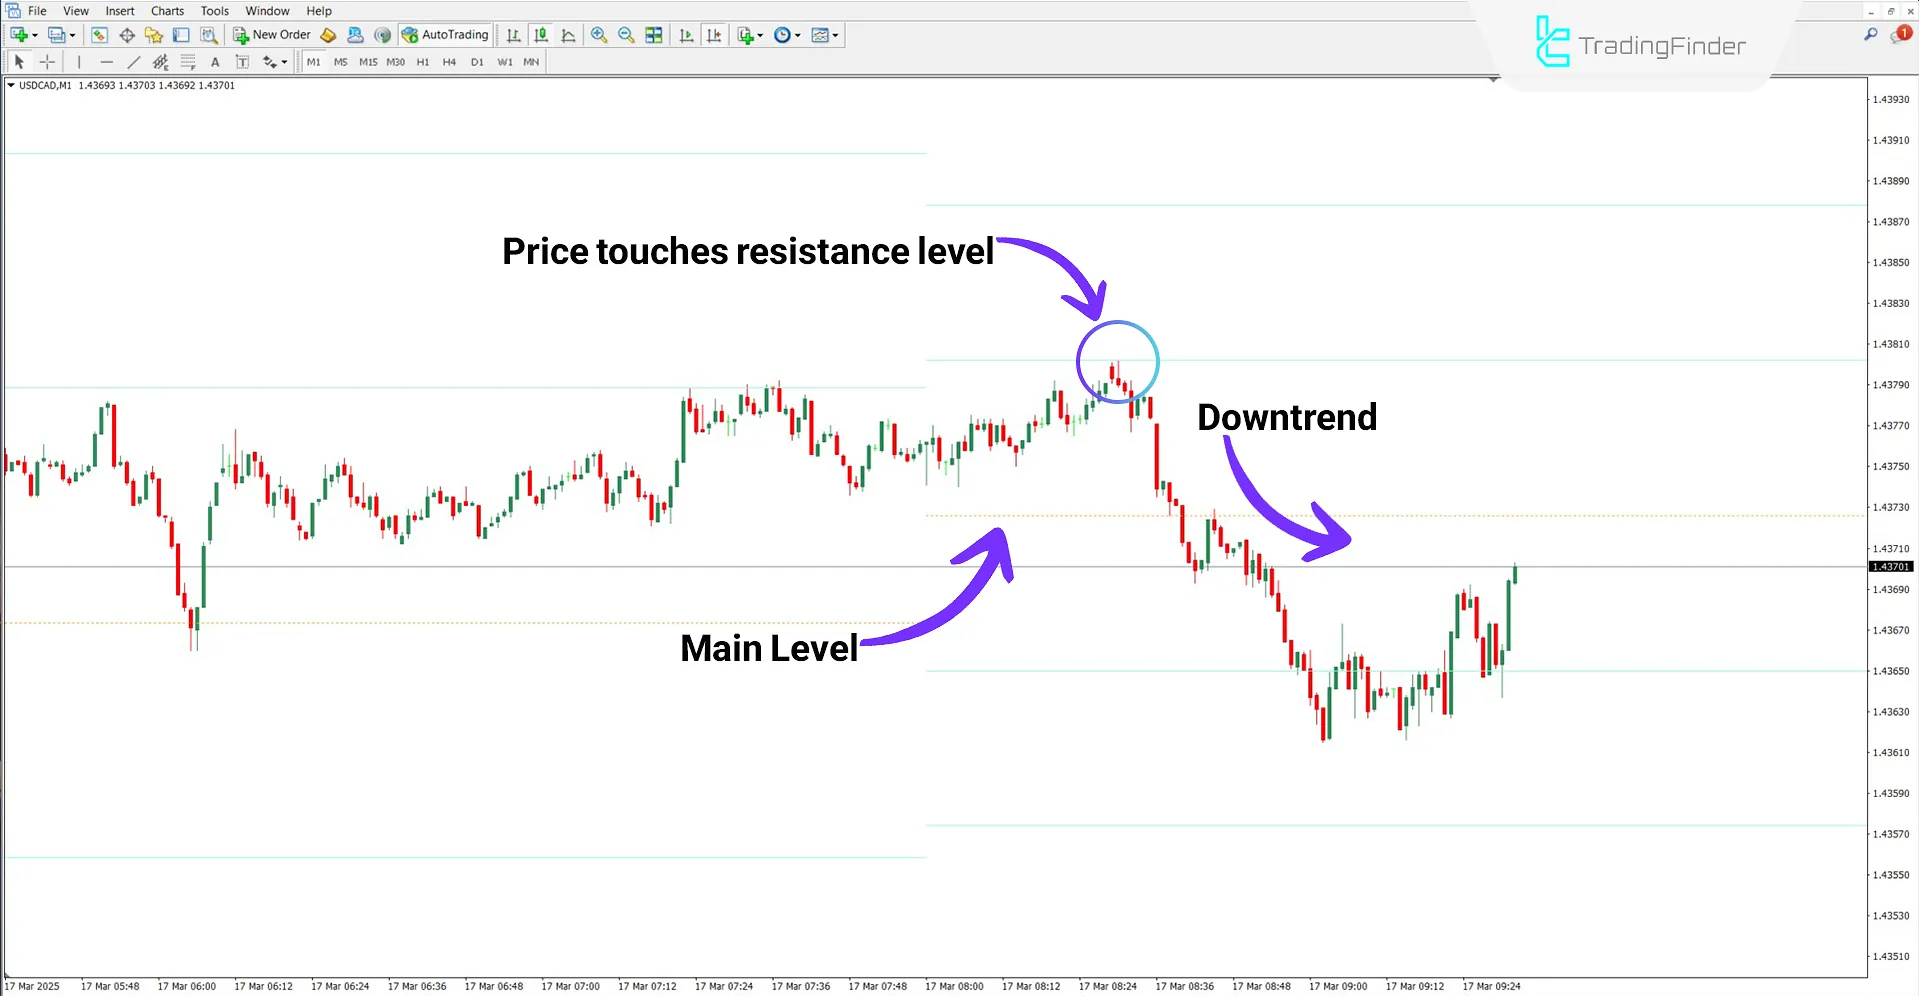
The USD/CAD 1-minute chart analysis demonstrates how the MFI Levels Indicator operates in a downtrend.
As seen in the image, the highlighted line acts as a resistance level, and the price drops immediately after touching it.

MFI Levels Indicator Settings
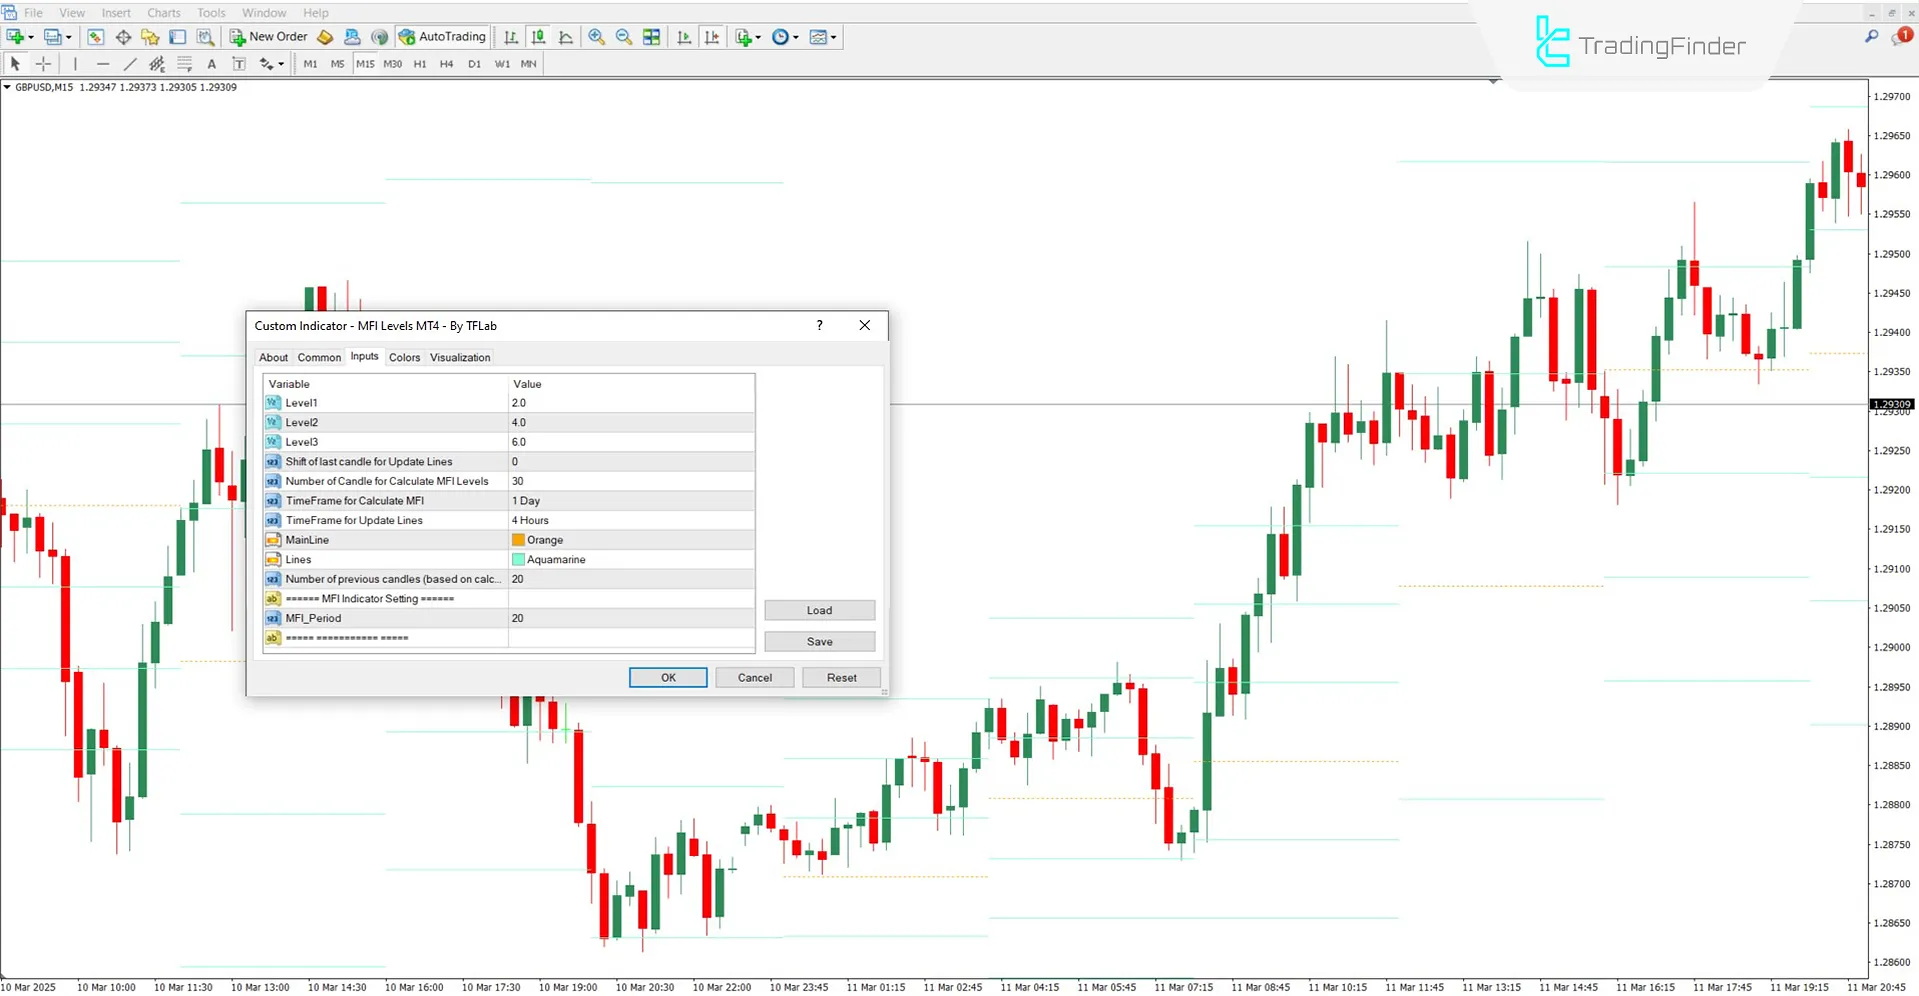
The image below shows the customizable settings of the MFI Levels Indicator:

- Level1: First level calculation
- Level2: Second level calculation
- Level3: Third level calculation
- Shift of last candle for Update Lines: Number of recent candles to skip during level updates
- Number of Candles for Calculate MFI Levels: Number of candles used to calculate levels
- Time Frame for Calculate MFI: The main timeframe used for MFI calculation
- Time Frame for Update Lines: Time interval for updating levels
- Main Line: Color of the main level line
- Lines: Color of the three support and resistance lines
- Number of previous candles (based on calculation): Number of previous candles used for background calculations
- MFI Period: Period value used for MFI calculation
Conclusion
The MFI Levels Indicator is one of the key tools in technical analysis, designed to create price reaction levels on the chart.
As a MT4 pivot points indicator, it calculates and draws support and resistance lines based on the Money Flow Index.
One key feature of the MFI Levels Indicator is the ability to set a custom timeframe for level updates.
Does the MFI Levels Indicator generate trading signals?
No, this indicator does not generate any trading signals.
Can the MFI Levels Indicator be used in stock markets?
Yes, the indicator can be used in all markets without any restrictions.