![QQE indicator for MT4 Download - Free - [TradingFinder]](https://cdn.tradingfinder.com/image/117486/13-11-en-qqe-mt4-1.webp)
![QQE indicator for MT4 Download - Free - [TradingFinder] 0](https://cdn.tradingfinder.com/image/117486/13-11-en-qqe-mt4-1.webp)
![QQE indicator for MT4 Download - Free - [TradingFinder] 1](https://cdn.tradingfinder.com/image/117499/13-11-en-qqe-mt4-2.webp)
![QQE indicator for MT4 Download - Free - [TradingFinder] 2](https://cdn.tradingfinder.com/image/117497/13-11-en-qqe-mt4-3.webp)
![QQE indicator for MT4 Download - Free - [TradingFinder] 3](https://cdn.tradingfinder.com/image/117498/13-11-en-qqe-mt4-4.webp)
The Quantitative and Qualitative Estimation (QQE) indicator efficiently identifies trends and trading signals. This MT4 signal forecast indicator, combines Quantitative and Qualitative analyses with smoothing techniques to reduce false signals and improve signal accuracy.
This trading tool is designed based on the Relative Strength Index (RSI) and presented through a smoothing method as two main lines.
Indicator Specifications Table
Indicator Categories: | Oscillators MT4 Indicators Signal & Forecast MT4 Indicators Currency Strength MT4 Indicators |
Platforms: | MetaTrader 4 Indicators |
Trading Skills: | Intermediate |
Indicator Types: | Reversal MT4 Indicators |
Timeframe: | Multi-Timeframe MT4 Indicators |
Trading Style: | Day Trading MT4 Indicators |
Trading Instruments: | Share Stocks MT4 Indicators Forward Market MT4 Indicators Indices Market MT4 Indicators Commodity Market MT4 Indicators Stock Market MT4 Indicators Cryptocurrency MT4 Indicators Forex MT4 Indicators |
Overview of the Indicator
One of the important features of the QQE indicator is the calculation of divergence. In this indicator, divergence is divided into two types bullish divergence and bearish divergence.
A bullish divergence occurs when the QQE line registers lower lows, but the price forms higher lows. Conversely, a bearish divergence occurs when the QQE line registers lower highs, but the price forms higher highs.
Uptrend Conditions
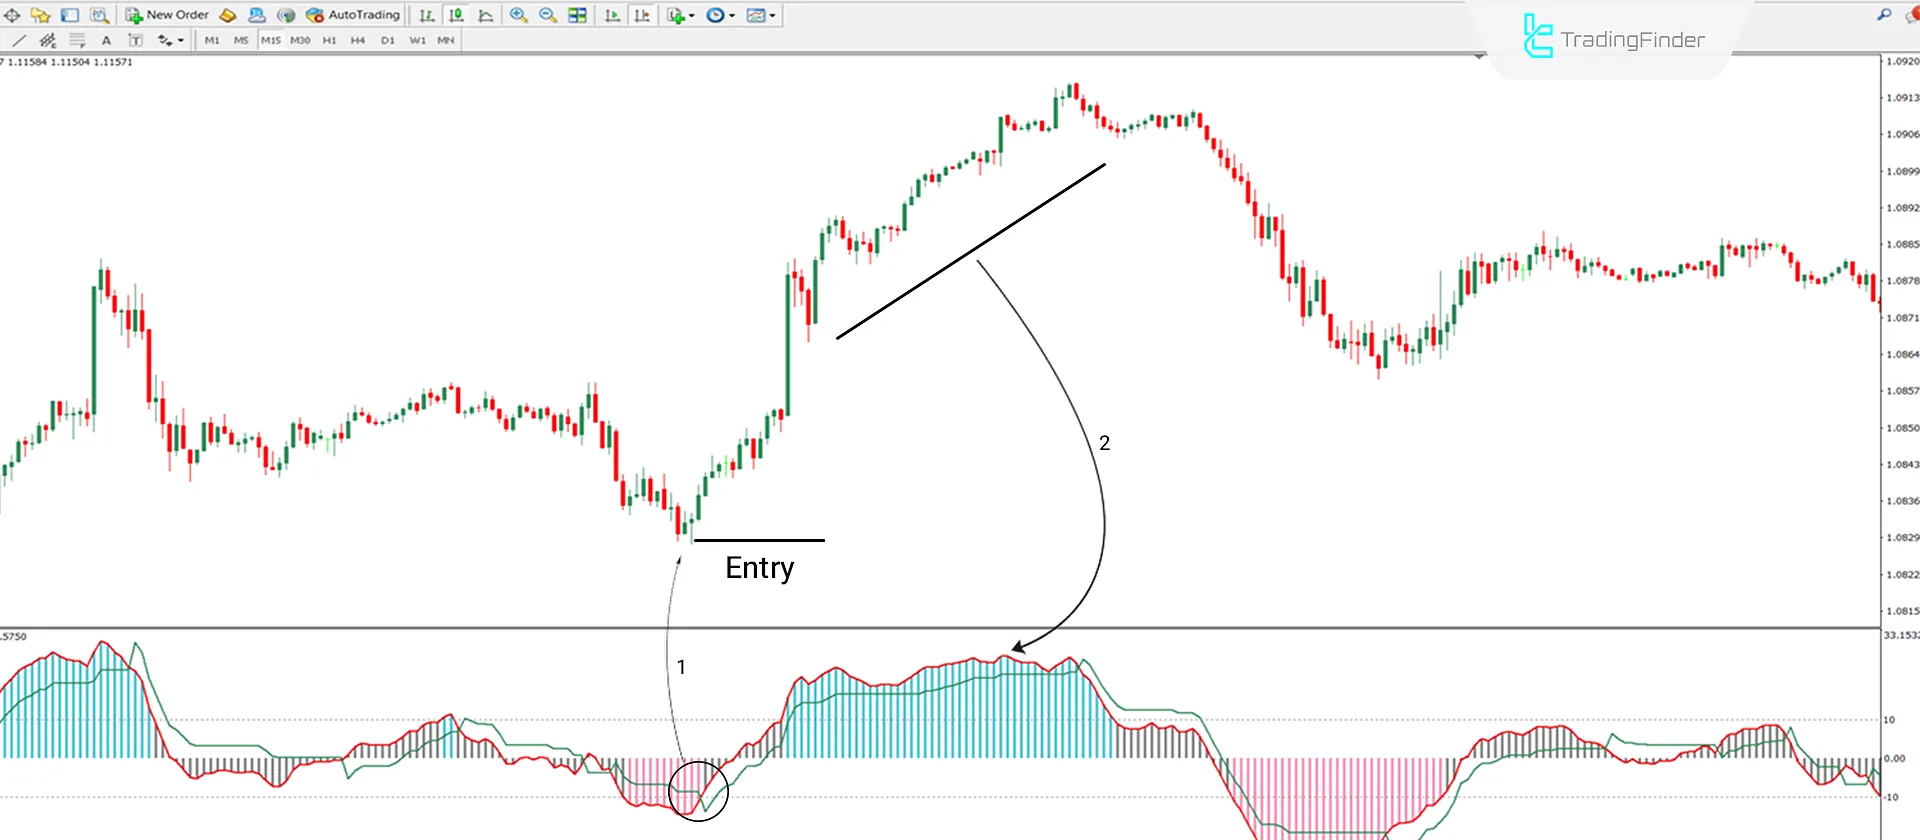
The 15-minute price chart of the EUR/USD currency pair shows how the QQE indicator performs under uptrend conditions. As shown in the image with arrow number 1, the Fast QQE line (red) crosses above the Slow QQE line (green) and moves above the zero line.
This point can indicate a shift in market sentiment from selling to buying and could be a suitable entry point. Based on arrow number 2, both QQE lines are above 50%, indicating buyer strength and no negative divergence is observed.

Downtrend Conditions
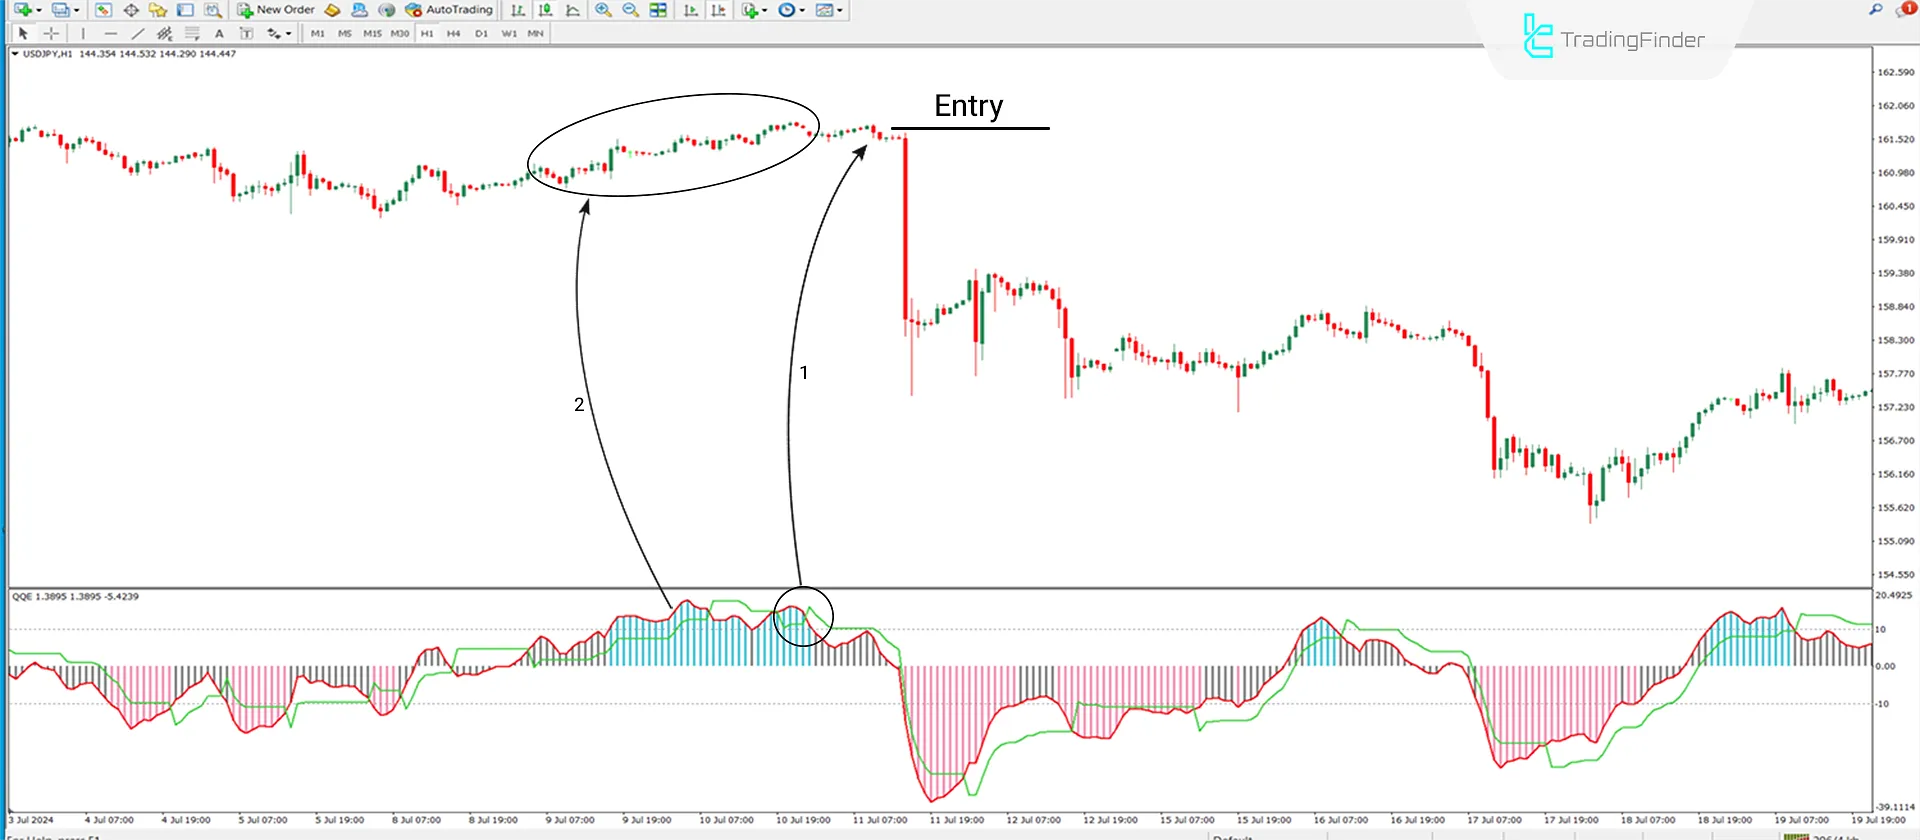
The 1-hour price chart of the USD/JPY currency pair shows how the indicator performs under downtrend conditions. As shown by arrow number 1, the Fast QQE line (red) crosses below the Slow QQE line (green) and moves towards the zero line.
This crossover could be a suitable point to open a short position. Based on arrow number 2, a negative divergence is seen before the sharp market decline.

Settings

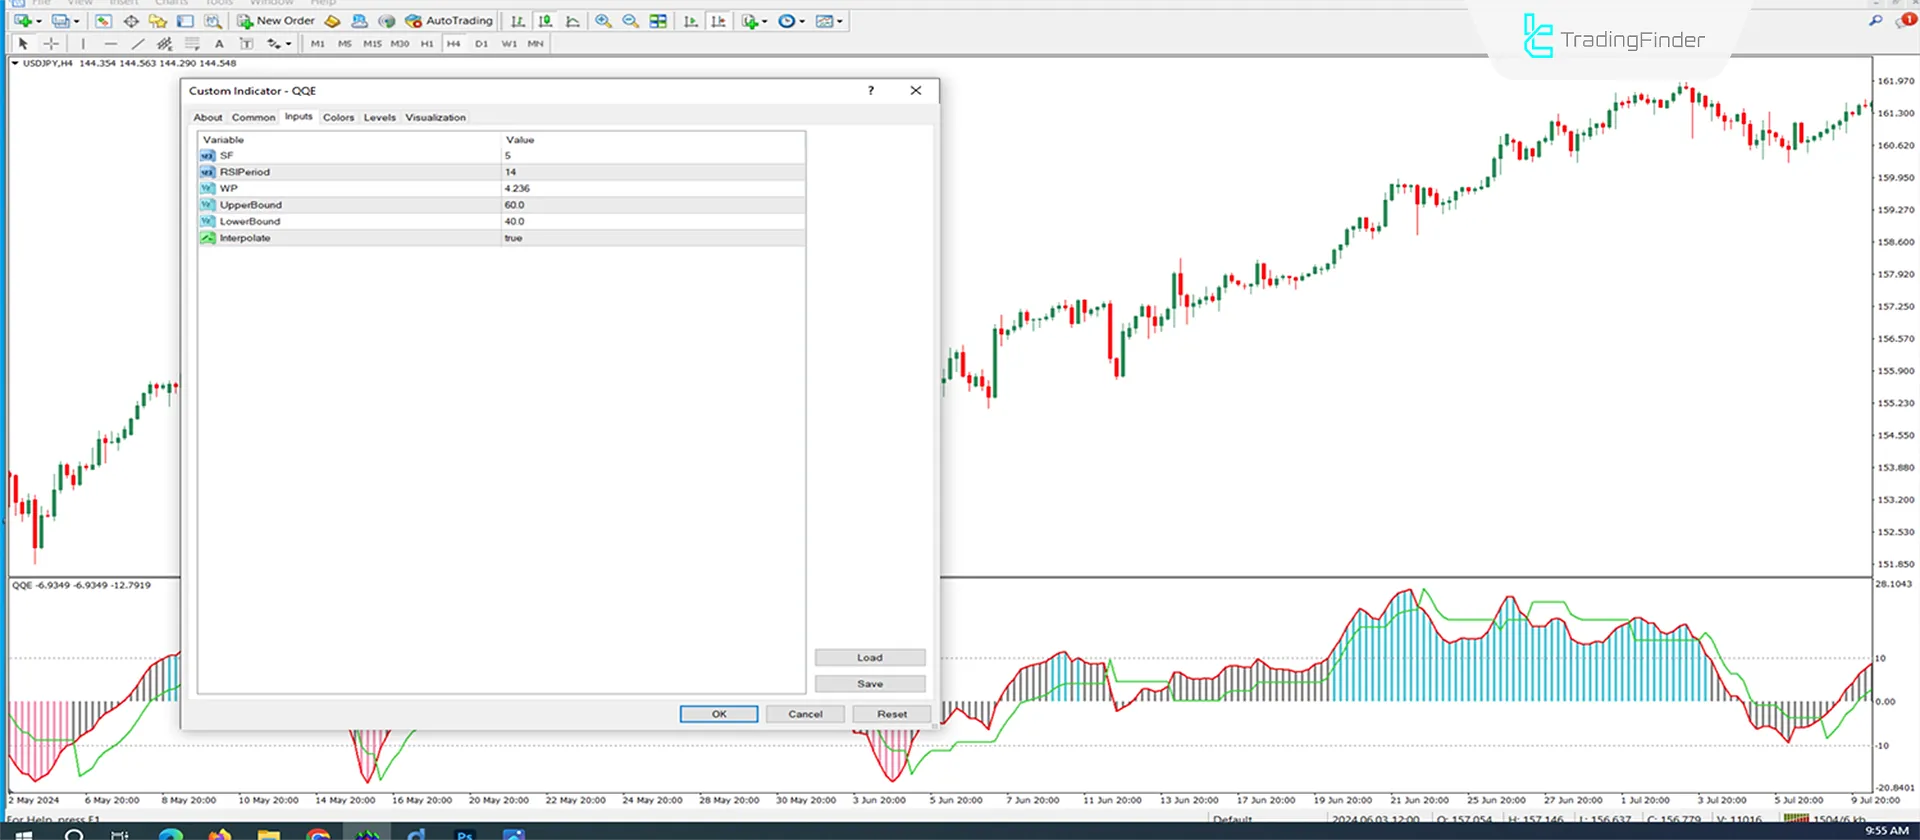
- SF: This section is related to smoothing settings when calculating the QQE lines.
- RSI Period: This section calculates the Relative Strength Index (RSI).
- WP: Settings related to the Exponential Moving Average (EMA) period are used to smooth the RSI.
- Upper Bound: Settings for the upper zero bound are used to identify overbought conditions.
- Lower Bound: Settings for the lower zero bound are used to identify oversold conditions.
- Interpolate: Settings related to calculating and displaying the indicator's data on the chart.
Conclusion
The Quantitative and Qualitative Estimation (QQE) indicator is a powerful tool in MetaTrader 4. With flexible settings, it can be effectively incorporated into trading strategies. Moreover, This MT4 oscillator, combining the Relative Strength Index (RSI) and smoothing techniques, allows traders to make more accurate analyses and better trading decisions.
QQE indicator MT4 PDF
QQE indicator MT4 PDF
Click to download QQE indicator MT4 PDFWhat skill level is required to use the QQE indicator?
Due to its complexity, the QQE indicator requires a basic understanding of technical analysis.
What is the function of the zero line in this indicator?
The zero line acts as the midpoint. The area above the zero line is used to identify overbought conditions, while the below is used to identify oversold conditions.


