![Renko Chart indicator for MT4 Download - Free - [TradingFinder]](https://cdn.tradingfinder.com/image/120103/13-9-en-renko-mt4-1.webp)
![Renko Chart indicator for MT4 Download - Free - [TradingFinder] 0](https://cdn.tradingfinder.com/image/120103/13-9-en-renko-mt4-1.webp)
![Renko Chart indicator for MT4 Download - Free - [TradingFinder] 1](https://cdn.tradingfinder.com/image/120114/13-9-en-renko-mt4-2.webp)
![Renko Chart indicator for MT4 Download - Free - [TradingFinder] 2](https://cdn.tradingfinder.com/image/120120/13-9-en-renko-mt4-3.webp)
![Renko Chart indicator for MT4 Download - Free - [TradingFinder] 3](https://cdn.tradingfinder.com/image/120117/13-9-en-renko-mt4-4.webp)
The Renko Brick Chart indicator in MetaTrader 4 displays a chart composed of bricks, each representing specific price movements independent of the price chart.
This oscillator filters out noise and gives traders a clear trend at a 45-degree angle. A new brick is formed whenever the price moves by a predetermined amount. Red bricks indicate a downward trend, while blue bricks indicate an upward trend.
Indicator Specifications Table
Indicator Categories: | Oscillators MT4 Indicators Support & Resistance MT4 Indicators Levels MT4 Indicators |
Platforms: | MetaTrader 4 Indicators |
Trading Skills: | Elementary |
Indicator Types: | Reversal MT4 Indicators |
Timeframe: | M1-M5 Time MT4 Indicators H4-H1 Time MT4 Indicators |
Trading Style: | Day Trading MT4 Indicators |
Trading Instruments: | Share Stocks MT4 Indicators Forward Market MT4 Indicators Indices Market MT4 Indicators Commodity Market MT4 Indicators Stock Market MT4 Indicators Cryptocurrency MT4 Indicators Forex MT4 Indicators |
Overview of the Renko Indicator
The Renko chart removes the time factor and displays Support and Resistance levels that may be difficult to identify in candlestick and bar charts. This trading tool extracts price data and produces Renko bricks.
Uptrend Conditions
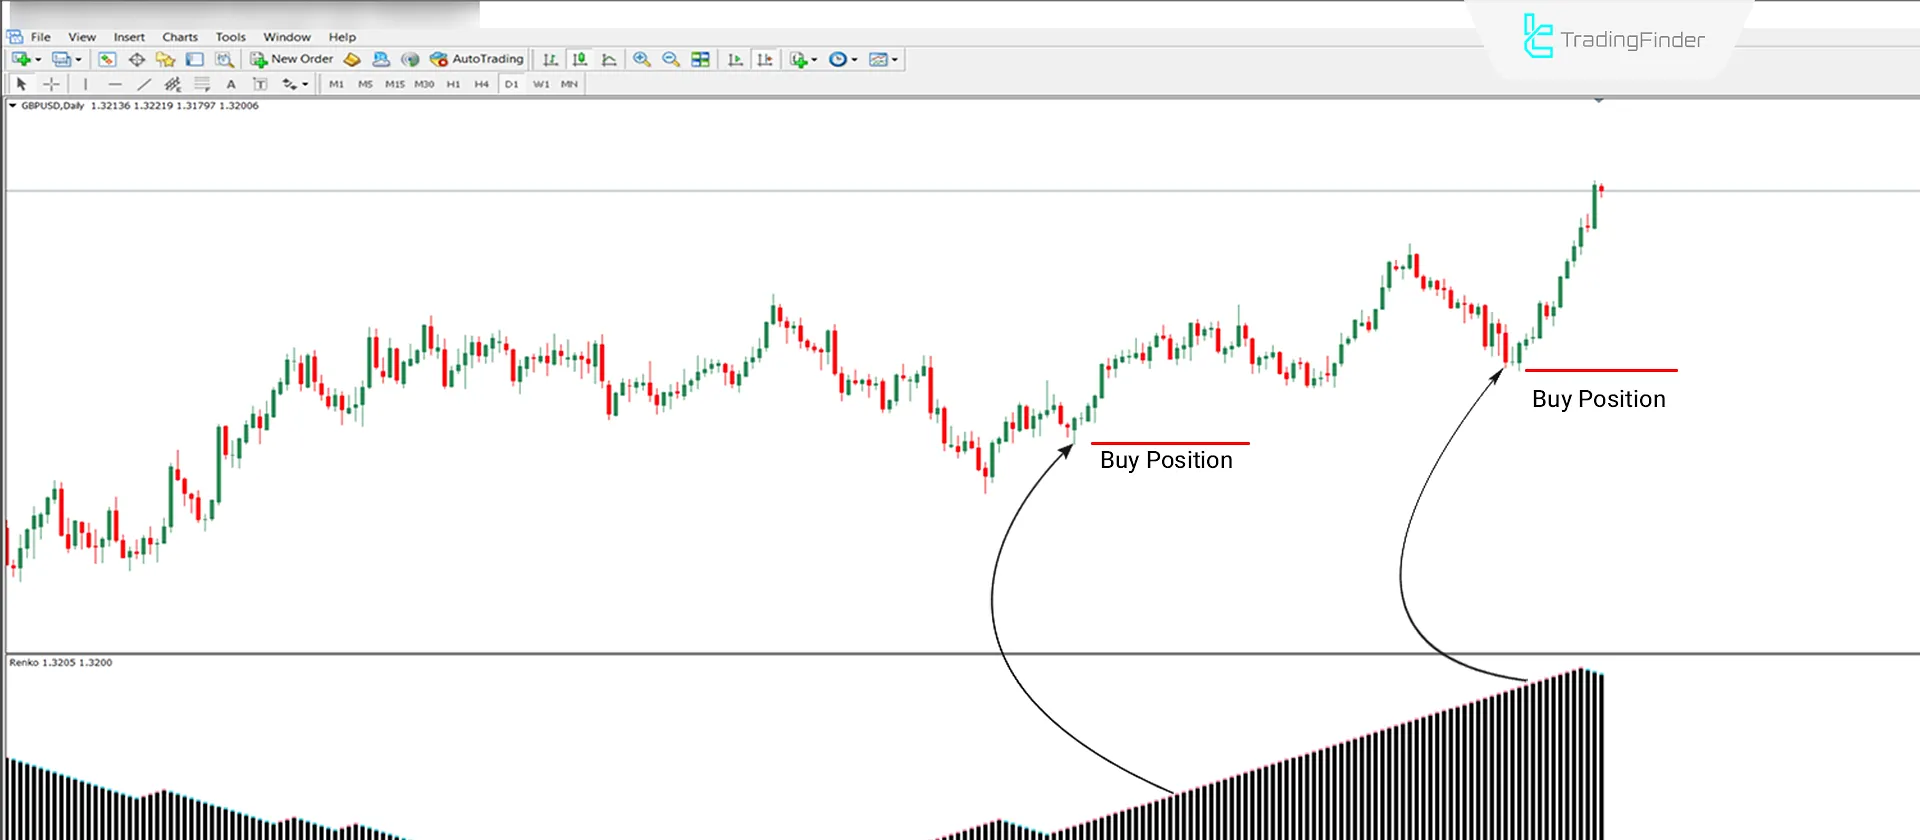
The 1-day price chart of the GBP/USD currency pair shows the uptrend conditions in the Renko Brick Chart indicator. A new brick is added to the chart each time the price increases or decreases by a predetermined amount. In an uptrend, the consecutive formation of red bricks above the previous brick indicates the continuation of the uptrend.

Downtrend Conditions
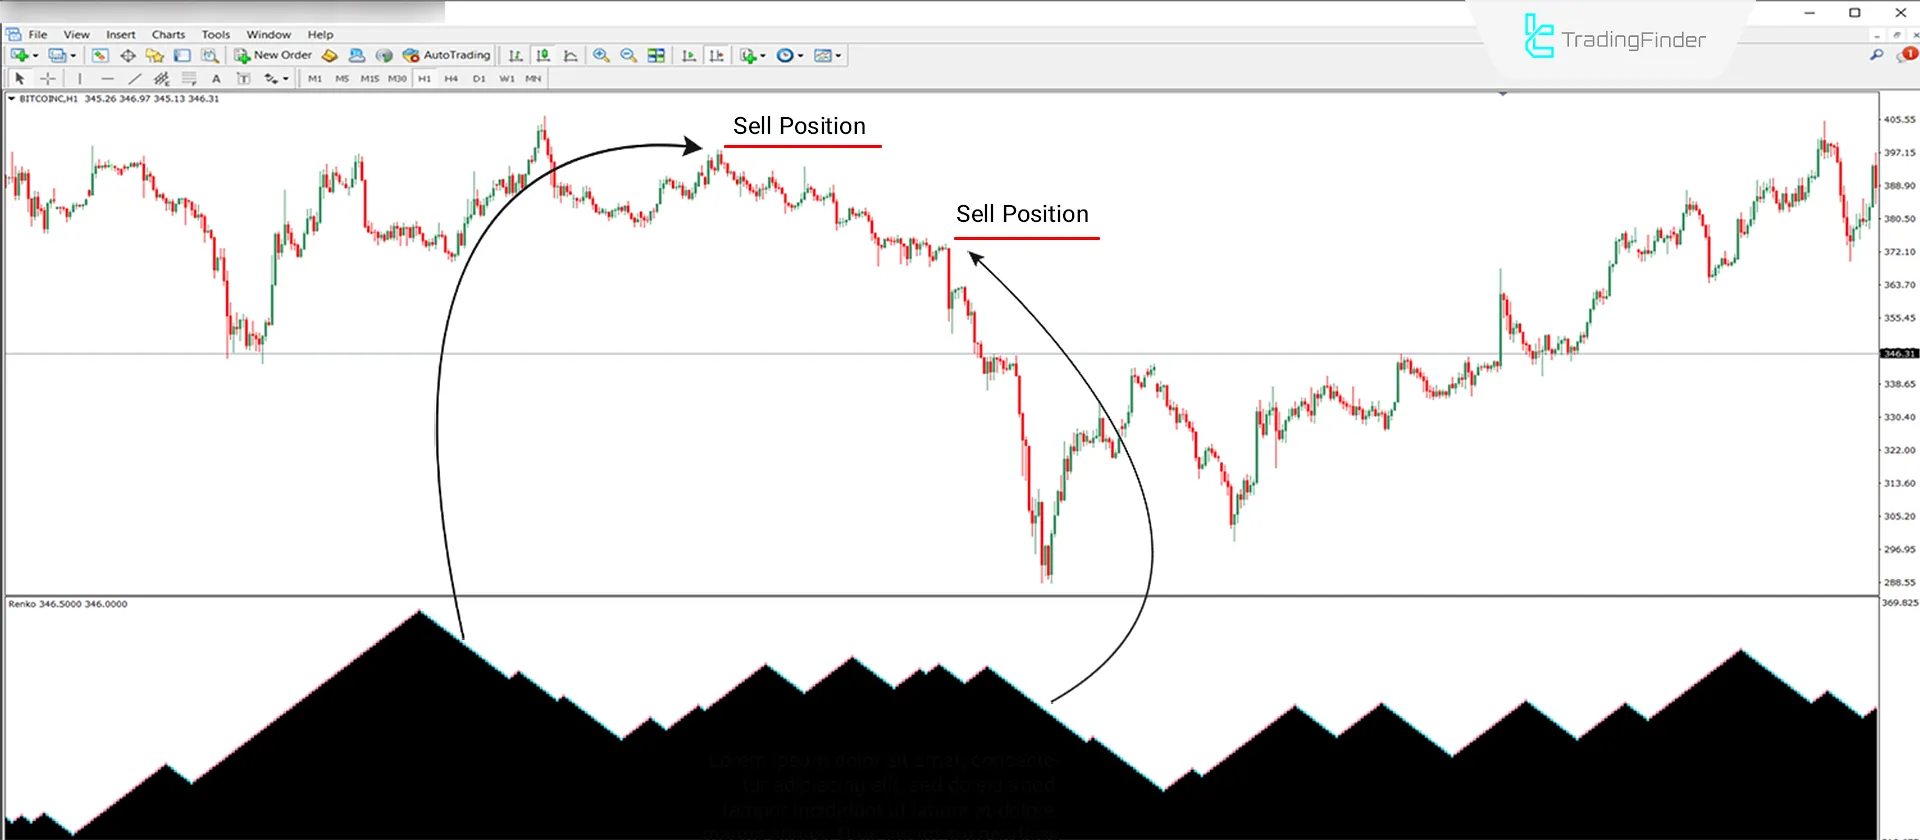
The one-hour price chart of Bitcoin (BTC) shows how the Renko Brick Chart indicator performs in downtrend conditions. A consecutive formation of downward bricks indicates selling pressure. In a downtrend, each brick is formed below the previous one.

Settings

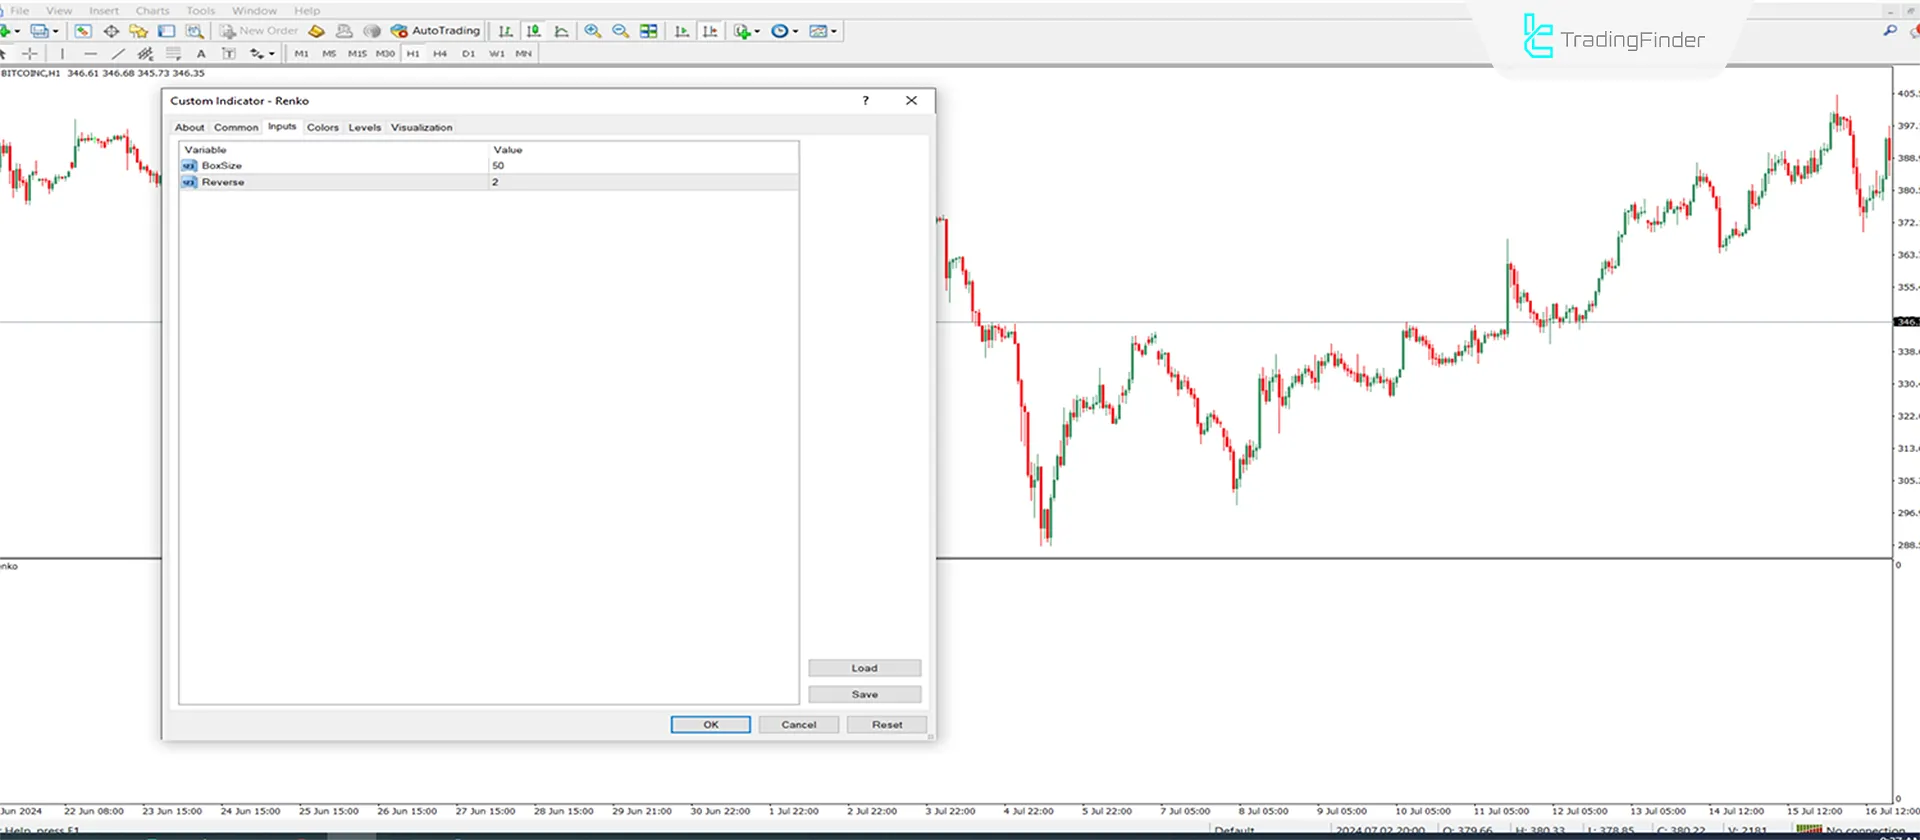
- Box Size: Settings for calculating brick size;
- Reverse: Settings for the number of bricks.
Conclusion
The Renko Brick Chart indicator analyzes actual price changes and removes the time factor, providing traders with a noise-free chart. The unique structure of the bricks allows traders to identify the main trends and accurately determine Entry and Exit points.
This trading tool is also suitable for use in various markets, including cryptocurrencies, forex, stocks, and commodities.
Renko Chart indicator MT4 PDF
Renko Chart indicator MT4 PDF
Click to download Renko Chart indicator MT4 PDFWhat parameter does the Renko Brick Chart indicator use to form bricks?
Unlike traditional charts, such as bars and candlesticks, which are time-based, Renko brick charts are based on a predetermined number of pips (Pip).
Can the pip value be edited?
Yes, you can edit the pip value and adjust the price movement by entering the "Box Size" section in the settings.


