![RSI Levels Indicator for MetaTrader 4 Download – Free – [TradingFinder]](https://cdn.tradingfinder.com/image/316959/11-76-en-rsi-levels-mt4-01.webp)
![RSI Levels Indicator for MetaTrader 4 Download – Free – [TradingFinder] 0](https://cdn.tradingfinder.com/image/316959/11-76-en-rsi-levels-mt4-01.webp)
![RSI Levels Indicator for MetaTrader 4 Download – Free – [TradingFinder] 1](https://cdn.tradingfinder.com/image/316946/11-76-en-rsi-levels-mt4-02.webp)
![RSI Levels Indicator for MetaTrader 4 Download – Free – [TradingFinder] 2](https://cdn.tradingfinder.com/image/316956/11-76-en-rsi-levels-mt4-03.webp)
![RSI Levels Indicator for MetaTrader 4 Download – Free – [TradingFinder] 3](https://cdn.tradingfinder.com/image/316958/11-76-en-rsi-levels-mt4-04.webp)
The RSI Levels Indicator is one of the level and indicator tools for MetaTrader 4 that performs its calculations using the RSI algorithm.
This indicator enables traders to identify price reaction levels and conduct deeper technical analysis on charts. This feature provides a better understanding of market behavior and enhances trading strategies.
RSI Levels Indicator Table
Below are the general specifications of the RSI Levels Indicator:
Indicator Categories: | Price Action MT4 Indicators Volatility MT4 Indicators Levels MT4 Indicators RSI Indicators for MetaTrader 4 |
Platforms: | MetaTrader 4 Indicators |
Trading Skills: | Elementary |
Indicator Types: | Entry and Exit MT4 Indicators Reversal MT4 Indicators |
Timeframe: | Multi-Timeframe MT4 Indicators |
Trading Style: | Day Trading MT4 Indicators Intraday MT4 Indicators Scalper MT4 Indicators |
Trading Instruments: | Share Stocks MT4 Indicators Indices Market MT4 Indicators Stock Market MT4 Indicators Forex MT4 Indicators |
Uptrend
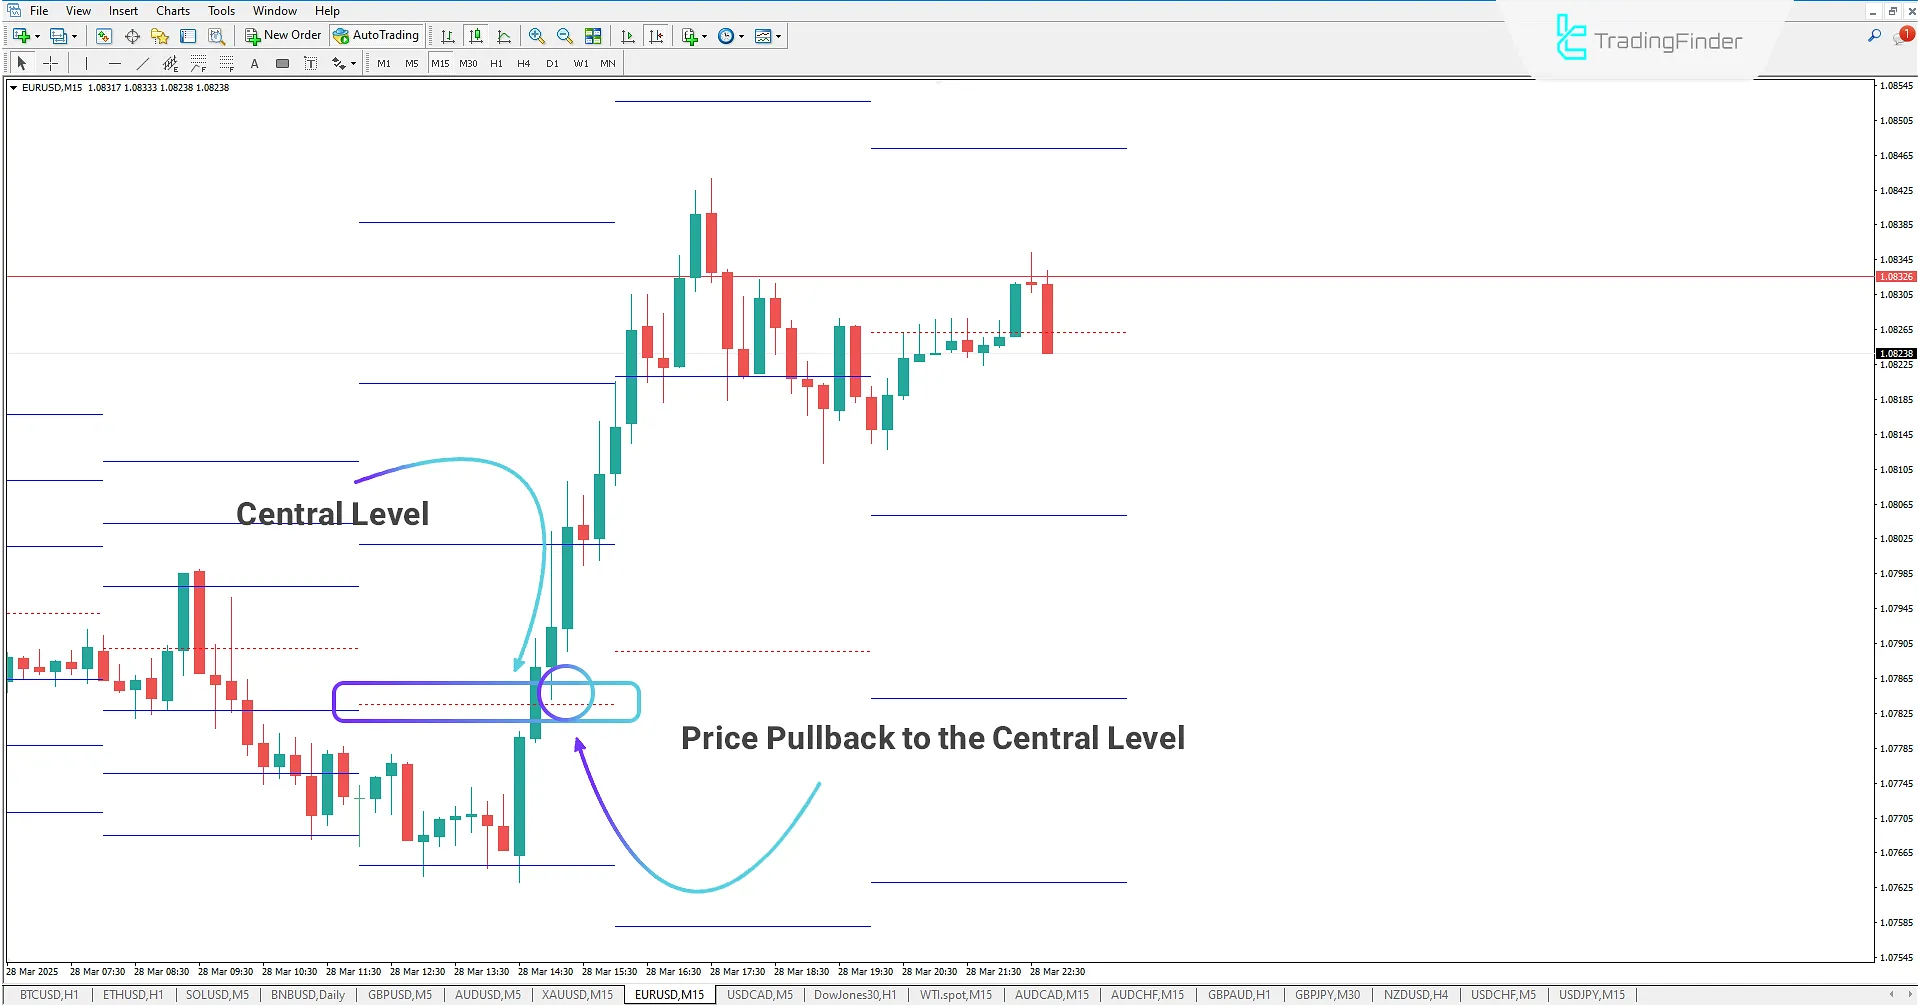
In the EUR/USD 15-minute chart, the RSI Levels Indicator highlights potential price reaction zones. After the central level is broken upward, the chart shows a bullish trend reversal. Here, the price retraces to the central level (a pullback) before resuming its uptrend.
Traders can enter buy positions upon price retracement and use the drawn levels as take-profit or stop-loss points, enhancing trade accuracy.

Downtrend
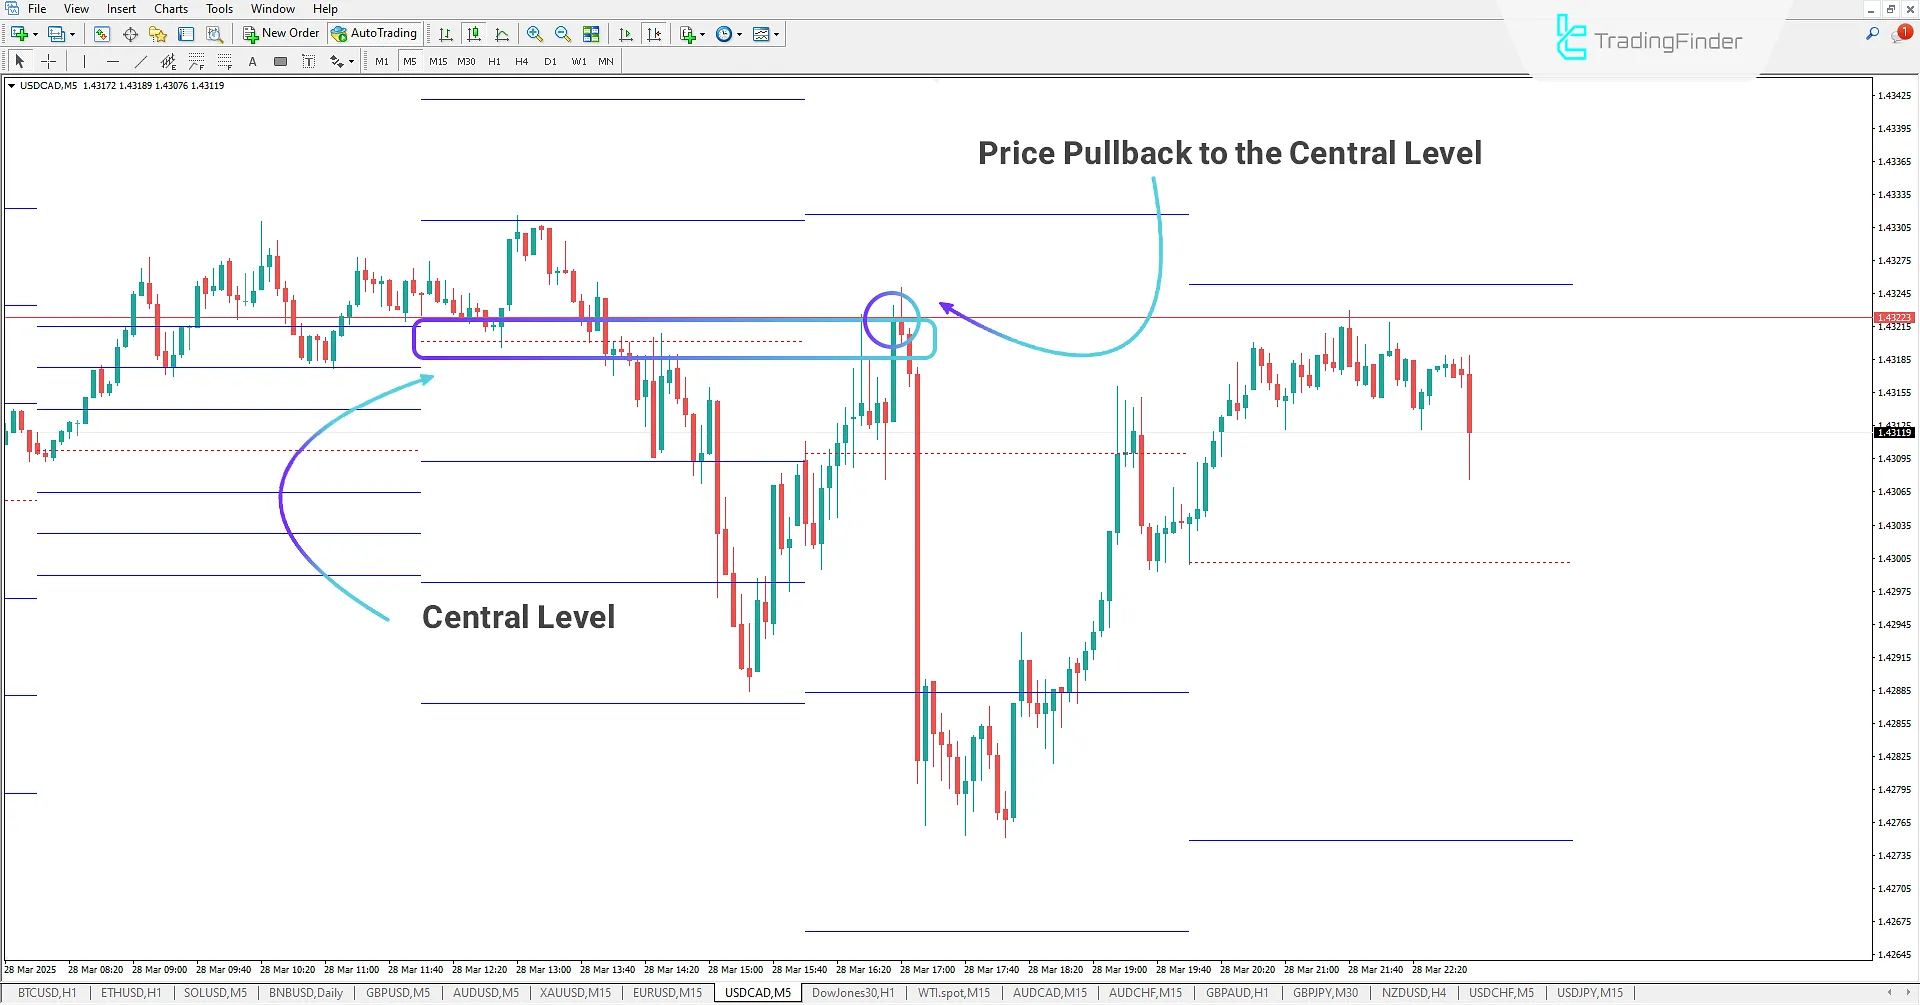
In the USD/CAD 5-minute chart, the price breaks the central level of the RSI Levels Indicator downward. After the breakout, the price retests the central level before continuing its downtrend. Traders can use these levels as potential reaction zones or support/resistance areas.
In this scenario, traders can enter sell positions and capitalize on the downward momentum, a strategy reinforced by these levels.

RSI Levels Indicator Settings
Below are the settings for the RSI Levels Indicator:

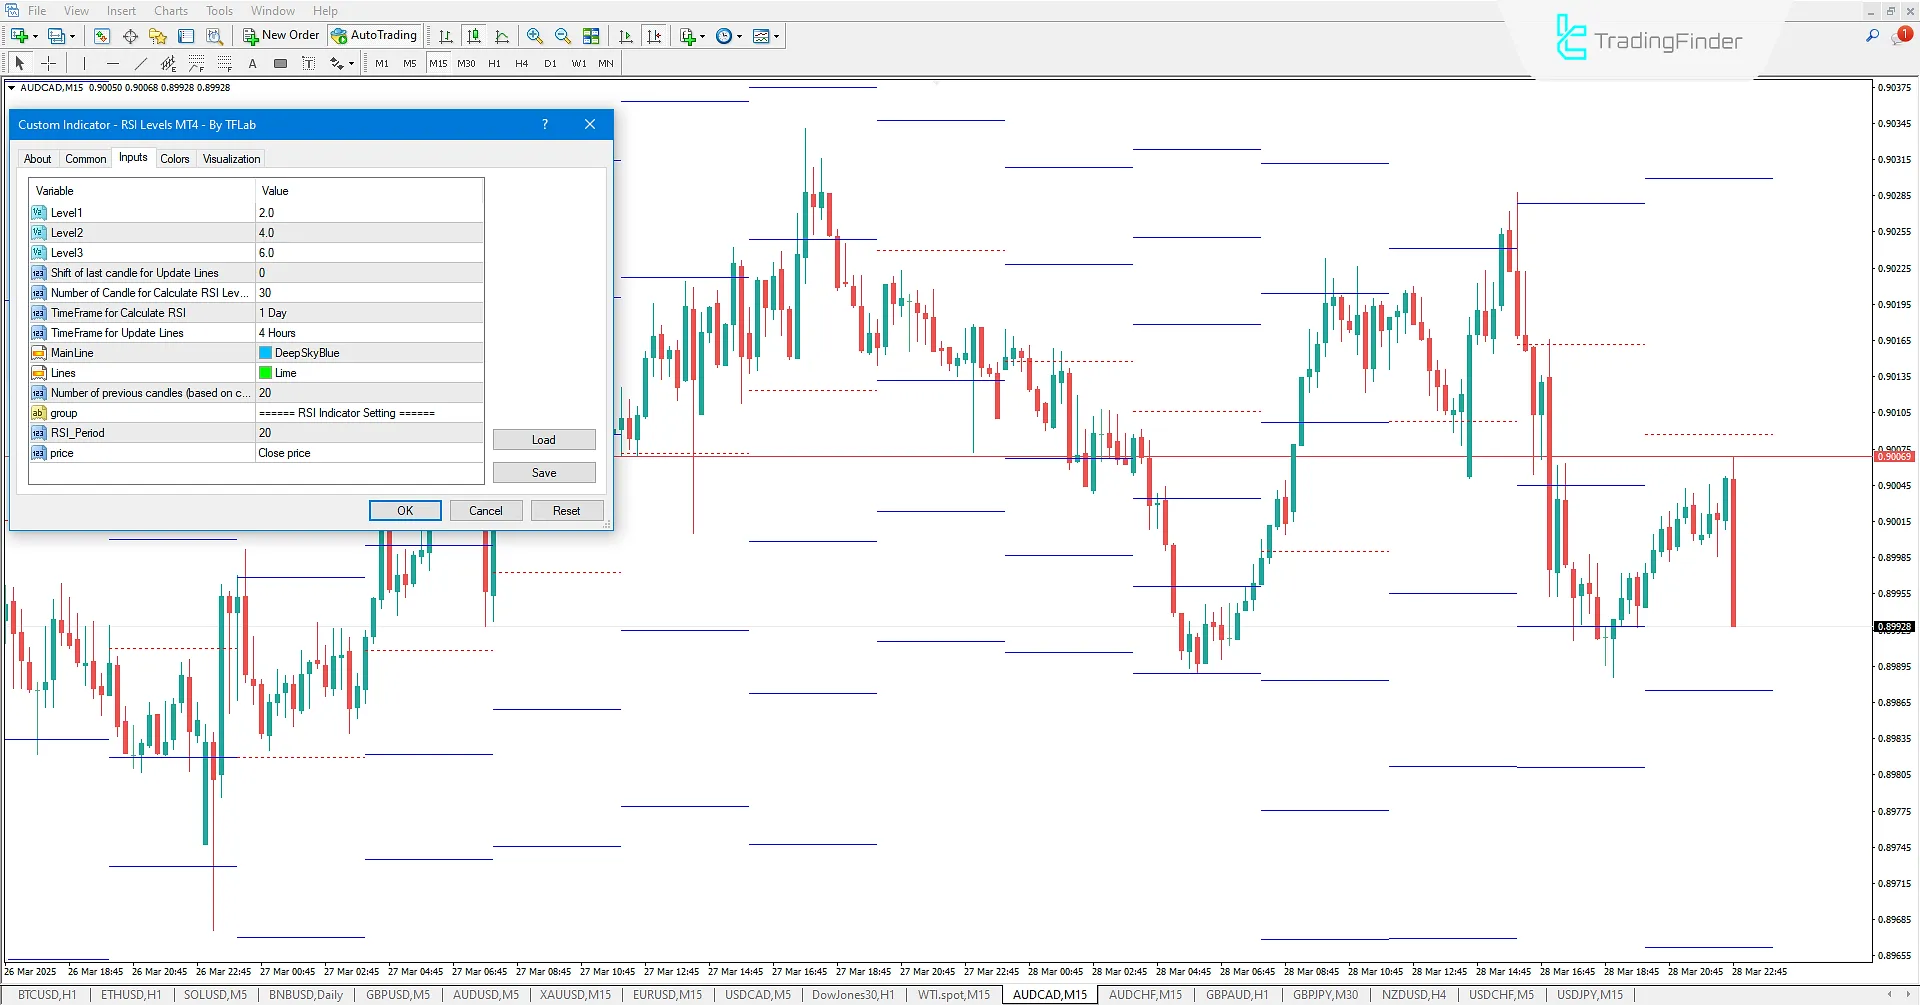
- Level1: Adjust the period for Level 1 (closest level);
- Level2: Adjust the period for Level 2;
- Level3: Adjust the period for Level 3 (furthest level);
- Shift of last candle for Update Lines: Shift period adjustment;
- Number of Candles for Calculate RSI Levels: Number of candles for averaging based on the selected timeframe;
- Time Frame for Calculate RSI: Timeframe for RSI calculations;
- Time Frame for Update Lines: Timeframe for updating lines;
- Main Line: Central level color adjustment;
- Lines: Level colors adjustment;
- Number of previous candles: Display period for calculations and lines based on the selected timeframe;
- RSI_Period: RSI period adjustment;
- Price: Price calculation type.
Conclusion
The RSI Levels Indicator is one of the Volume indicators for MetaTrader 4 and is highly useful for traders in identifying key levels In Technical analysis.
This indicator plots seven levels, including a central level, three upper levels, and three lower levels, based on RSI calculations. It highlights potential price reaction zones, enabling traders to perform more precise market analysis and identify critical points.
RSI Levels MT4 PDF
RSI Levels MT4 PDF
Click to download RSI Levels MT4 PDFWhat is the RSI Levels Indicator?
The RSI Levels Indicator is a MetaTrader 4 tool that operates based on the RSI algorithm, allowing traders to identify price reaction levels and conduct deeper analysis.
How does the RSI Levels Indicator work?
This indicator plots seven levels on the chart, including a central level, three upper levels, and three lower levels, helping traders detect potential price reaction zones.


