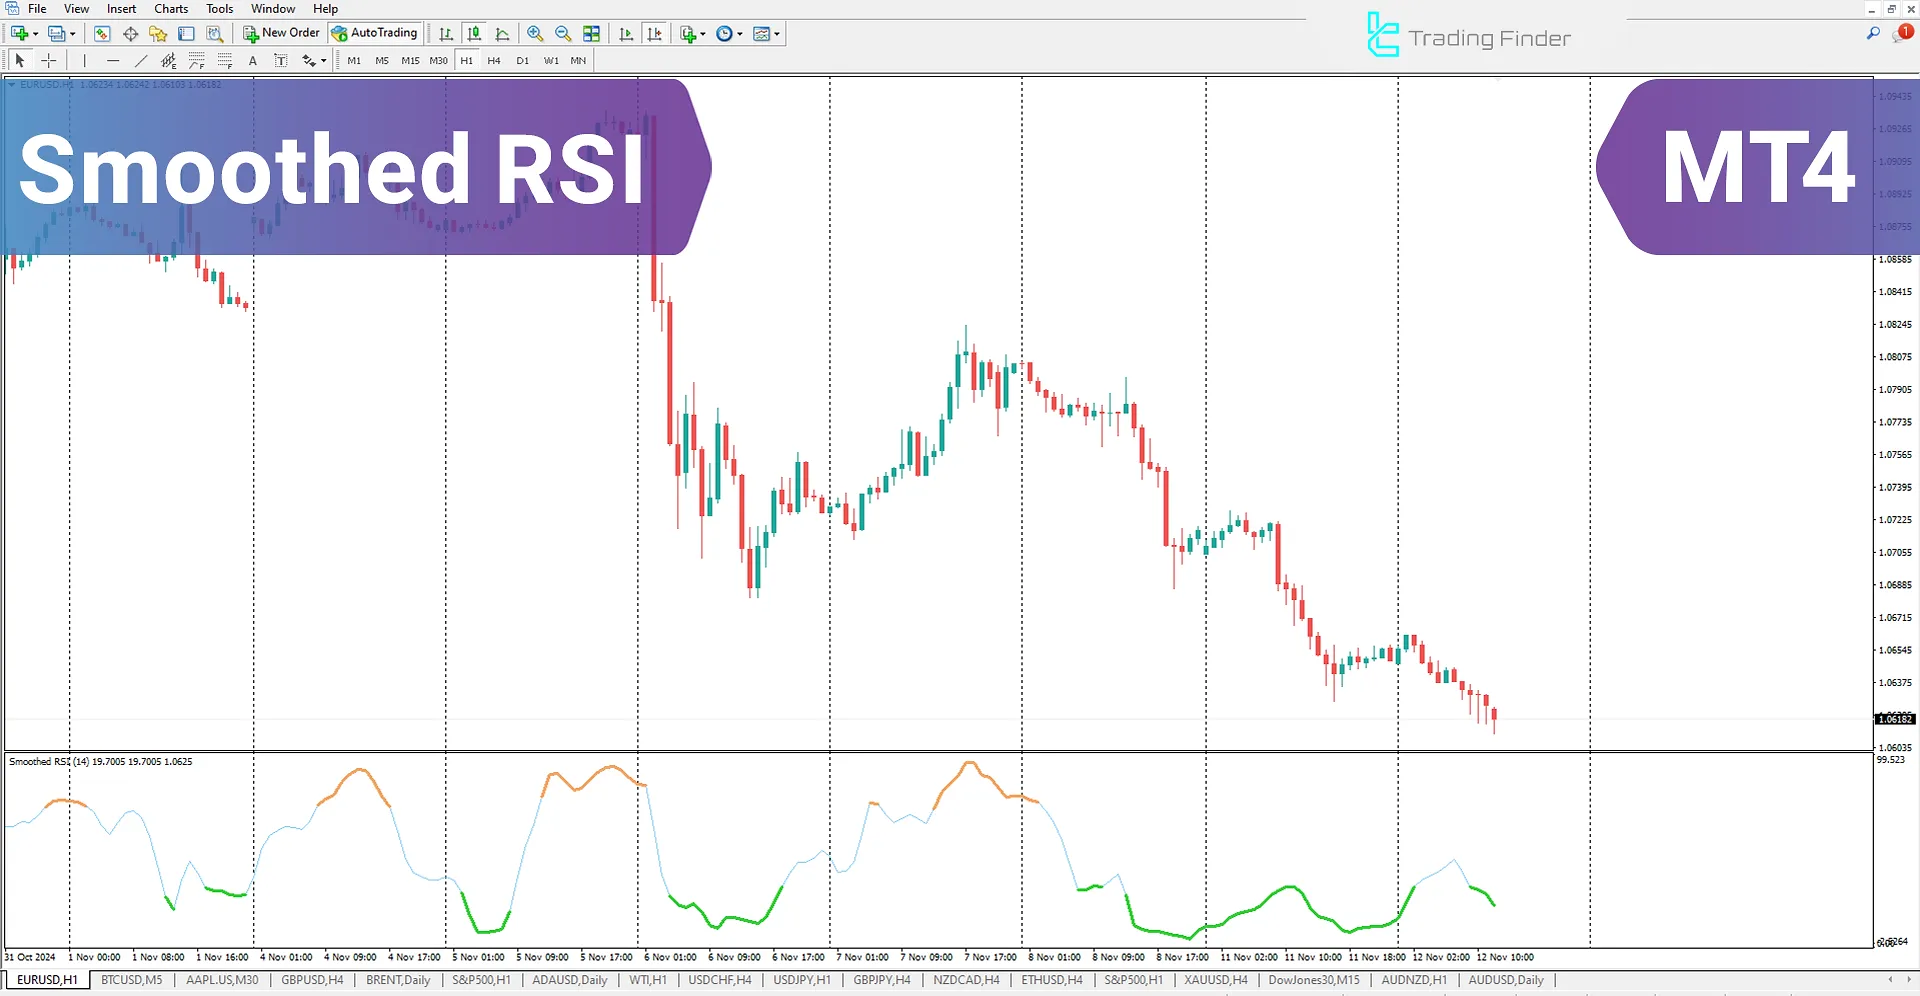


The Smoothed Relative Strength Indicator (Smoothed RSI) is an advanced version of the original RSI designed for the MetaTrader 4 (MT4) platform. This metaTrader4 oscillator uses a smoothed moving average to reduce the extreme fluctuations of the RSI, enabling more precise analysis for traders.
One of the critical features of this indicator is the oscillator color change when entering overbought and oversold zones: it displays green in the oversold zone and orange in the overbought zone. Additionally, the indicator issues alerts upon entering these zones, keeping traders informed of potential positions for improved trading decisions.
RSI Indicator Table
|
Indicator Categories:
|
Oscillators MT4 Indicators
Volatility MT4 Indicators
Trading Assist MT4 Indicators
|
|
Platforms:
|
MetaTrader 4 Indicators
|
|
Trading Skills:
|
Elementary
|
|
Indicator Types:
|
Leading MT4 Indicators
Entry and Exit MT4 Indicators
|
|
Timeframe:
|
Multi-Timeframe MT4 Indicators
|
|
Trading Style:
|
Day Trading MT4 Indicators
Intraday MT4 Indicators
Scalper MT4 Indicators
|
|
Trading Instruments:
|
Indices Market MT4 Indicators
Cryptocurrency MT4 Indicators
Forex MT4 Indicators
|
Smoothed RSI Indicator at a Glance
The Smoothed RSI Indicator is highly beneficial for traders who rely on indicators in their trading strategies. This advanced version of the RSI uses a moving average to reduce fluctuations.
When the oscillator enters the overbought zone, it turns orange; when it reaches the oversold zone, it turns green. Additionally, the MT4 Volatility indicator sends alerts to notify traders of these critical market conditions.
Oversold Zone

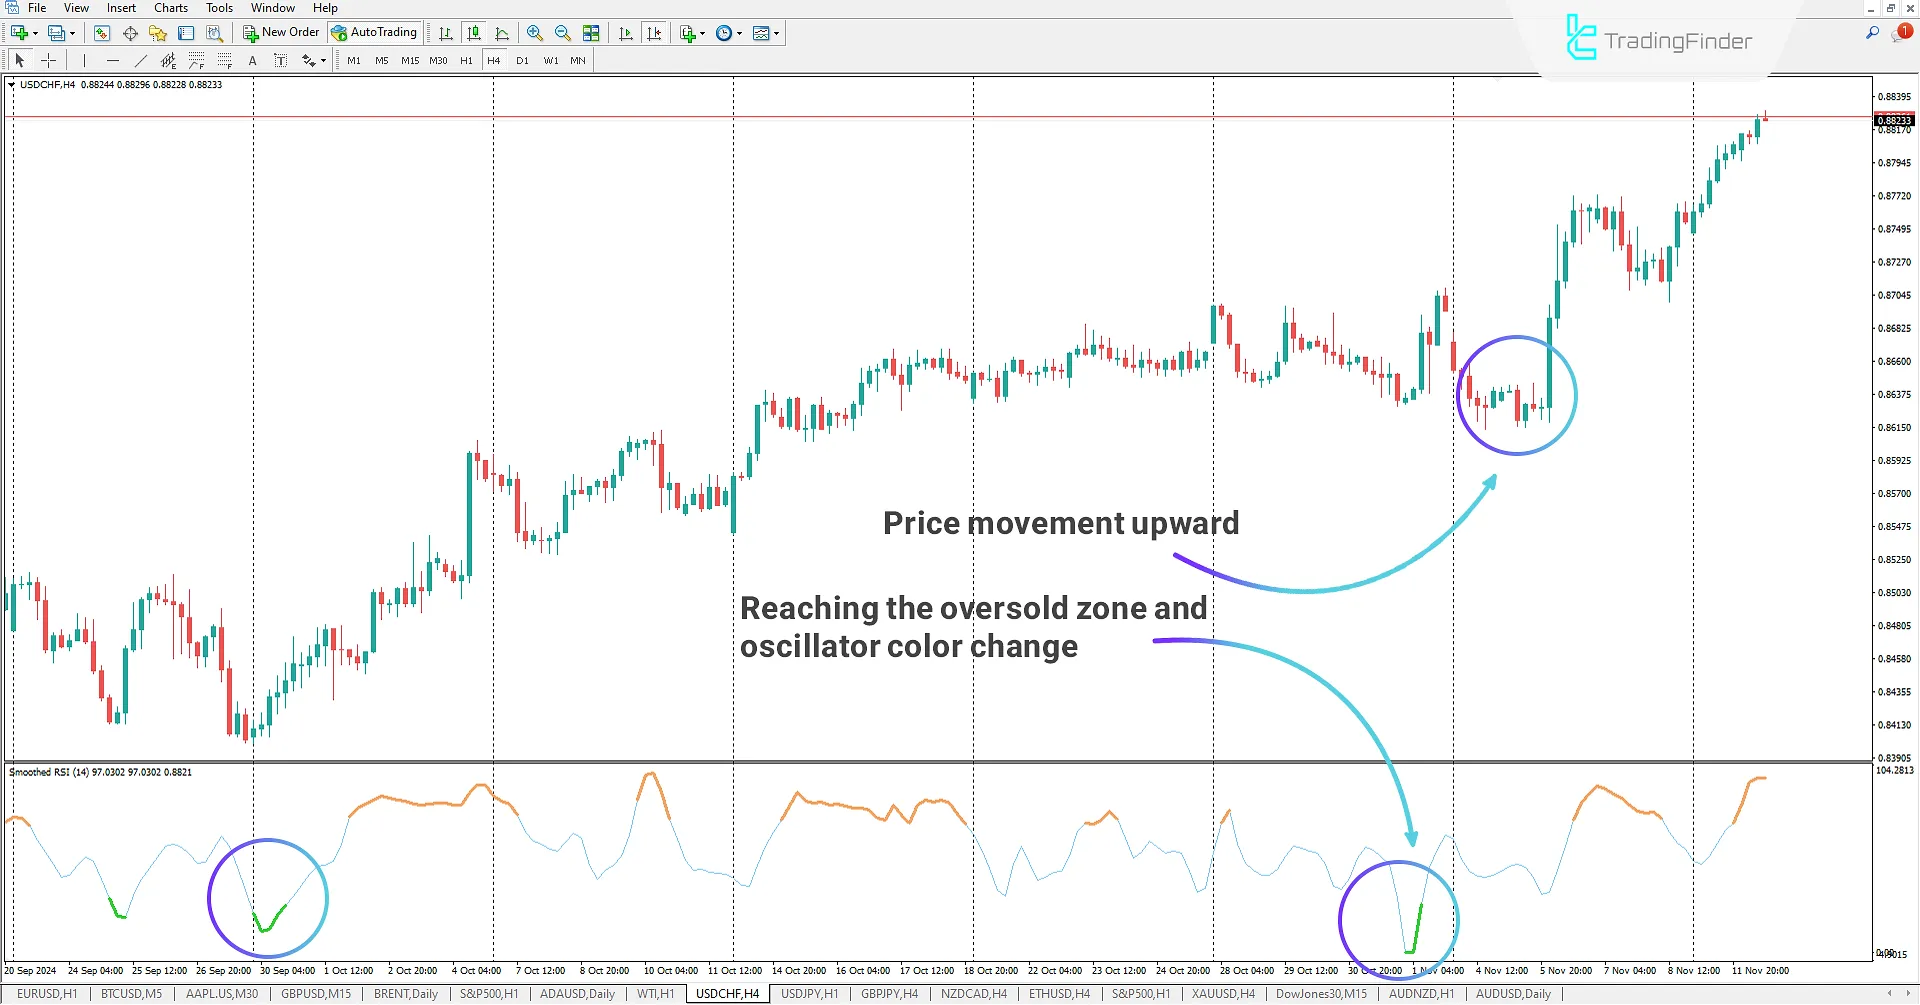
In the USD/CHF 4-hour chart, the oscillator reaches the oversold zone, turning green and sending an alert to notify traders of this threshold.
Following this signal, the market experiences a short downward correction, but the general trend shifts from bearish to bullish. The price then moves sharply upward, continuing its uptrend.
This behavior demonstrates the strength of Smoothed RSI signals in identifying reversal points and trend changes, especially in overbought and oversold zones. Traders can use these signals to enter buy or sell positions confidently.
Overbought Zone

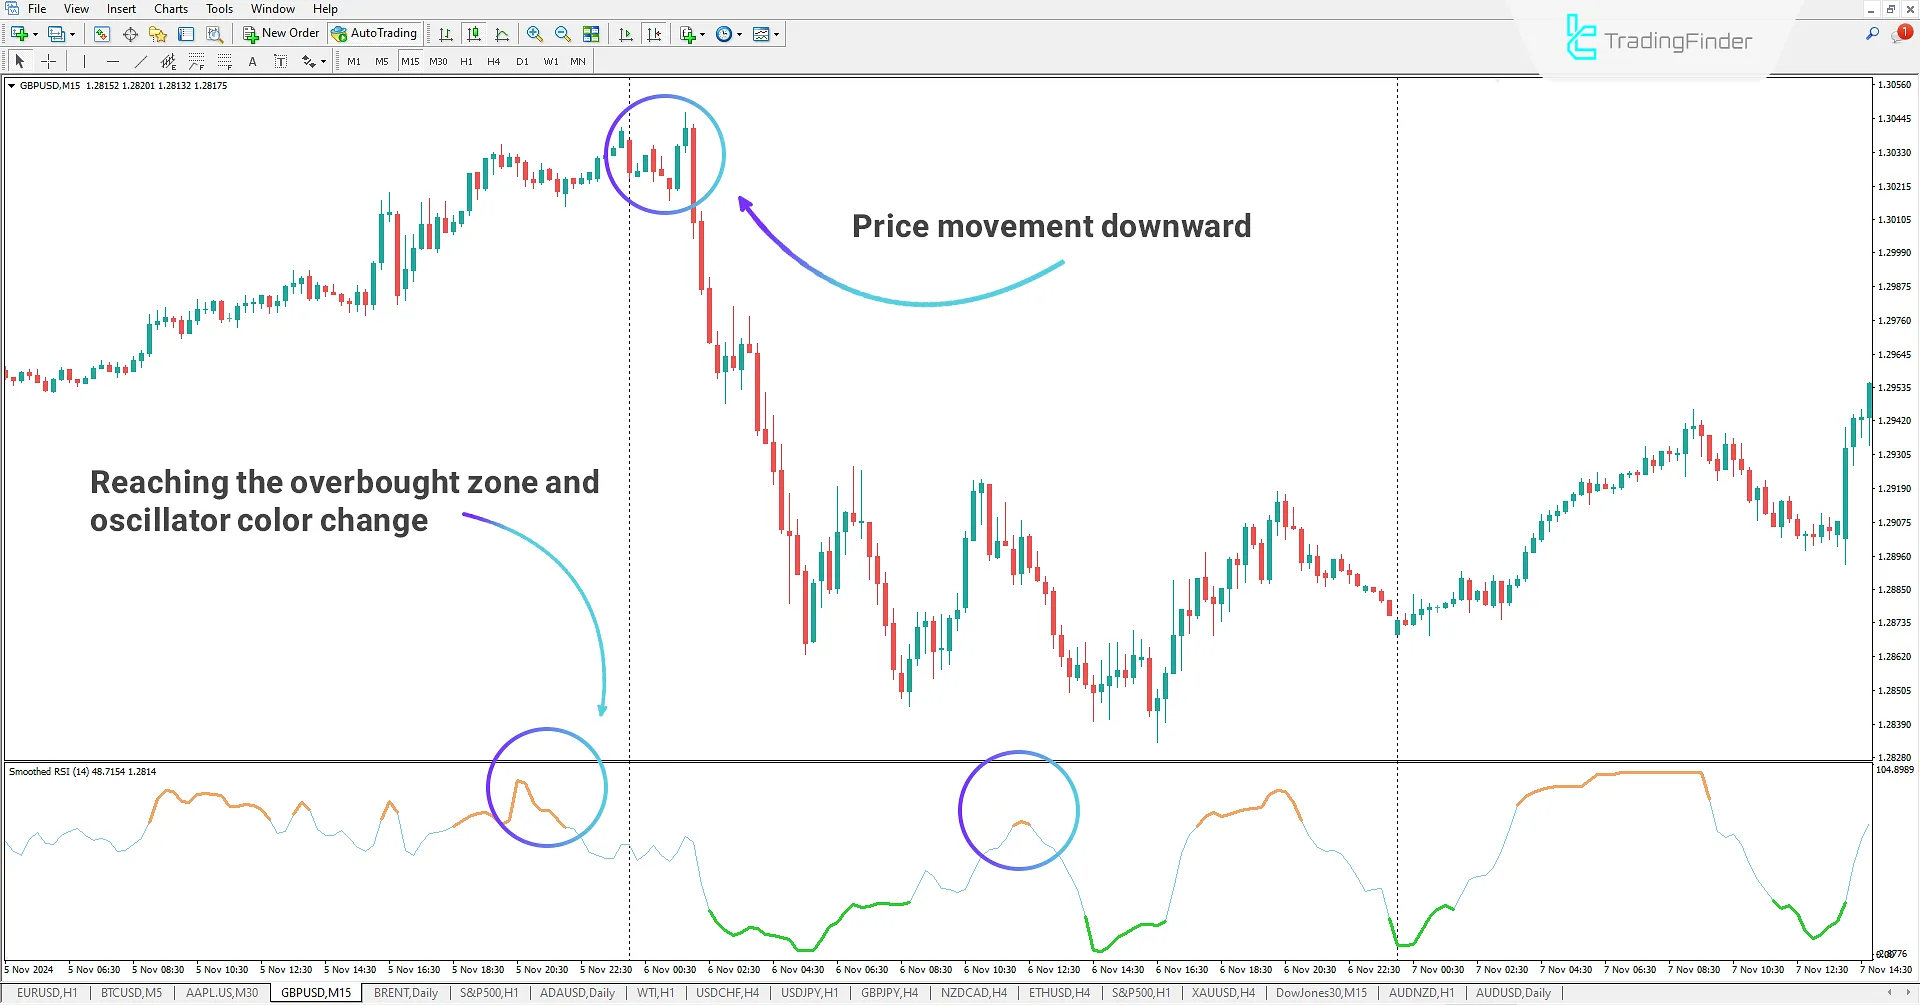
In the GBP/USD 15-minute chart, the Smoothed RSI oscillator reaches the overbought zone and changes color to orange. This color change alerts traders that the price has reached the overbought level. Following this signal, the price starts a downtrend.
This setup can be an excellent opportunity for traders looking to enter sell positions. Using such signals helps traders enter the market at critical points and capitalize on trading opportunities in line with the trend.
RSI Oscillator Settings

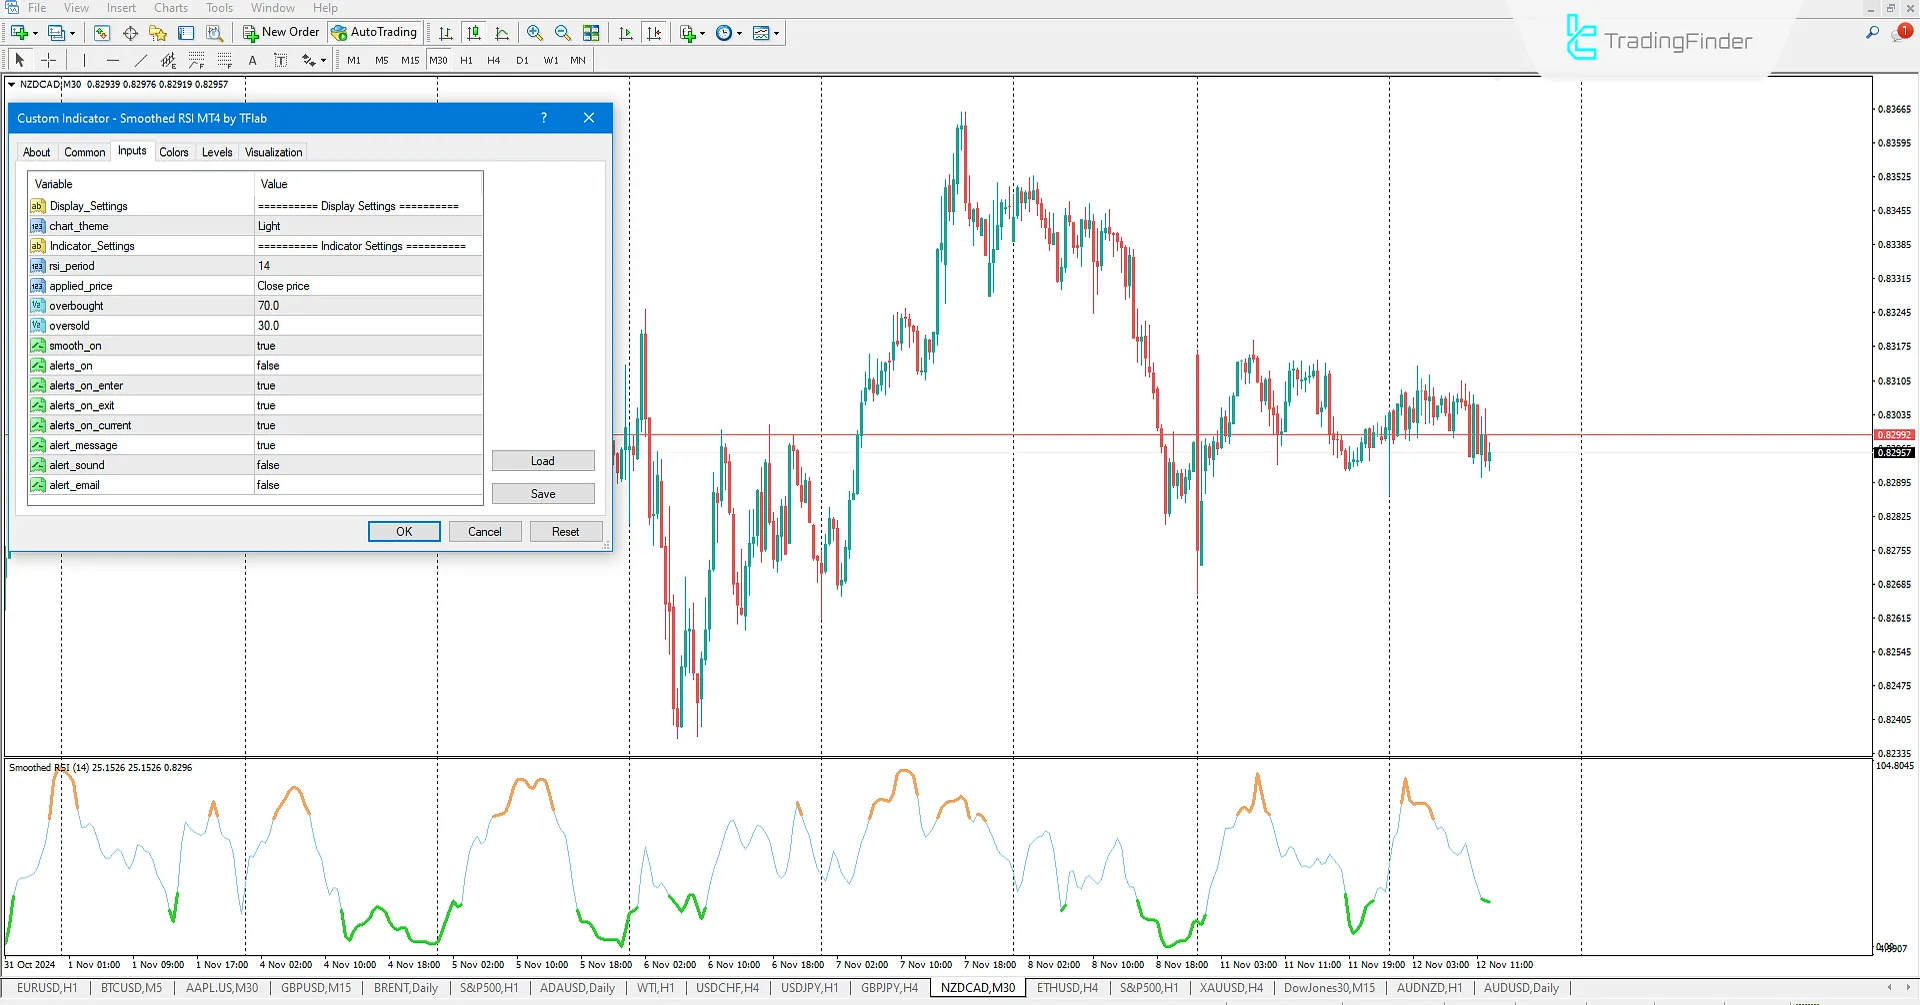
Display_Settings
- Chart_theme: Select a custom theme for the indicator;
Indicator_Settings
- RSI_period: Select RSI period;
- Applied_price: Select calculation type;
- Overbought: Set overbought level;
- Oversold: Set oversold level;
- Smooth_on: Toggle RSI smoothing on/off;
- Alerts_on: Toggle alerts on/off;
- Alerts_on_enter: Toggle alert when entering overbought/oversold zones;
- Alerts_on_exit: Toggle alert when exiting overbought/oversold zones;
- Alerts_on_current: Toggle alert when the price closes out of the overbought/oversold zones;
- Alert_message: Toggle message alerts on/off;
- Alert_sound: Toggle sound alerts on/off;
- Alert_email: Toggle email alerts on/off.
Conclusion
The Smoothed Relative Strength Oscillator is a practical tool for traders seeking to identify overbought and oversold areas. This indicator changes color when the oscillator enters overbought or oversold zones and sends alerts to notify the trader of these thresholds.
Moreover, using a moving average in its algorithm reduces RSI noise, providing traders with a more accurate market analysis. These features help traders make decisions more precisely and benefit from more reliable signals.
What is the Smoothed Relative Strength Index (RSI) indicator?
The Smoothed RSI indicator is an advanced version of the RSI, using a smoothed moving average to reduce the extreme fluctuations of RSI and provide more accurate analysis. This feature helps traders reduce market noise and make better decisions.
How does this indicator display overbought and oversold zones?
The oscillator color changes to green in the oversold zone, while in the overbought zone, it changes to orange. This color change indicates to traders that the price is nearing potential reversal points.