![Stochastic Momentum indicator for MT4 Download - Free - [TradingFinder]](https://cdn.tradingfinder.com/image/128139/11-45-en-stochastic-momentum-oscillator-mt4-01.webp)
![Stochastic Momentum indicator for MT4 Download - Free - [TradingFinder] 0](https://cdn.tradingfinder.com/image/128139/11-45-en-stochastic-momentum-oscillator-mt4-01.webp)
![Stochastic Momentum indicator for MT4 Download - Free - [TradingFinder] 1](https://cdn.tradingfinder.com/image/128141/11-45-en-stochastic-momentum-oscillator-mt4-02.webp)
![Stochastic Momentum indicator for MT4 Download - Free - [TradingFinder] 2](https://cdn.tradingfinder.com/image/128142/11-45-en-stochastic-momentum-oscillator-mt4-03.webp)
![Stochastic Momentum indicator for MT4 Download - Free - [TradingFinder] 3](https://cdn.tradingfinder.com/image/128140/11-45-en-stochastic-momentum-oscillator-mt4-04.webp)
The Stochastic Momentum Oscillator is an improved version, specifically designed and developed for the MetaTrader 4 platform. This MetaTrader4 Oscillator enhances the precision in identifying trading opportunities by using moving averages and an advanced computational algorithm to recognize market trends better.
In this indicator, the signal line is displayed in orange and the oscillator line in blue, which traders can use to predict trading opportunities and identify market trend changes.
Stochastic Oscillator Table
Indicator Categories: | Oscillators MT4 Indicators Signal & Forecast MT4 Indicators Currency Strength MT4 Indicators Trading Assist MT4 Indicators |
Platforms: | MetaTrader 4 Indicators |
Trading Skills: | Elementary |
Indicator Types: | Leading MT4 Indicators Lagging MT4 Indicators |
Timeframe: | Multi-Timeframe MT4 Indicators |
Trading Style: | Day Trading MT4 Indicators Intraday MT4 Indicators Scalper MT4 Indicators |
Trading Instruments: | Indices Market MT4 Indicators Cryptocurrency MT4 Indicators Forex MT4 Indicators |
Indicator at a Glance
The Stochastic Momentum Oscillator is an advanced version of the Stochastic indicator with higher accuracy in signal detection. When the oscillator line crosses the signal line from below, it is considered a buy signal, indicating the start of an uptrend.
Conversely, if the oscillator line crosses the signal line from above, it generates a sell signal, suggesting the potential start of a downtrend.
Traders can also use divergences between two peaks or two troughs to identify potential trend reversals. These features make the Stochastic Momentum Oscillator an effective tool for forecasting trend changes.
The uptrend in the Oscillator

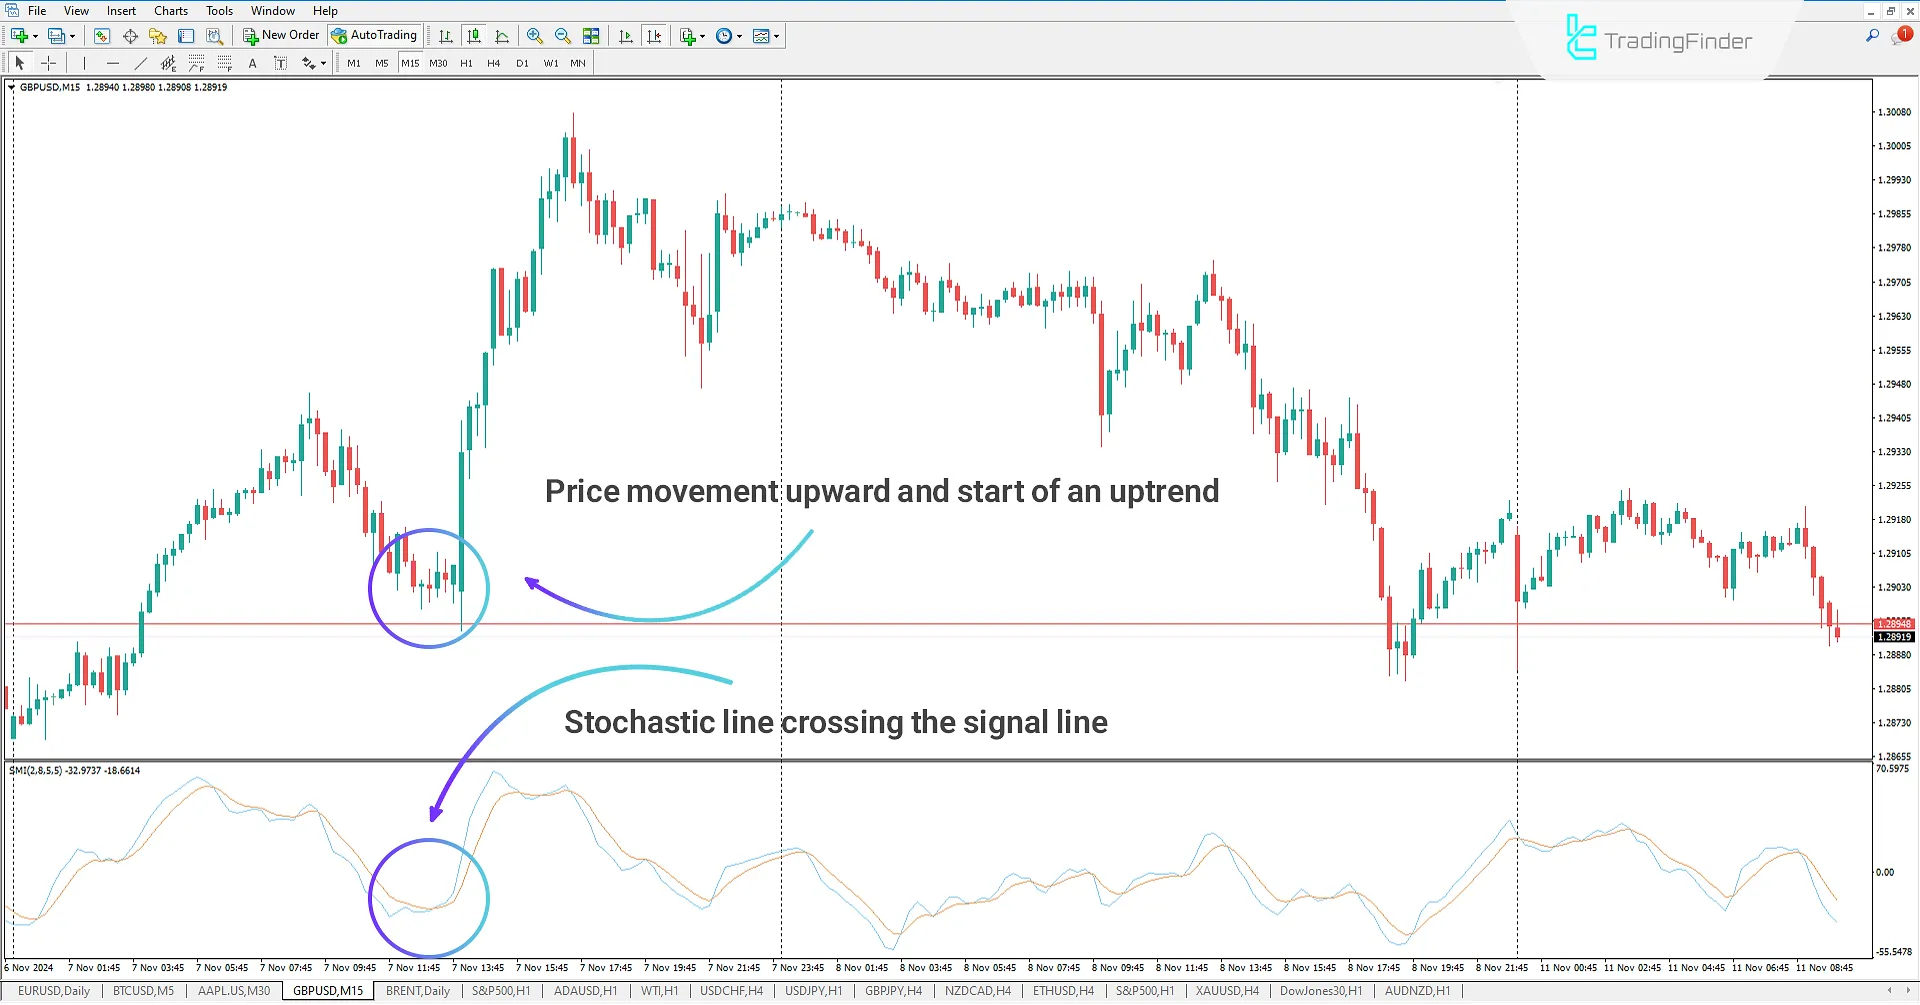
In the 15-minute GBP/USD pair chart, the Stochastic Momentum Oscillator line crosses above the signal line, indicating a trend reversal and the start of an uptrend. After a downward correction, the oscillator line crosses above the signal line, with the price continuing to rise to the 1.30080 range, signaling a bullish potential and confirming a buy signal in this time frame.
The downtrend in the Oscillator

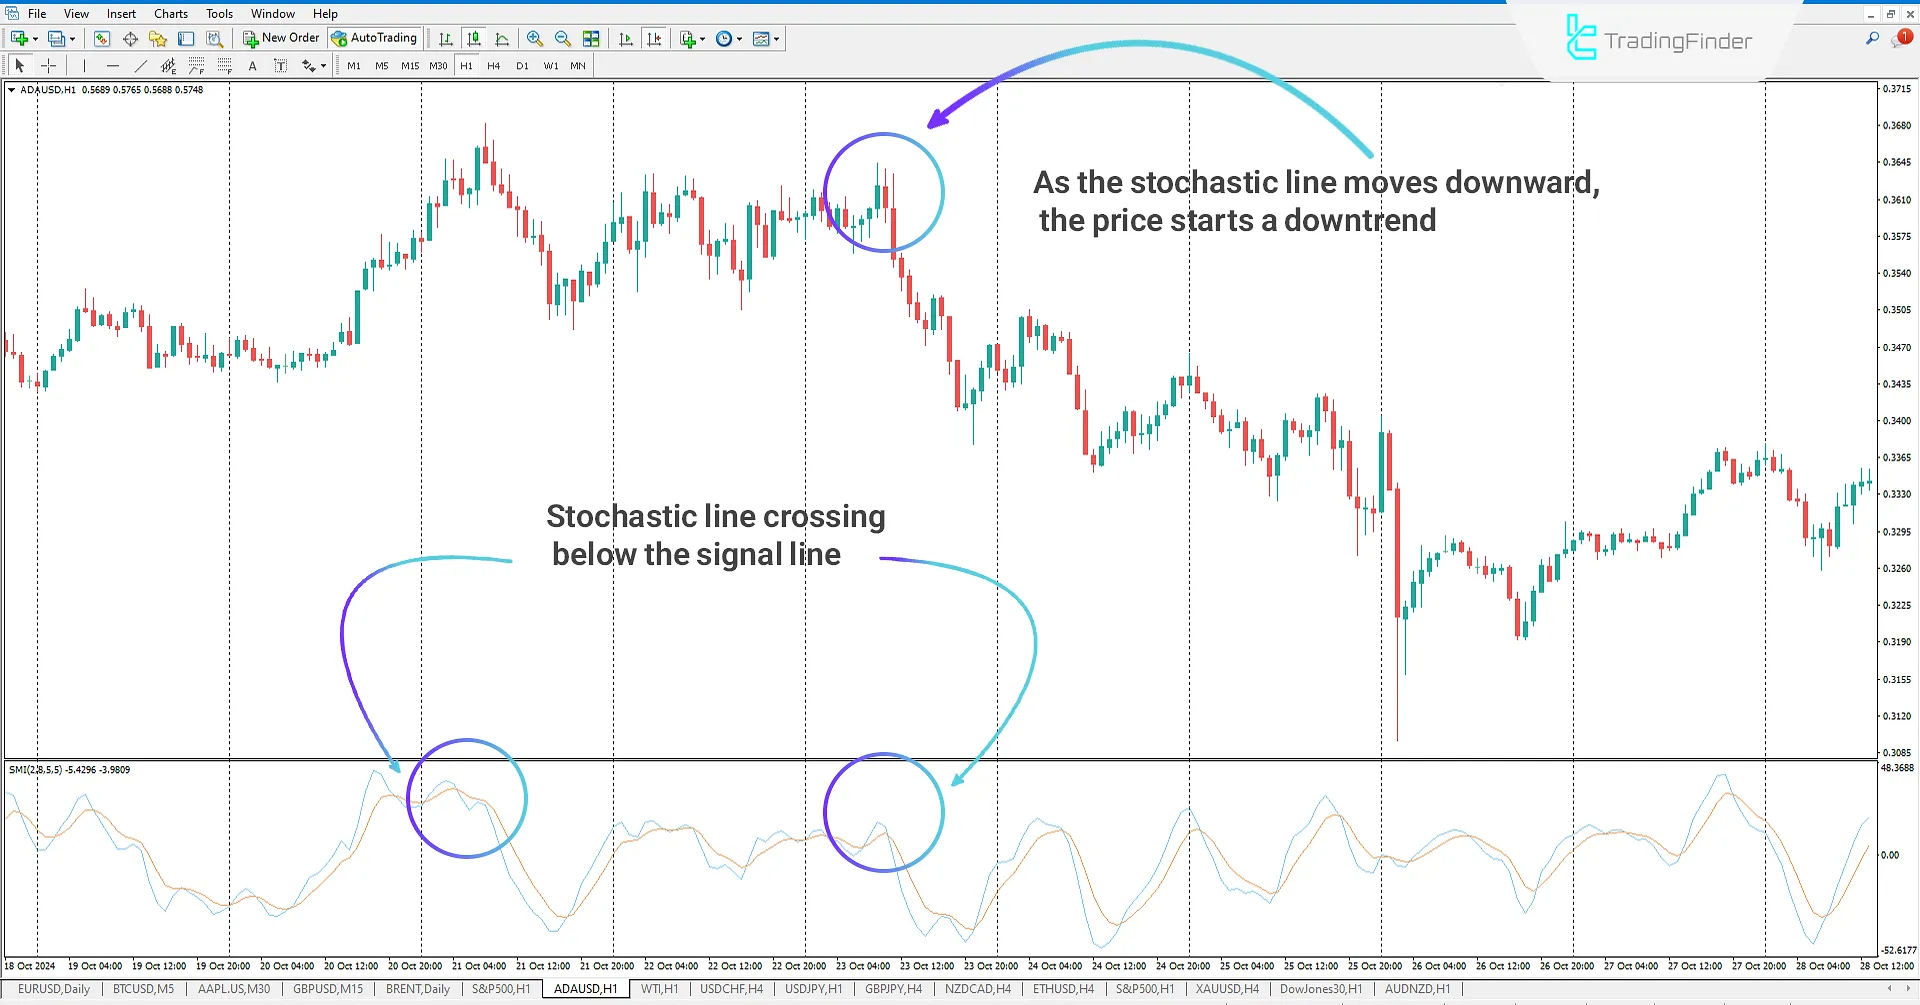
In the 1-hour ADA/USD pair chart, the Stochastic Momentum Oscillator line crosses below the signal line, indicating a trend reversal and the start of a downtrend.
After a downward correction and as the oscillator line crosses below the signal line, the price starts to decline, continuing to the 0.3085 range, indicating a bearish potential and confirming a valid sell signal in this time frame.
Oscillator Settings

Display_Settings:
- Chart_theme: Select a custom theme for the indicator
Indicator_Settings:
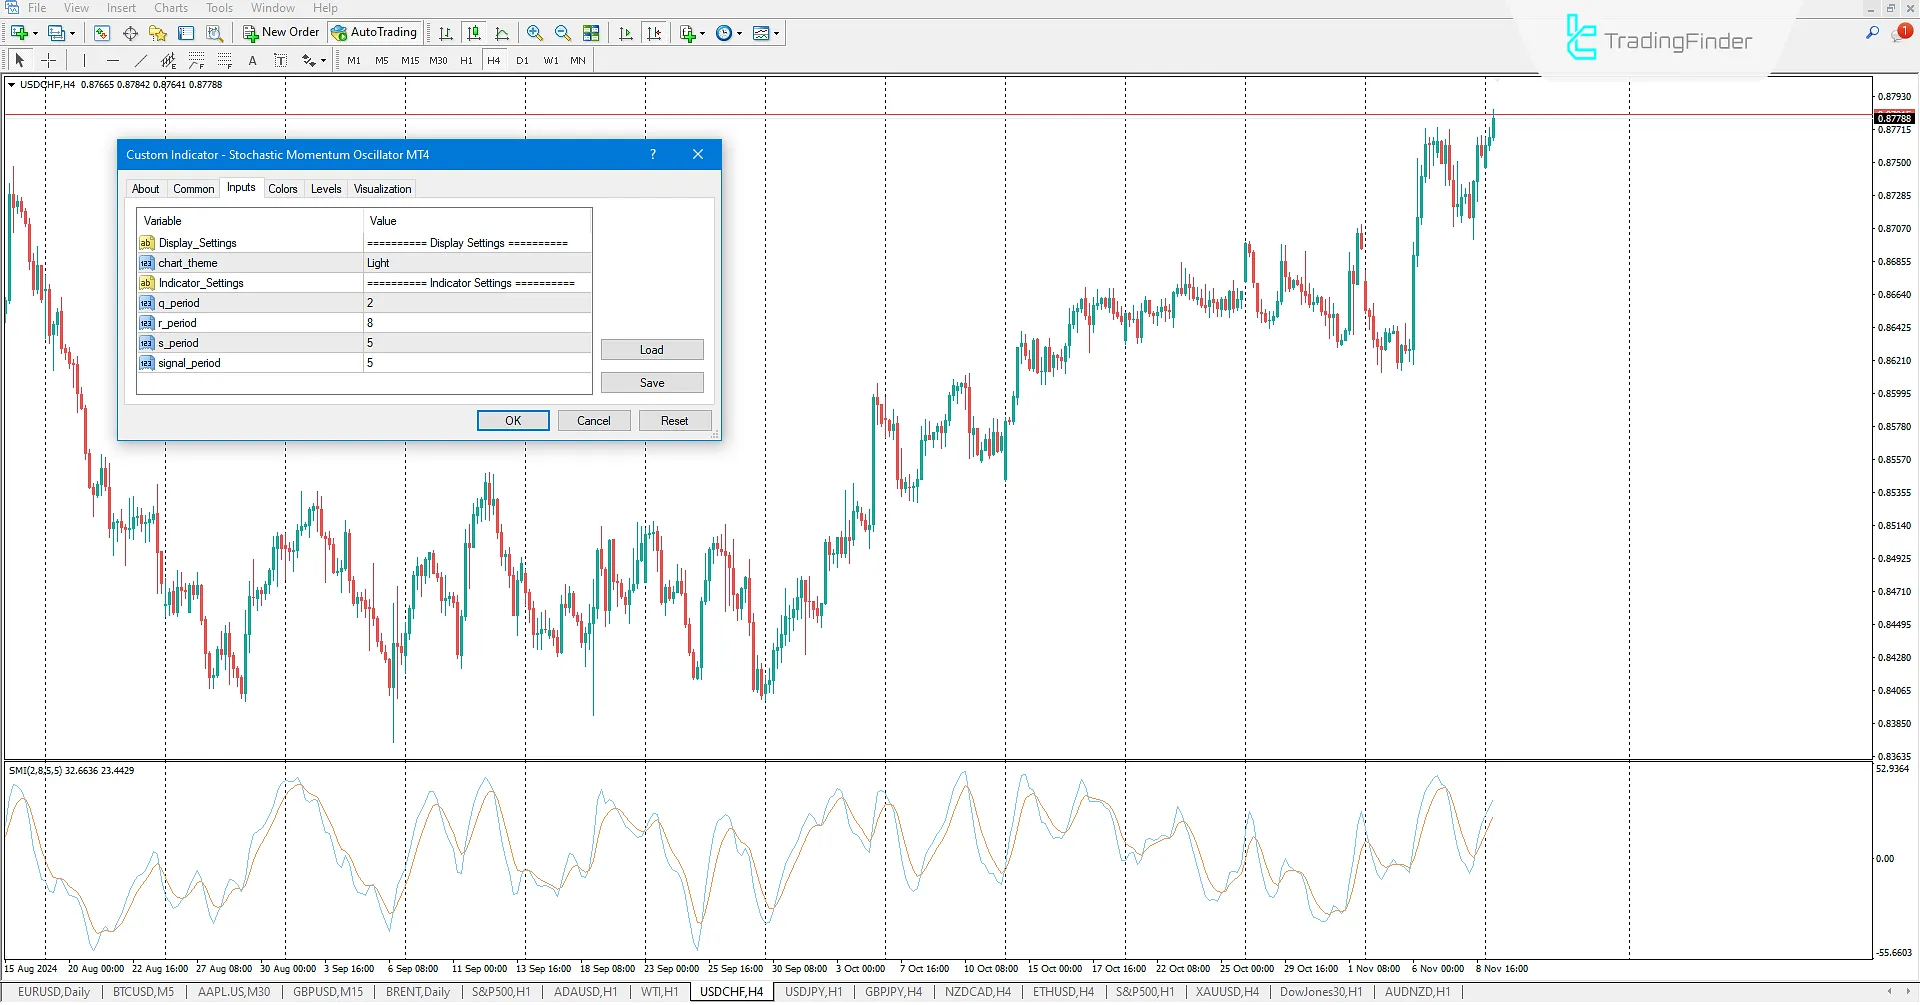
- Q period: Oscillator line period setting
- R period: Moving average period 1 setting (affects calculation algorithm)
- S period: Moving average period 2 setting (affects calculation algorithm)
- Signal_period: Signal line period setting
Conclusion
The Stochastic Momentum Oscillator is suitable for traders interested in using the Stochastic Indicator in their trading. It operates with greater accuracy and power in trend detection and identifying reversal zones, This metaTrader4 Trading Assistant Indicators helping traders pinpoint optimal entry and exit points.
When the oscillator line crosses the signal line, traders can decide to enter or exit trades. Furthermore, using divergences as a warning for potential price reversals adds another advantage, enhancing trading strategies effectively.
Stochastic Momentum indicator MT4 PDF
Stochastic Momentum indicator MT4 PDF
Click to download Stochastic Momentum indicator MT4 PDFHow are buy and sell signals determined in this indicator?
When the oscillator line crosses above the signal line, it indicates a buy signal and the start of an uptrend. Conversely, if the oscillator line crosses below the signal line, it is interpreted as a sell signal and the beginning of a downtrend.
What is the Stochastic Momentum, and how does it differ from the Stochastic Oscillator?
The Stochastic Momentum Oscillator is an enhanced version of the Stochastic Oscillator, utilizing moving averages and an advanced computational algorithm to improve precision in identifying trading opportunities and aid in better market trend detection.


