![Super Arrow Indicator for MetaTrader4 Download - Free - [TF Lab]](https://cdn.tradingfinder.com/image/105018/10-3-en-super-arrow-mt4.webp)
![Super Arrow Indicator for MetaTrader4 Download - Free - [TF Lab] 0](https://cdn.tradingfinder.com/image/105018/10-3-en-super-arrow-mt4.webp)
![Super Arrow Indicator for MetaTrader4 Download - Free - [TF Lab] 1](https://cdn.tradingfinder.com/image/29907/10-03-en-super-arrow-mt4-02.avif)
![Super Arrow Indicator for MetaTrader4 Download - Free - [TF Lab] 2](https://cdn.tradingfinder.com/image/29911/10-03-en-super-arrow-mt4-03.avif)
![Super Arrow Indicator for MetaTrader4 Download - Free - [TF Lab] 3](https://cdn.tradingfinder.com/image/29915/10-03-en-super-arrow-mt4-04.avif)
On June 22, 2025, in version 2, alert/notification functionality was added to this indicator
The Super Arrow indicator is a popular indicator in the MetaTrader 4 indicator series that utilizes a combination of indicators, including the RSI (Relative Strength Index), Bollinger Bands, Moving Averages, and a Magic Filter, to effectively identify optimal reversal points and pivot highs and lows in trading charts.
This Binary indicator marks pivot lows with green arrows and pivot highs with red arrows. By integrating multiple indicators, the Super Arrow provides a robust filter that helps accurately discern the lows and highs in price charts.
It is an invaluable tool for traders looking to pinpoint entry and exit points based on pivot signals.
Indicator Table
Indicator Categories: | Pivot Points & Fractals MT4 Indicators Signal & Forecast MT4 Indicators Trading Assist MT4 Indicators |
Platforms: | MetaTrader 4 Indicators |
Trading Skills: | Elementary |
Indicator Types: | Lagging MT4 Indicators Reversal MT4 Indicators |
Timeframe: | M15-M30 Time MT4 Indicators H4-H1 Time MT4 Indicators |
Trading Style: | Day Trading MT4 Indicators Intraday MT4 Indicators Swing Trading MT4 Indicators |
Trading Instruments: | Binary Options MT4 Indicators Indices Market MT4 Indicators Cryptocurrency MT4 Indicators Forex MT4 Indicators |
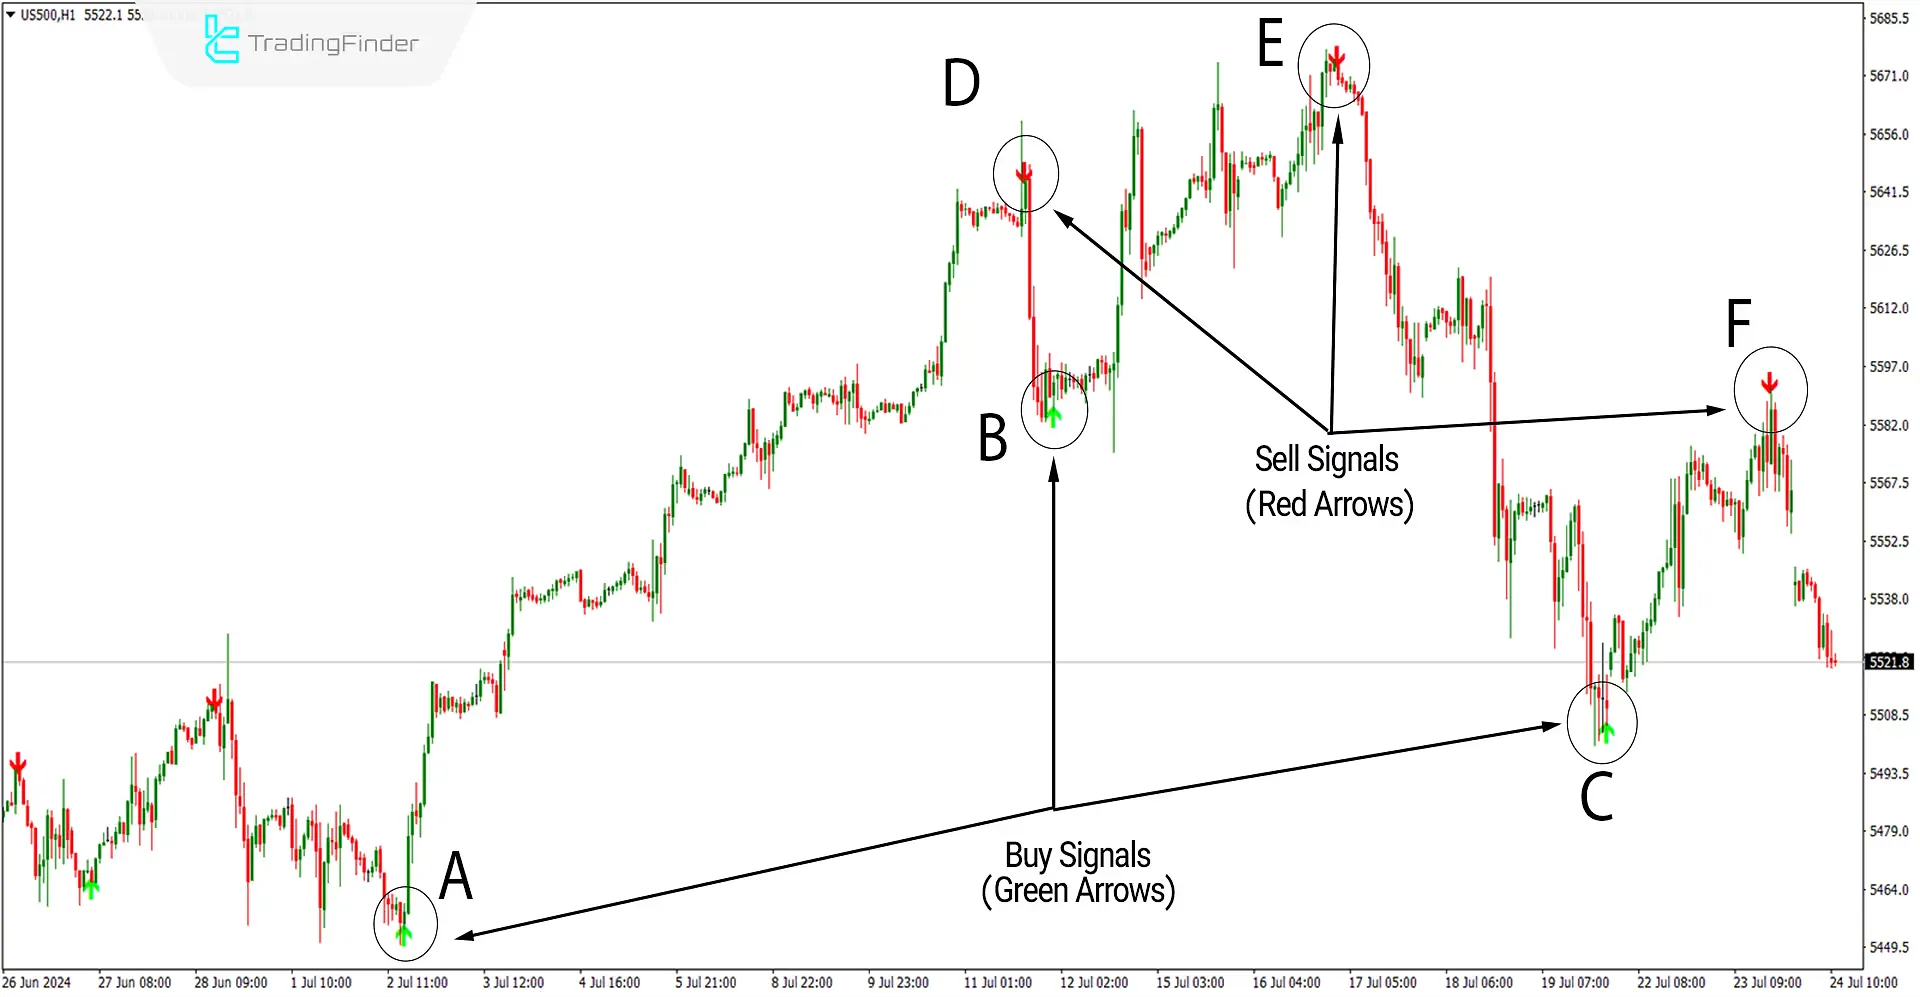
The image shown depicts the S&P 500 index chart with the symbol [US500] over a one-hour period. Points A, B, and C are identified as pivot lows, where the indicator has issued buy signals marked by green arrows.
Conversely, points D, E, and F represent pivot highs, where the indicator has issued sell signals marked by red arrows.
This setup demonstrates how the indicator effectively uses color-coded arrows to signal optimal trading opportunities at pivotal points in the price chart, guiding traders on potential entries for buying and selling.

Overview
Using signals from a single indicator can be risky for trading, mainly when different indicators give conflicting signals simultaneously.
Therefore, combining three or more indicators can help filter out high-risk signals and identify more reliable entry points for trade.
This method enhances decision-making by providing a more comprehensive view of market conditions.
In such a multi-indicator system, when the market is bullish and a strong buy signal is present, the MT4 signal and forecast indicators will display a green arrow to indicate a buying opportunity.
Conversely, when the market is bearish and a strong sell signal is present, a red arrow indicates a potential selling opportunity.
Buy Signals (Uptrends)
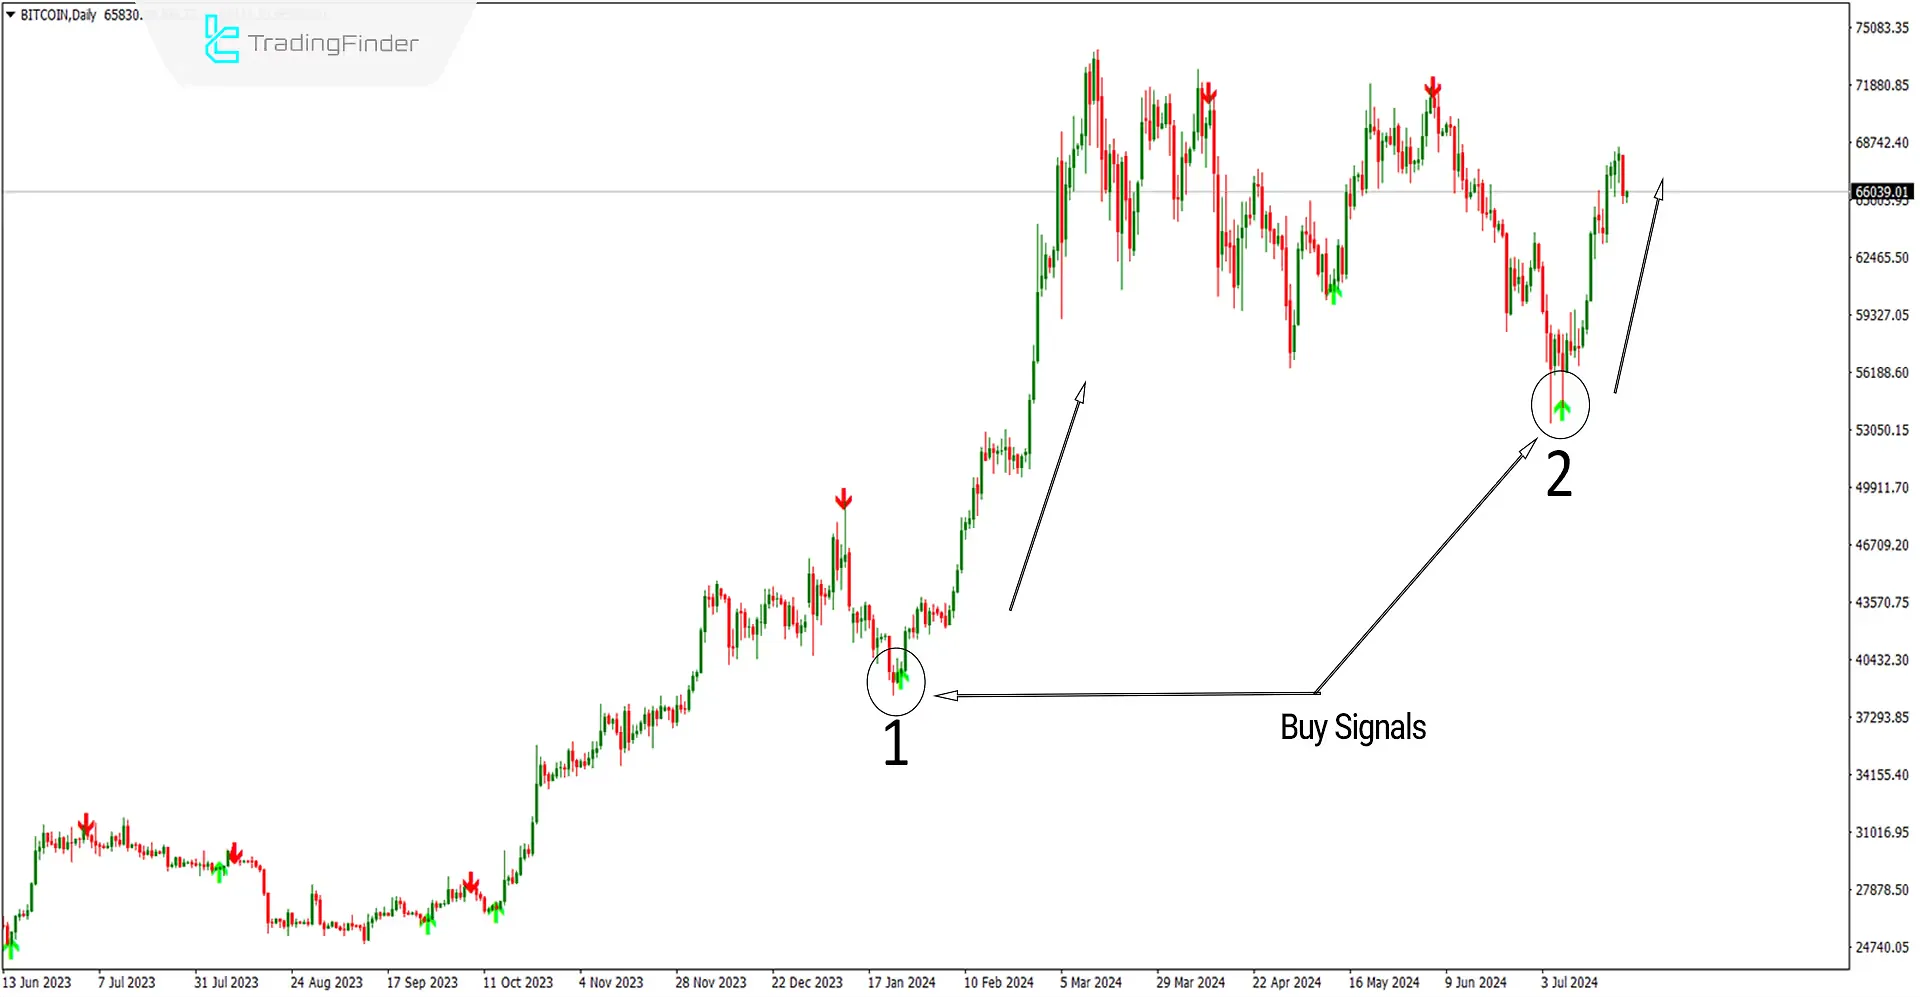
The image below shows the daily price chart of Bitcoin with the symbol (BITCOIN), where the indicator has identified major pivot levels at the bottom numbers 1 and 2 and issues a buy signal by displaying a green arrow.
With the display of the buy signal, one can look for confirmations, such as candlestick patterns and reversal patterns, to enter a trade.

Sell Signals (Downtrends)
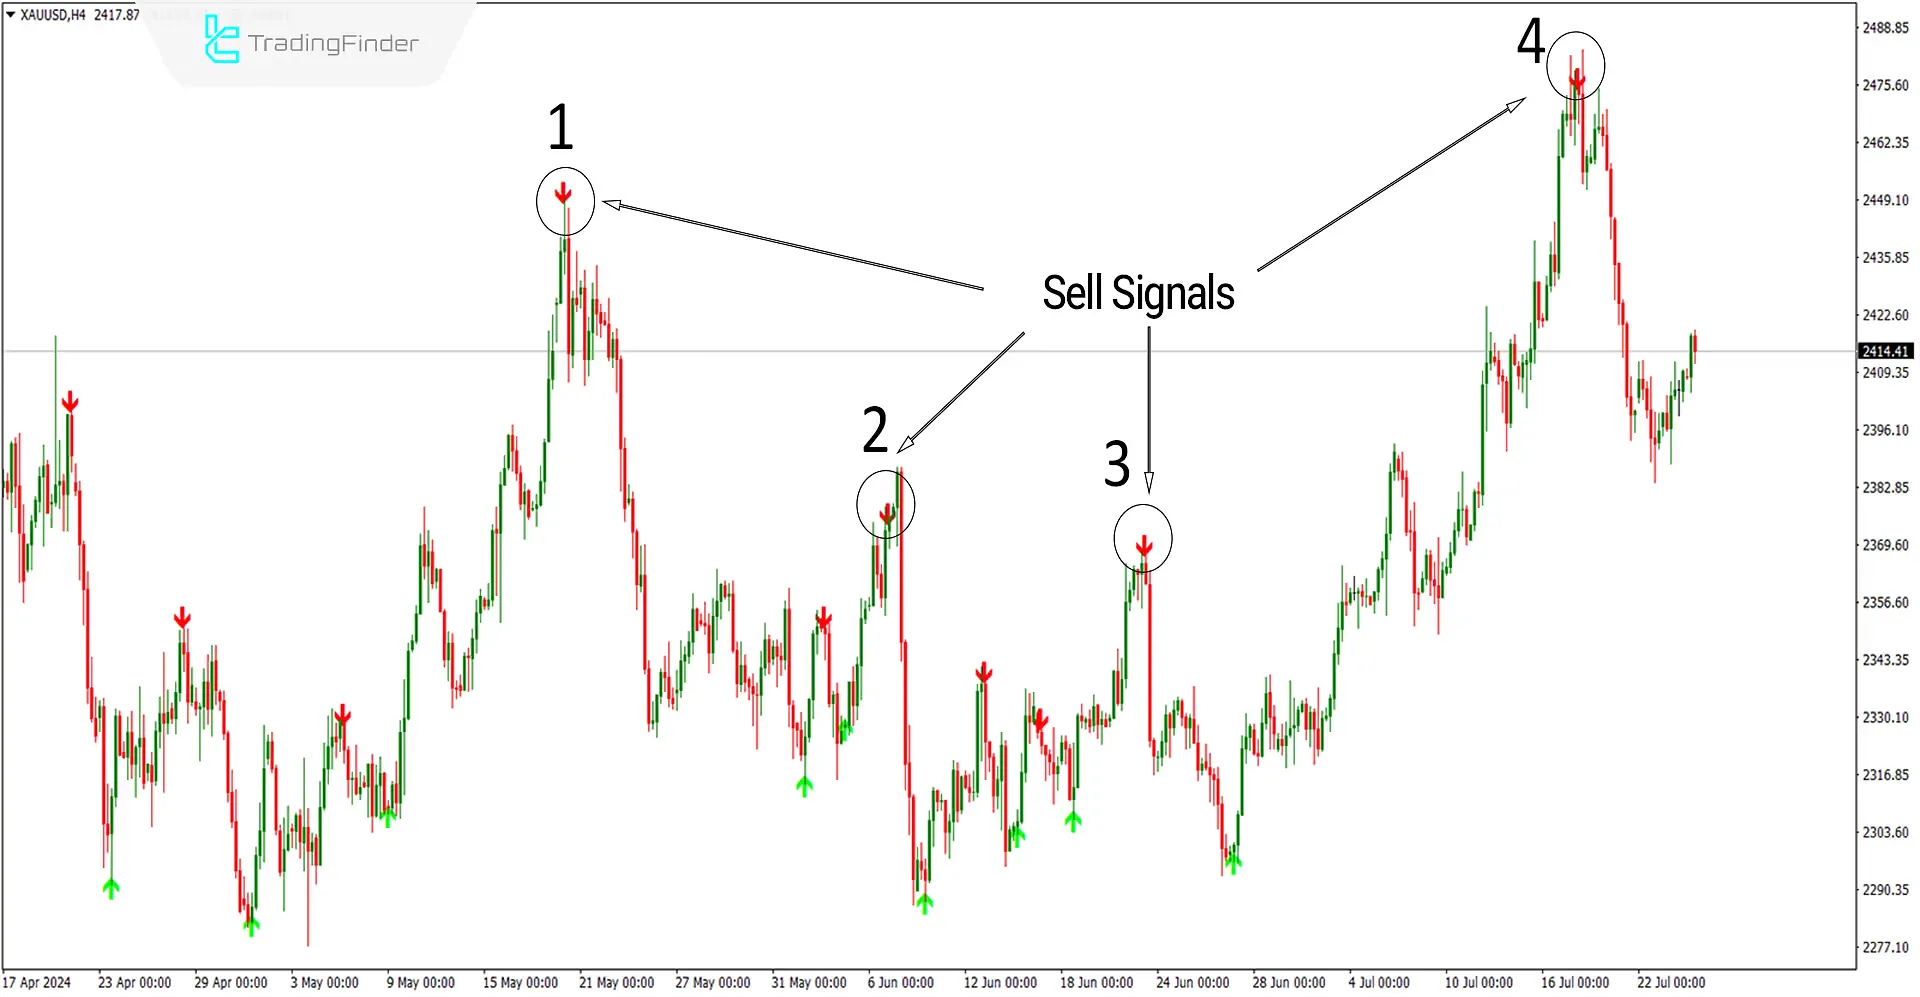
The image below shows the 4-hour price chart for gold with the symbol (XAUUSD), where the indicator has identified potential reversal points at major pivot highs 1, 2, 3, and 4, issuing a sell signal with a red arrow.
Using classic support and resistance levels can be helpful in confirming the signals from this indicator.

Settings of the Super Arrow Indicator

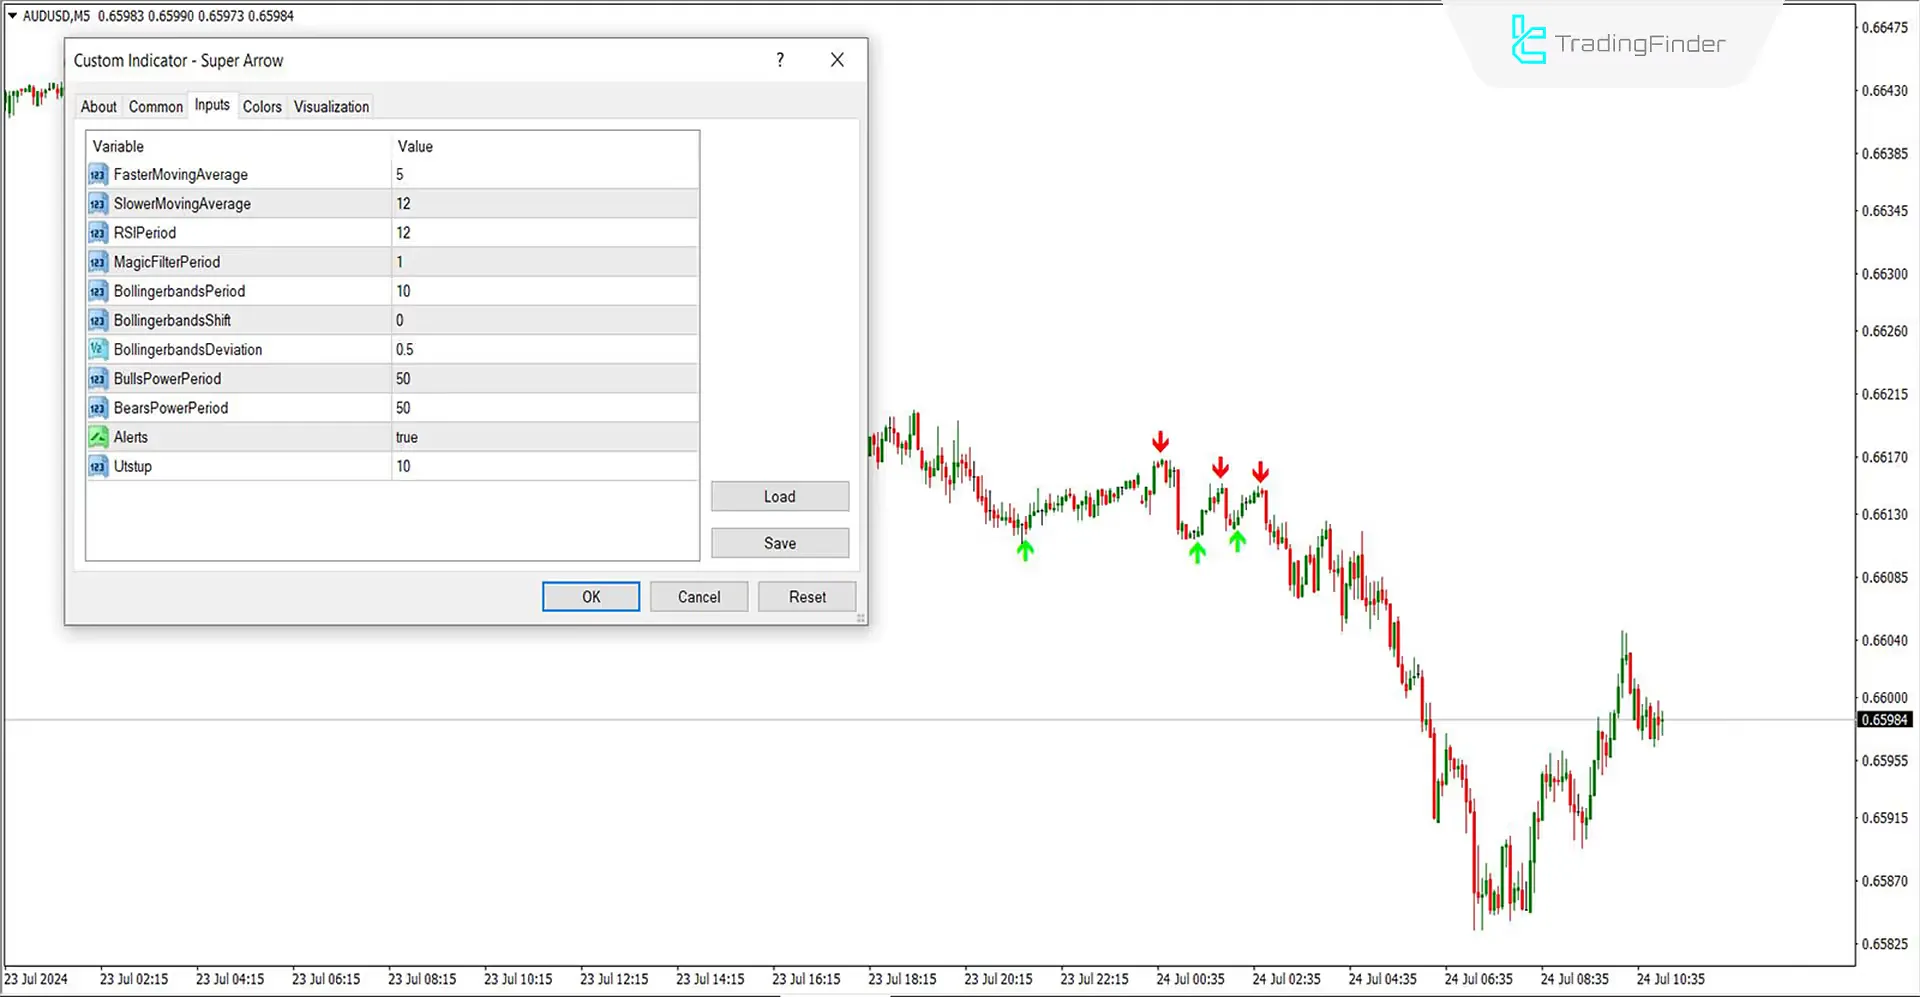
- FasterMovingAverage: Set the fast-moving average to 5;
- SlowerMovingAverage: Set the slow-moving average to 12;
- RSIPeriod: The period for the RSI indicator should be 12;
- MagicFilterPeriod: Set the period for the Magic Filter indicator to 1;
- BollingerbandsPeriod: The period for Bollinger Bands is 10;
- BollingerbandsShift: The shift for Bollinger Bands is set to zero;
- BollingerbandsDeviation: Set the deviation for Bollinger Bands to 0.5;
- BullsPowerPeriod: The period for the Bulls Power indicator is 50;
- BearsPowerPeriod: The period for the Bears Power indicator is 50;
- Alerts: Set the indicator alerts to True;
- Utstup: Set the number to 10.
Conclusion
The Super Arrow indicator is applicable in all trending and sideways markets (Trends-Sideways) and across multiple time frames (Multi-Timeframe).
For example, one can execute a buy trade to utilize this indicator more effectively whenever a buy signal (green arrow) appears at the bottom of a bullish channel.
Conversely, in bearish channels, one can execute a sell trade whenever a sell signal (red arrow) is issued at the top of the channel.
Super Arrow MT4 PDF
Super Arrow MT4 PDF
Click to download Super Arrow MT4 PDFWhat distinguishes the Super Arrow indicator from other indicators?
The Super Arrow indicator is composed of multiple indicators, allowing it to filter out many false signals that other indicators might generate. This makes it more reliable as it combines the strengths of various underlying indicators to provide more accurate and refined trading signals.
Can the Super Arrow indicator provide signals before trend changes?
No, the Super Arrow indicator is considered a lagging indicator and is best used in conjunction with other classic and modern trading strategies. It reacts to market movements rather than predicting them, which makes it ideal for confirming trends rather than anticipating them.
I am using Super Arrow Indicator now. May I know why the notifications alerts are received much later than the arrow symbol shown on the chart ? How do I send a picture to better explain my problem ? Thanks.
Hello, to send a picture and have this issue checked, please contact the support team on Telegram.
Ciao, avvolte vedo che il segnale non esce ma se cambio grafico e poi ritorno in quello che stavo vedendo ,si vede , come posso risolvere questa cosa , e ho letto che avete anche una versione simile per tradingview e come si chiama grazie
Per verificare questo problema, ti consigliamo di contattare il team di supporto.
Very good indicator. Thank you for sharing.


