![Tick Volume Oscillator for MetaTrader 4 Download – Free – [TFlab]](https://cdn.tradingfinder.com/image/334100/4-59-en-tick-volume-oscillator-mt4-1.webp)
![Tick Volume Oscillator for MetaTrader 4 Download – Free – [TFlab] 0](https://cdn.tradingfinder.com/image/334100/4-59-en-tick-volume-oscillator-mt4-1.webp)
![Tick Volume Oscillator for MetaTrader 4 Download – Free – [TFlab] 1](https://cdn.tradingfinder.com/image/334103/4-59-en-tick-volume-oscillator-mt4-2.webp)
![Tick Volume Oscillator for MetaTrader 4 Download – Free – [TFlab] 2](https://cdn.tradingfinder.com/image/334101/4-59-en-tick-volume-oscillator-mt4-3.webp)
![Tick Volume Oscillator for MetaTrader 4 Download – Free – [TFlab] 3](https://cdn.tradingfinder.com/image/334102/4-59-en-tick-volume-oscillator-mt4-4.webp)
The Tick Volume Oscillator is considered one of the effective tools in technical analysis, displaying trading volume using various averaging methods such as SMA, EMA, and SMMA.
This indicator employs the Exponential Moving Average (EMA) to simplify volume changes, with its range centered around the zero line, revealing increases or decreases in trading volume to traders.
Tick Volume Oscillator Specifications
The table below summarizes the key features of this indicator:
|
Indicator Categories:
|
Oscillators MT4 Indicators
Volatility MT4 Indicators
Trading Assist MT4 Indicators
|
|
Platforms:
|
MetaTrader 4 Indicators
|
|
Trading Skills:
|
Intermediate
|
|
Indicator Types:
|
Leading MT4 Indicators
|
|
Timeframe:
|
Multi-Timeframe MT4 Indicators
|
|
Trading Style:
|
Intraday MT4 Indicators
|
|
Trading Instruments:
|
Share Stocks MT4 Indicators
Forward Market MT4 Indicators
Stock Market MT4 Indicators
Cryptocurrency MT4 Indicators
Forex MT4 Indicators
|
Indicator Overview
In this MetaTrader 4 indicators, market direction is determined through the Moving Average line. Additionally, traders can adjust the oscillator's moving average display to linear or histogram mode to easily observe volume changes from low to high or vice versa.
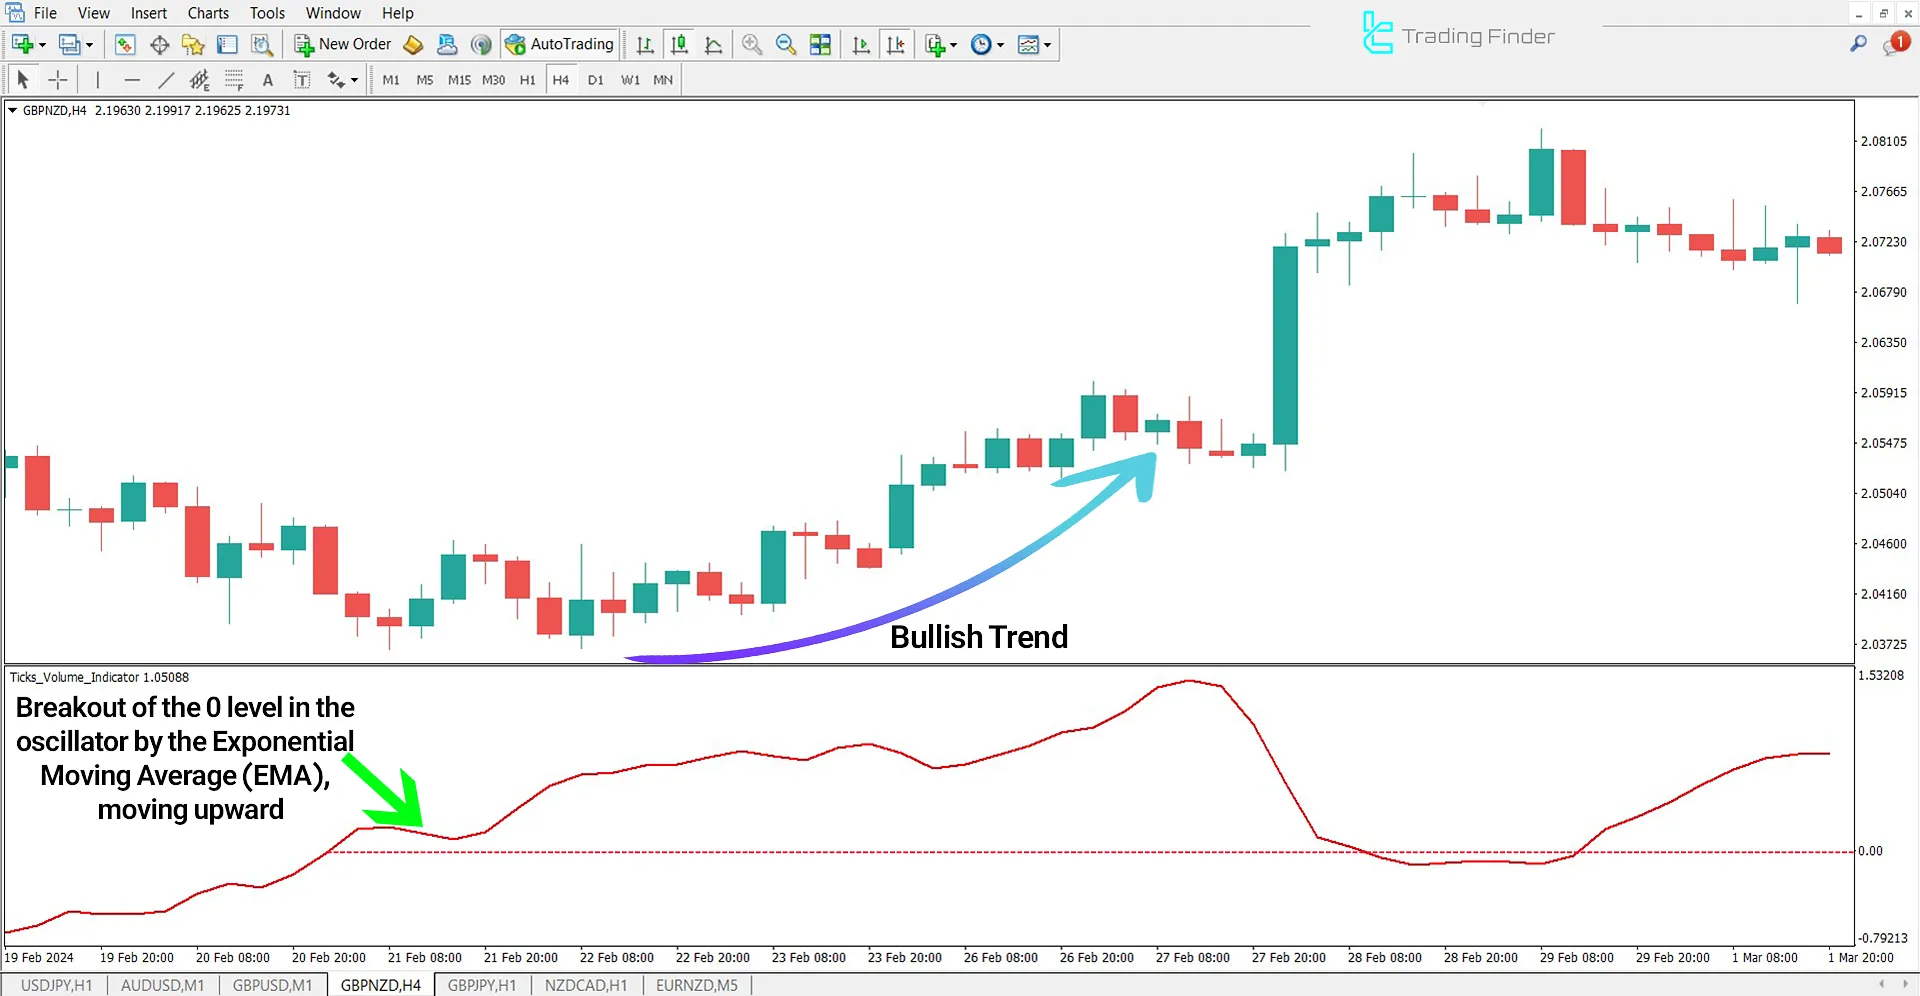
Indicator in a Bullish Trend
In the Tick Volume Oscillator, when the Exponential Moving Average (EMA) line moves above the zero level, this shift signals a bullish trend.
In such cases, trading volume typically increases, indicating strong buying power in the market.

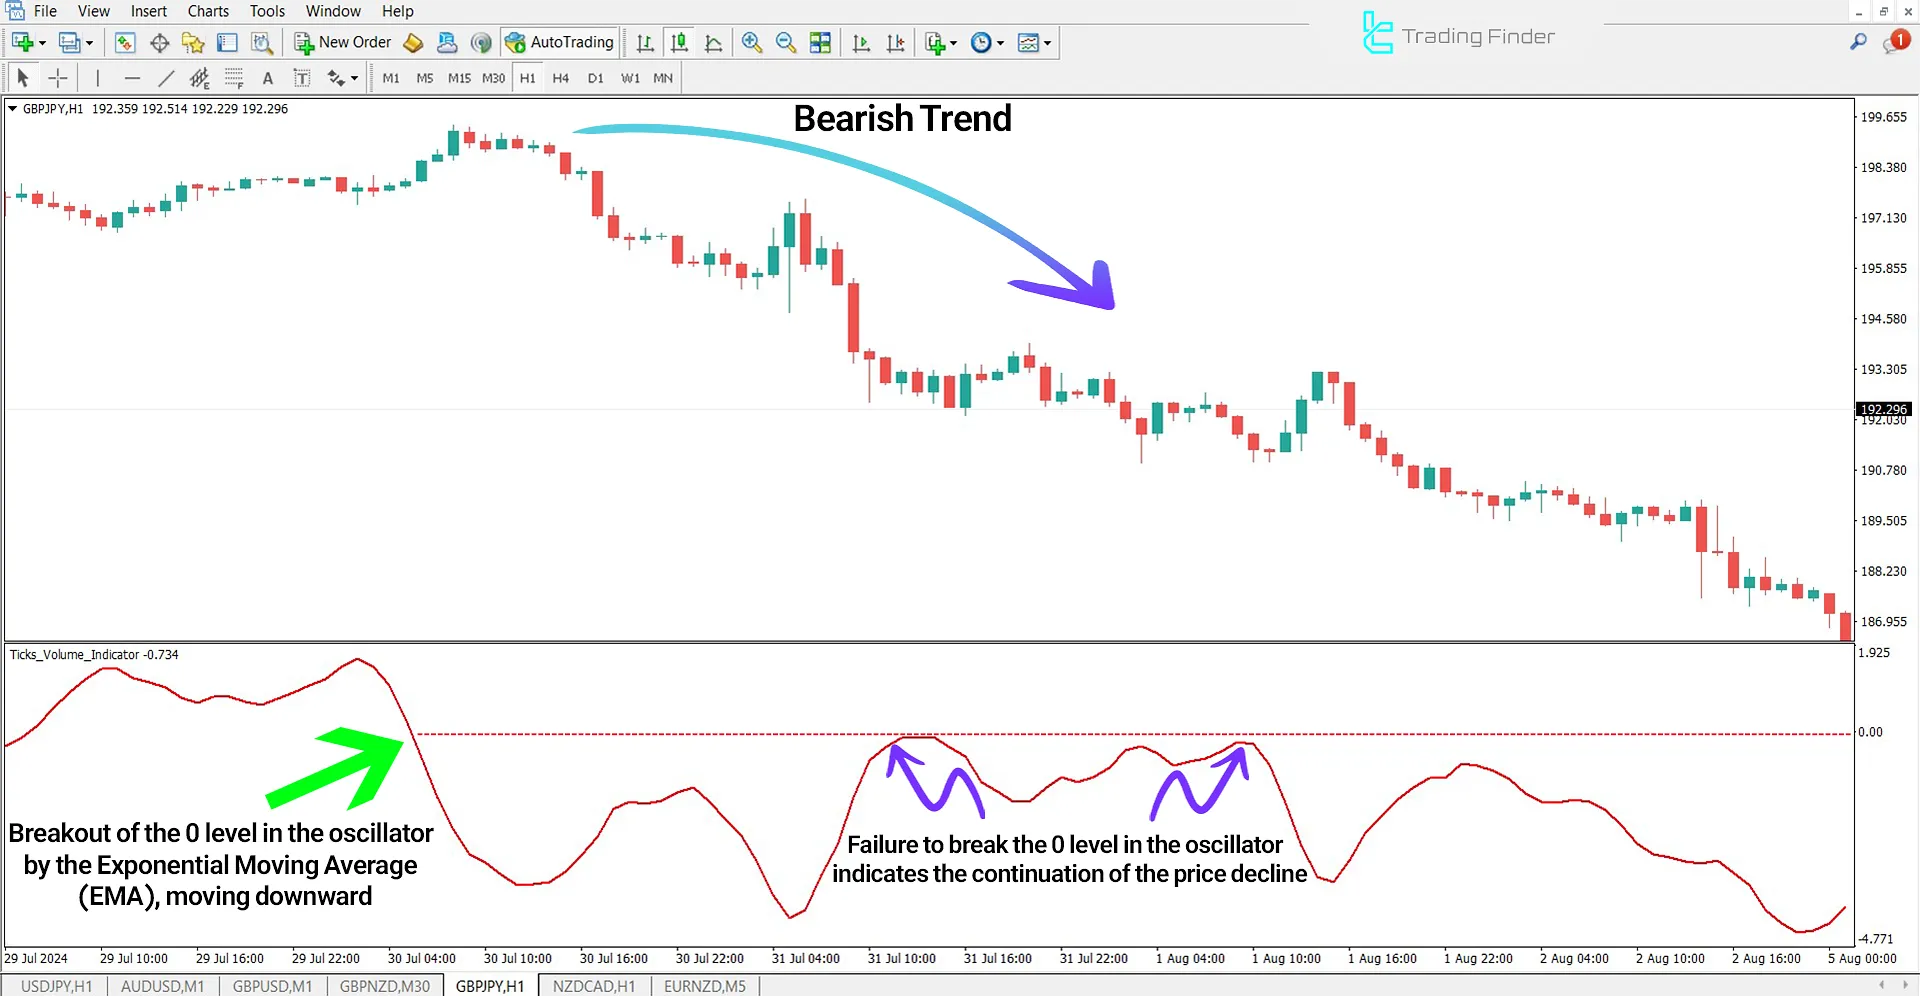
Indicator in a Bearish Trend
In the image below, the Exponential Moving Average (EMA) line remains above zero. As the price declines, the oscillator line breaks below the zero level.
Under these conditions, trading volume decreases, intensifying the bearish trend. These changes indicate strengthening downside momentum and continued price reduction.

Tick Volume Oscillator Settings
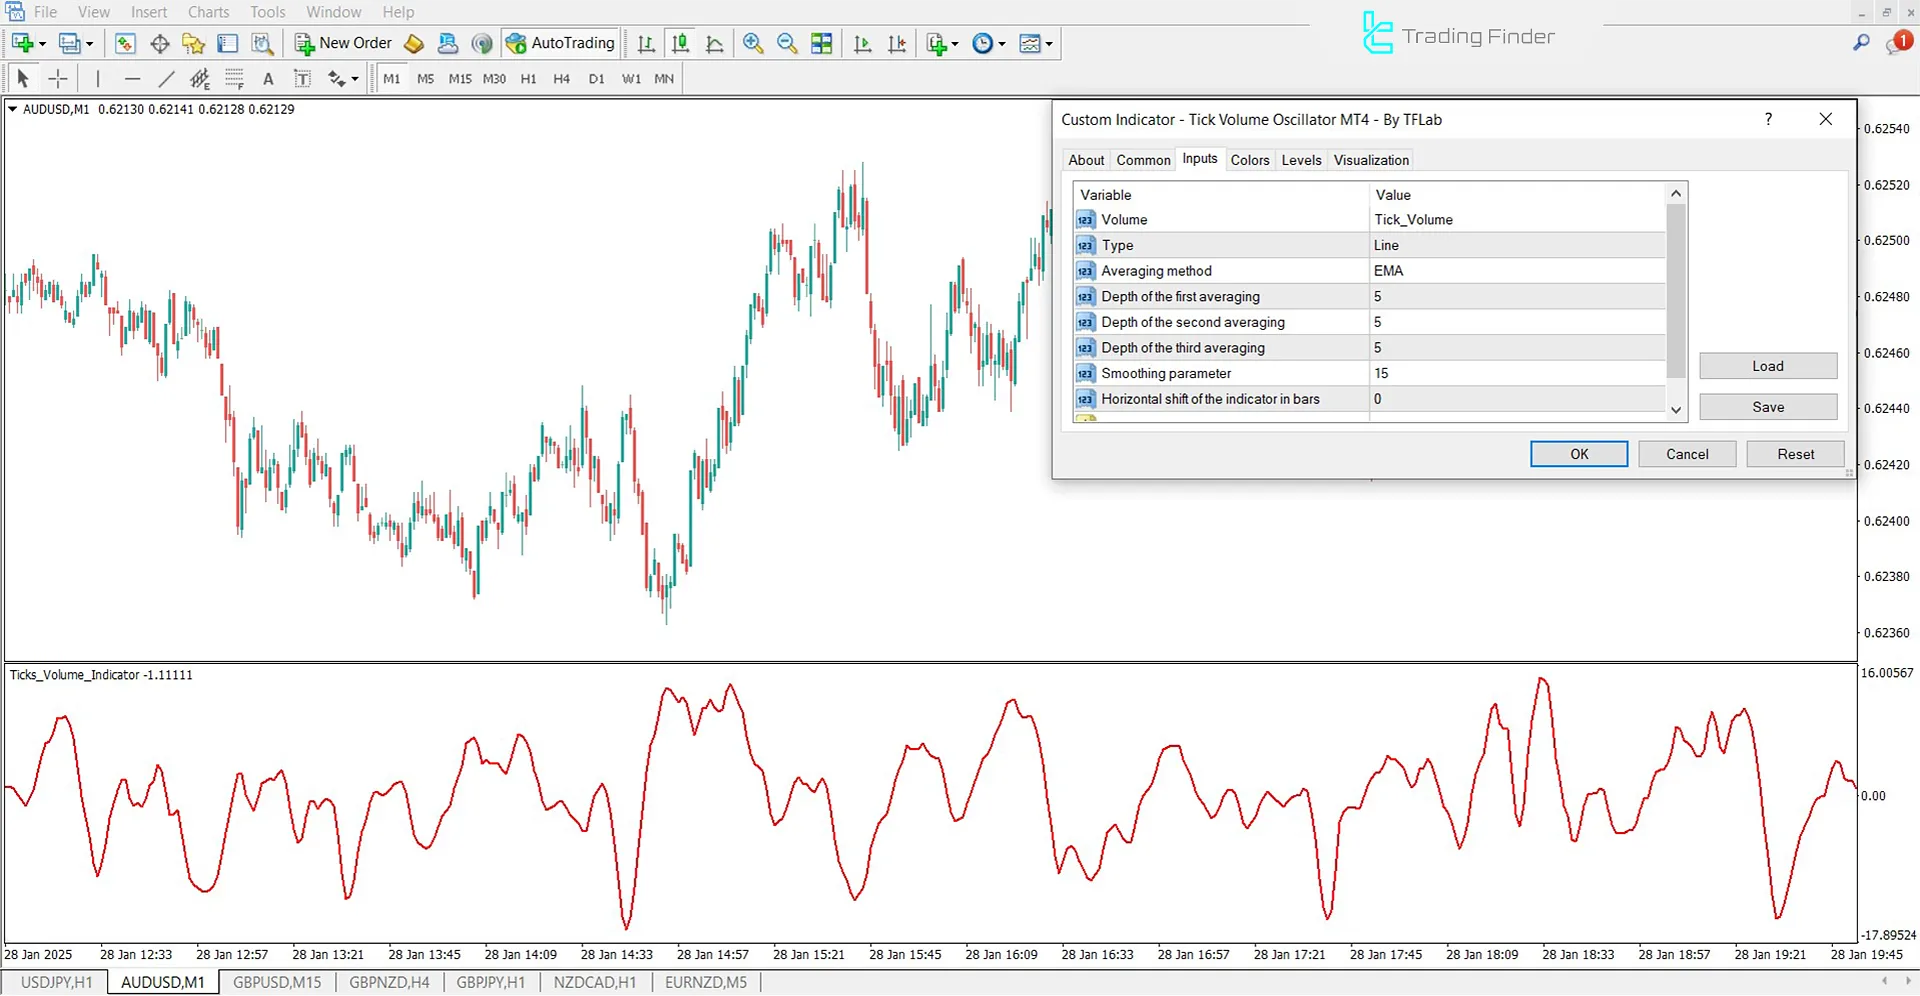
The image below shows the detailed settings panel of this indicator:

- Volume: Trading volume over a specified period
- Type: Data type
- Averaging method: Moving average method
- Depth of the first averaging: Depth of the first averaging stage
- Depth of the second averaging: Depth of the second averaging stage
- Depth of the third averaging: Depth of the third averaging stage
- Smoothing parameter: Smoothing parameter
- Horizontal shift of the indicator in bars: Horizontal shift of the indicator on the chart
Conclusion
The Tick Volume Indicator is an analytical tool on the MetaTrader 4 platform, specifically designed to display trading volume in financial markets such as Forex. Using the Exponential Moving Average (EMA), this indicator dynamically presents volume fluctuations.
It evaluates trading volume per candlestick or bar and smooths the changes through the EMA, offering a clearer insight into market activity.
What is the Tick Volume Oscillator?
The Tick Volume Oscillator (Tick Volume Oscillator) is designed to display trading volume changes in MetaTrader 4.
What information does the Tick Volume Indicator provide?
This indicator shows trading volume fluctuations in an oscillating format using the Exponential Moving Average (EMA) to track market activity.