![Woodies CCI Arrows Indicator for MetaTrader 4 Download - Free - [TF Lab]](https://cdn.tradingfinder.com/image/107799/11-8-en-woodies-cci-arrows-mt4.webp)
![Woodies CCI Arrows Indicator for MetaTrader 4 Download - Free - [TF Lab] 0](https://cdn.tradingfinder.com/image/107799/11-8-en-woodies-cci-arrows-mt4.webp)
![Woodies CCI Arrows Indicator for MetaTrader 4 Download - Free - [TF Lab] 1](https://cdn.tradingfinder.com/image/94540/11-08-en-woodies-cci-arrows-mt4-03.webp)
![Woodies CCI Arrows Indicator for MetaTrader 4 Download - Free - [TF Lab] 2](https://cdn.tradingfinder.com/image/94541/11-08-en-woodies-cci-arrows-mt4-02.webp)
![Woodies CCI Arrows Indicator for MetaTrader 4 Download - Free - [TF Lab] 3](https://cdn.tradingfinder.com/image/94543/11-08-en-woodies-cci-arrows-mt4-04.webp)
On July 6, 2025, in version 2, alert/notification functionality was added to this indicator
The Woodies CCI Arrows Indicator (WCA) is a MetaTrade4 oscillator based on a 14-period Commodity Channel Index (CCI) in MetaTrader 4 (MT4). The WCA indicator is formed by combining several indicators, including the Commodity Channel Index (CCI) and LSMA.
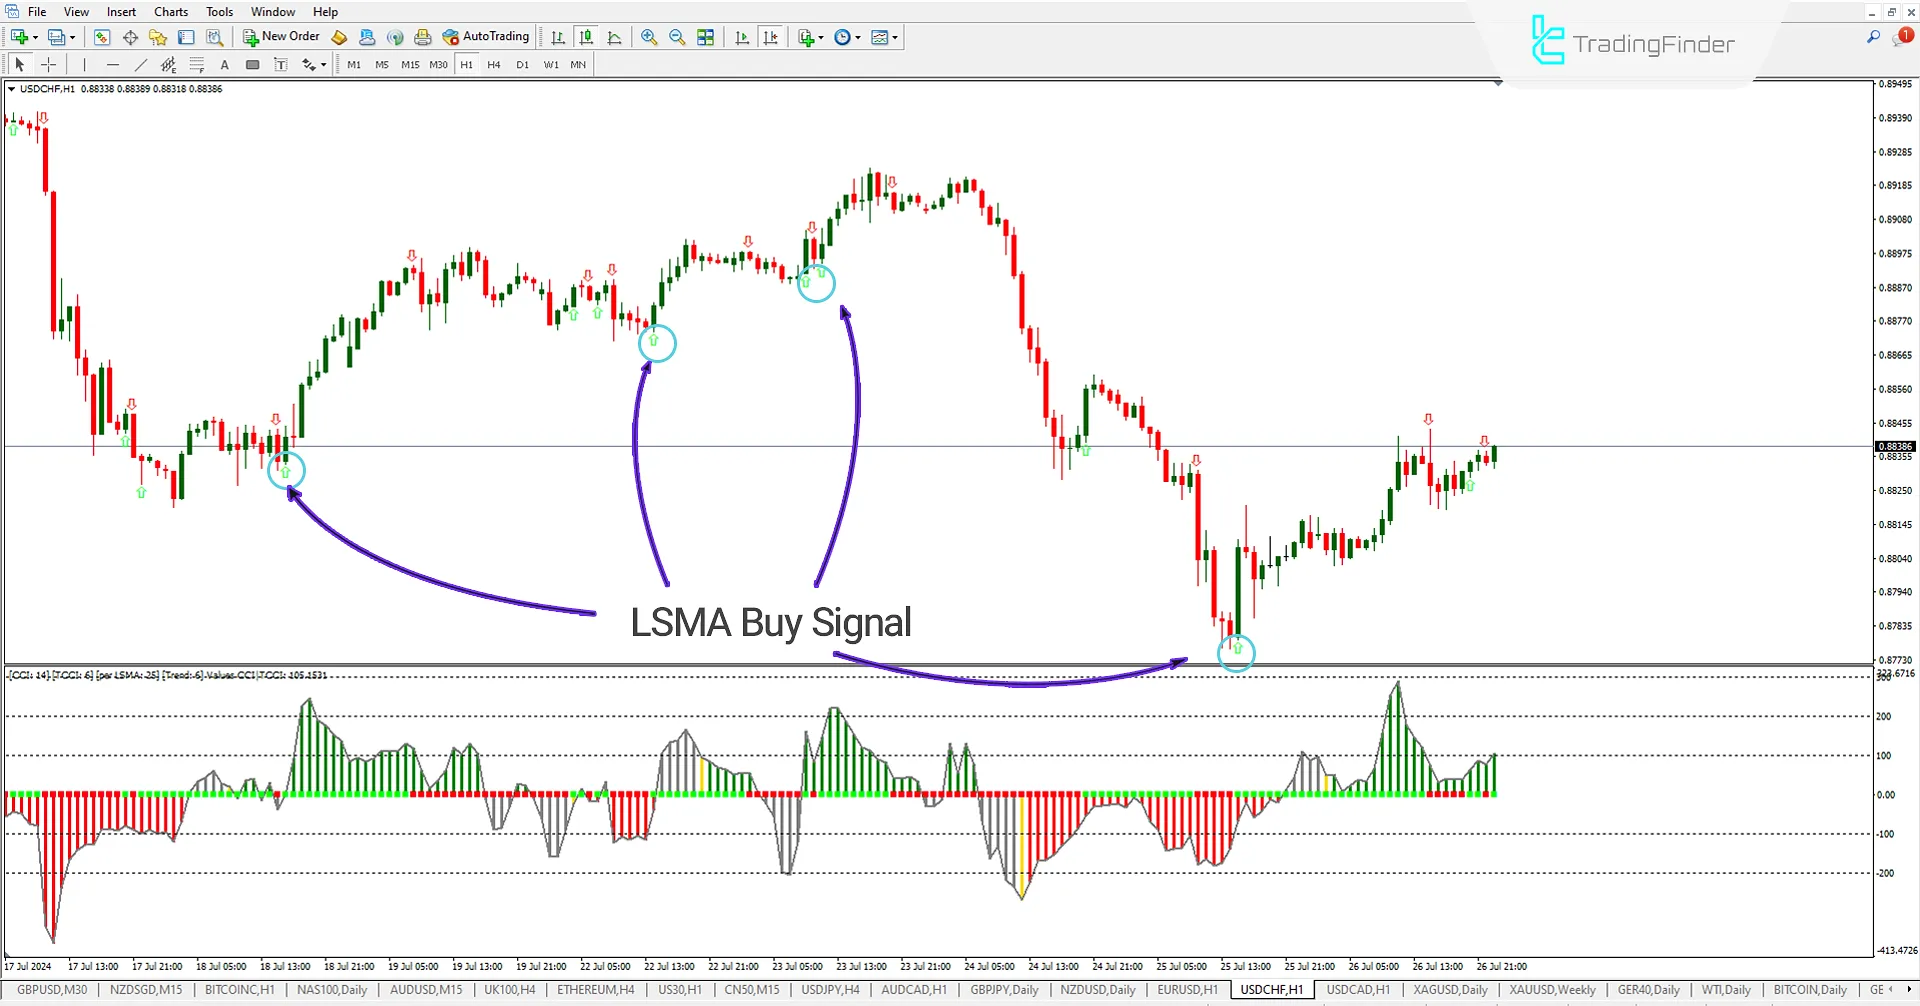
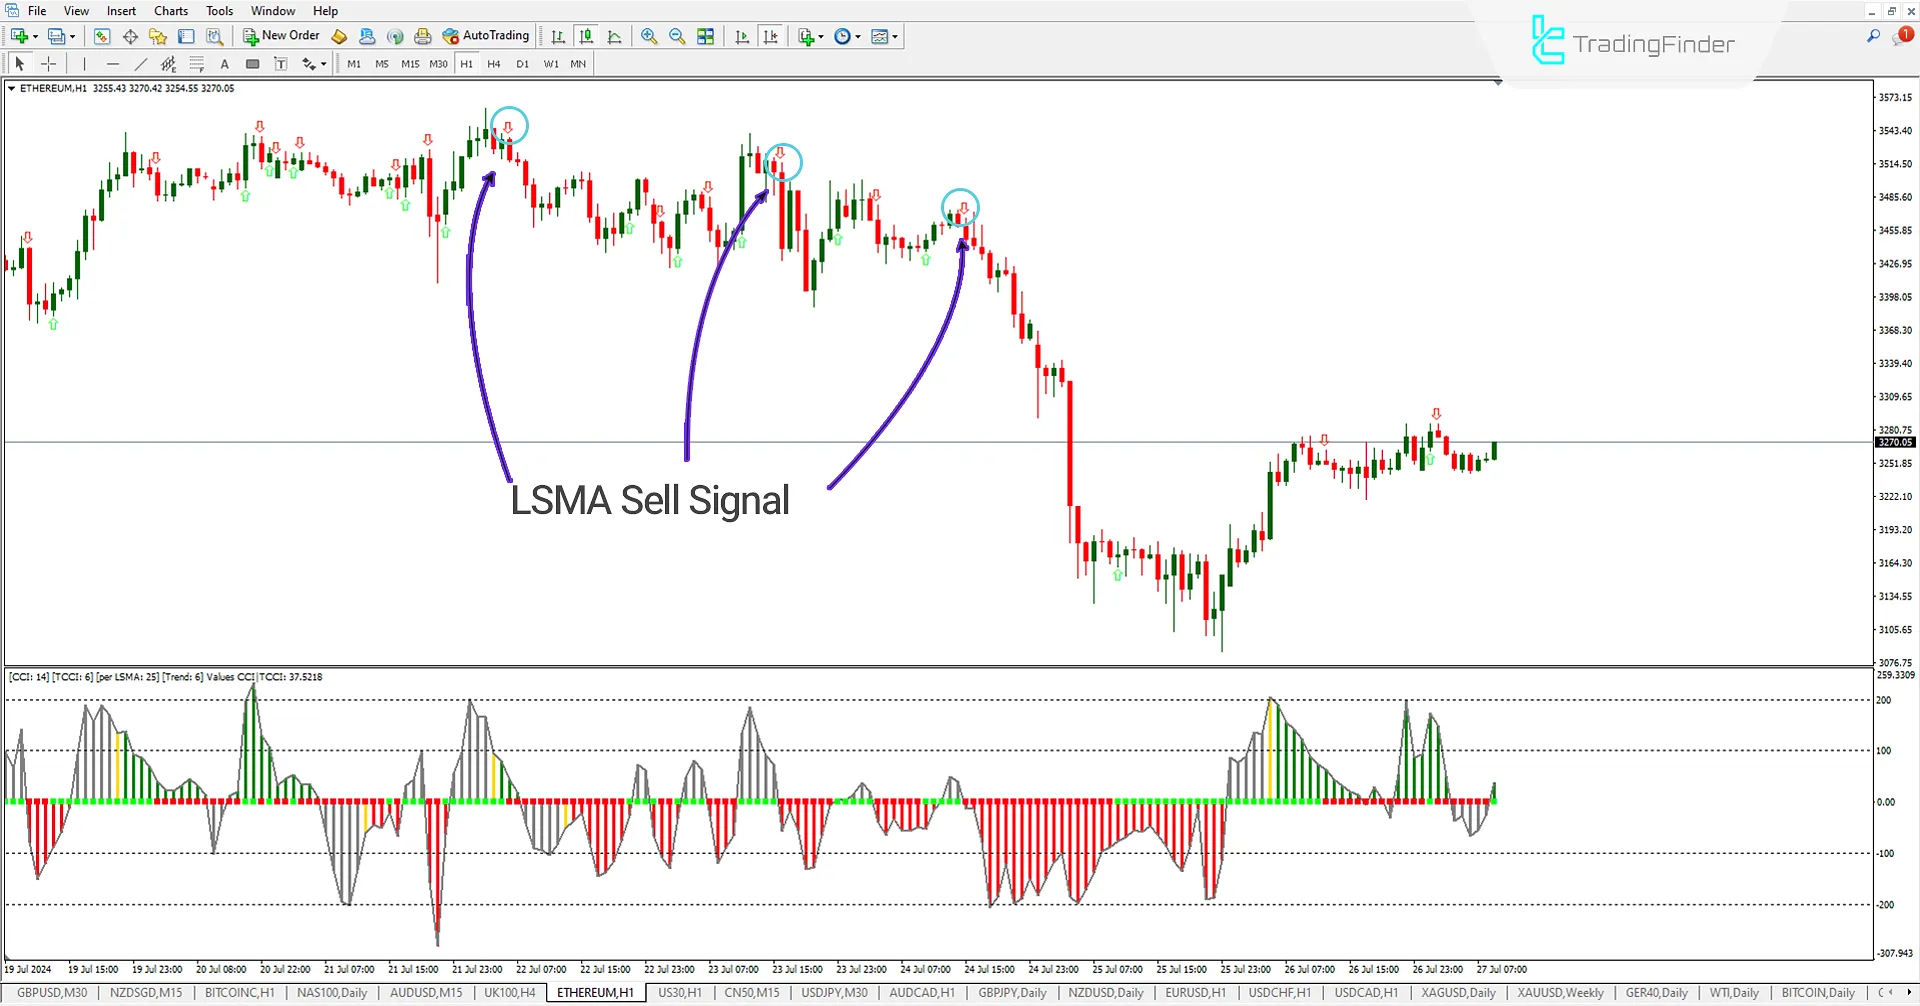
When the CCI is in an uptrend for 6 candles, it is displayed in green, and when it is in a downtrend for 6 candles, it is displayed in red. Green arrows (buy signal) appear on the chart when the closing price of the candles is above the LSMA indicator in the WCA, and red arrows (sell signal) appear when the candle closes below the LSMA indicator.
WCA Indicator Table
|
Indicator Categories:
|
Oscillators MT4 Indicators
Signal & Forecast MT4 Indicators
Currency Strength MT4 Indicators
Trading Assist MT4 Indicators
|
|
Platforms:
|
MetaTrader 4 Indicators
|
|
Trading Skills:
|
Elementary
|
|
Indicator Types:
|
Leading MT4 Indicators
|
|
Timeframe:
|
M1-M5 Time MT4 Indicators
M15-M30 Time MT4 Indicators
H4-H1 Time MT4 Indicators
|
|
Trading Style:
|
Day Trading MT4 Indicators
Intraday MT4 Indicators
Scalper MT4 Indicators
|
|
Trading Instruments:
|
Share Stocks MT4 Indicators
Indices Market MT4 Indicators
Commodity Market MT4 Indicators
Stock Market MT4 Indicators
Forex MT4 Indicators
|
Bullish Signal in the WCA Indicator

In the 1-hour chart of the USD/CHF currency pair, when the candles are above the oscillator line according to the LSMA period settings, the WCA indicator issues a buy signal. Additionally, with other confirmations like the CCI histogram, traders can make better trading decisions for buy transactions.
Bearish Signal in the WCI Indicator

In the 1-hour chart of Ethereum, when the candles are below the oscillator line according to the LSMA period settings, the WCA indicator issues a sell signal. Additionally, with other confirmations like the CCI histogram, traders can make better decisions for sell transactions.
WCA Indicator Settings

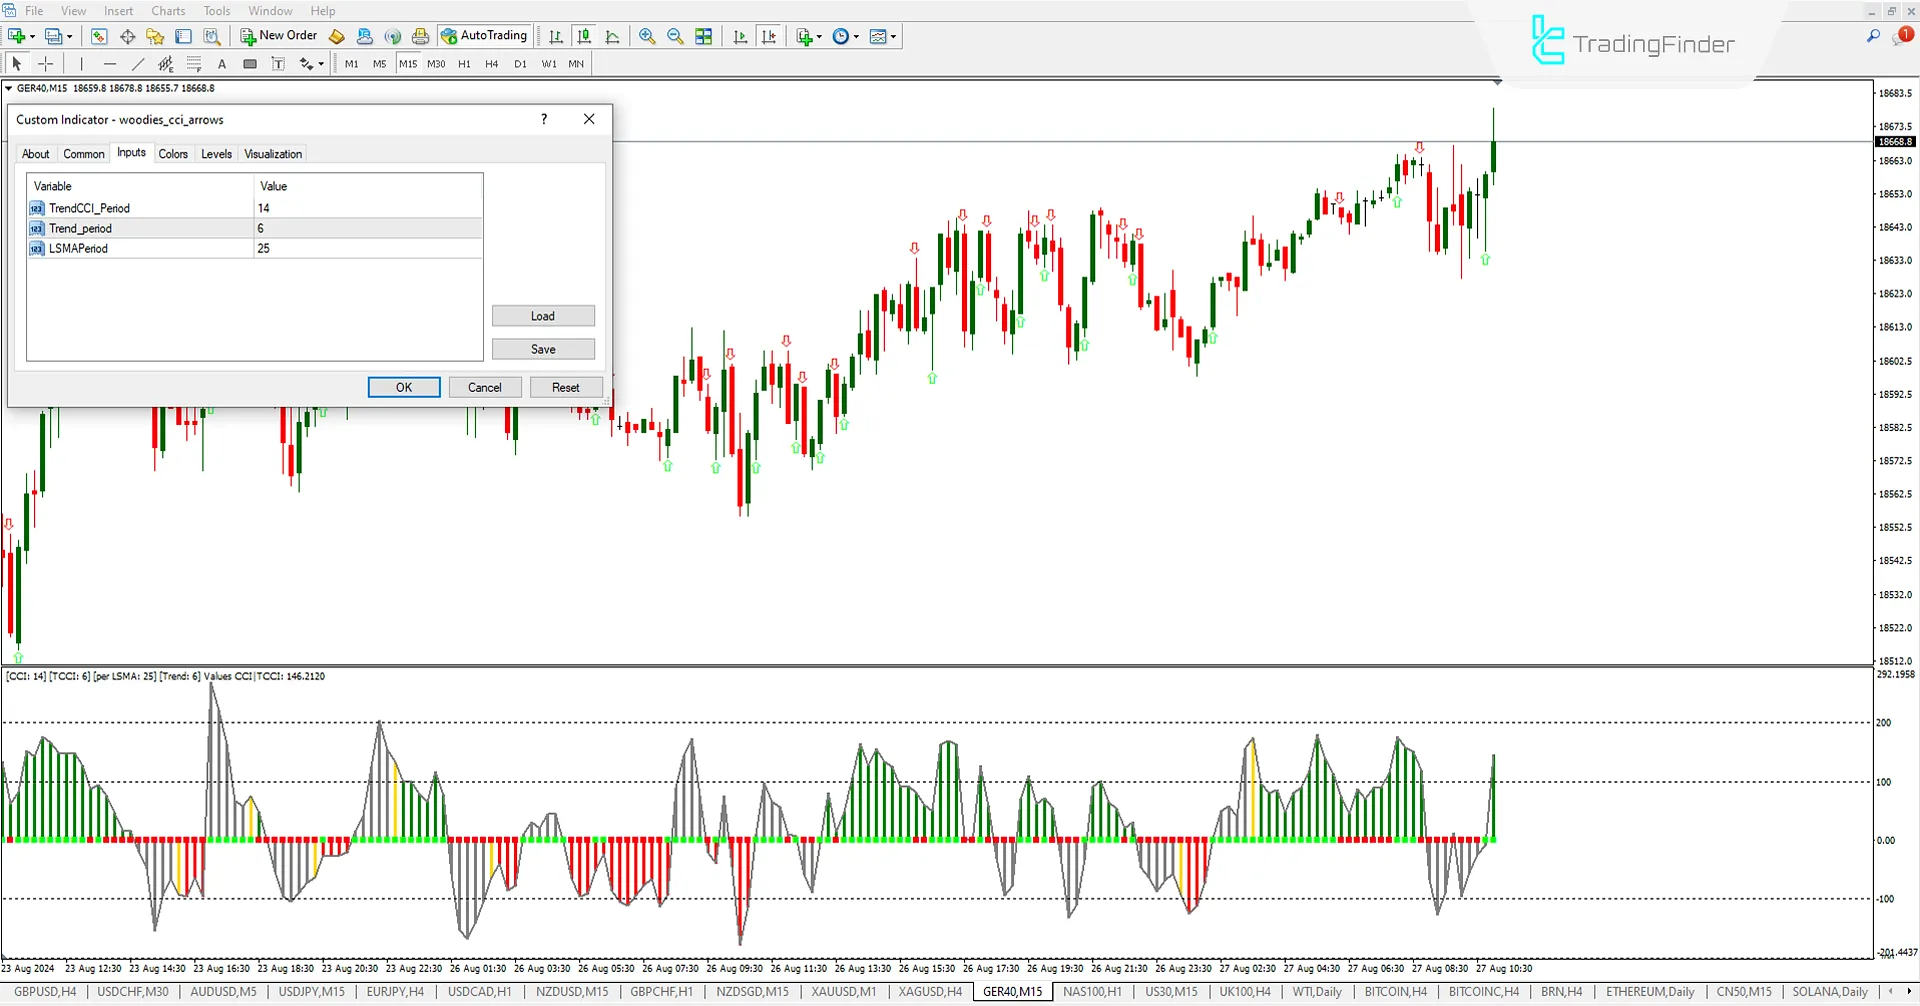
- TrendCCI_Period: CCI Period Settings
- TrendPeriod: Number of Candles until Trend Formation
- LSMAPeriod: LSMA Period
Summary
The Woodies CCI Arrows Indicator (WCA) helps traders identify strong price trends. The WCA MetaTrader4 indicator can be useful in price divergences. When the CCI indicator remains above the 0 level after 6 candles, it indicates the strength of the buyers, and when it is below the 0 level, it indicates the strength of the sellers.
Does the WCA Indicator provide buy and sell signals on the chart for traders?
Yes, this indicator operates based on the LSMA period settings. When it turns green, a buy signal is issued, and when it turns red, a sell signal is issued.
Is the WCA oscillator composed of multiple indicators?
In the MetaTrader 4 version, the WCA indicator consists of two main indicators: a CCI displayed as a histogram and an LSMA displayed as a bar and signal on the chart. However, in the MetaTrader 5 version, two additional indicators are included: a TURBO CCI and an EMA. Traders can visit the top of the page to download the MetaTrader 5 version.