


![Xmaster (XHMaster) Formula Free MT4 Indicator Download 2025 [Signals]](https://cdn.tradingfinder.com/image/190696/2-2-en-xmaster-formula-mt4-1.webp)
![Xmaster (XHMaster) Formula Free MT4 Indicator Download 2025 [Signals] 1](https://cdn.tradingfinder.com/image/190697/2-2-en-xmaster-formula-mt4-2.webp)
![Xmaster (XHMaster) Formula Free MT4 Indicator Download 2025 [Signals] 2](https://cdn.tradingfinder.com/image/190698/2-2-en-xmaster-formula-mt4-3.webp)
![Xmaster (XHMaster) Formula Free MT4 Indicator Download 2025 [Signals] 3](https://cdn.tradingfinder.com/image/190699/2-2-en-xmaster-formula-mt4-4.webp)
The Xmaster Formula Indicator is a combination of the Moving Average and MACD indicators. This tool enhances the ability to identify both the strength and direction of a trend with greater accuracy.
The Xmaster Indicator generates entry signals using two arrows one green and one red and is highly effective for short-term and medium-term analyses, especially in the Forex market. This continuation and reversal indicator is multi-timeframe and applicable to all markets.
What is the Xmaster Formula Indicator in Forex?
The Xmaster Formula Indicator (Xmaster Formula) or “XHMaster” is an analytical tool based on the calculations of overlapping moving averages and oscillating momentum indicators, designed to measure trend strength and identify market phase shifts.
Within the structure of this indicator, a hybrid algorithm is used to calculate the price movement angle, volatility deviation, and momentum oscillator synchronisation, in order to generate confirmation signals within overbought or oversold zones.
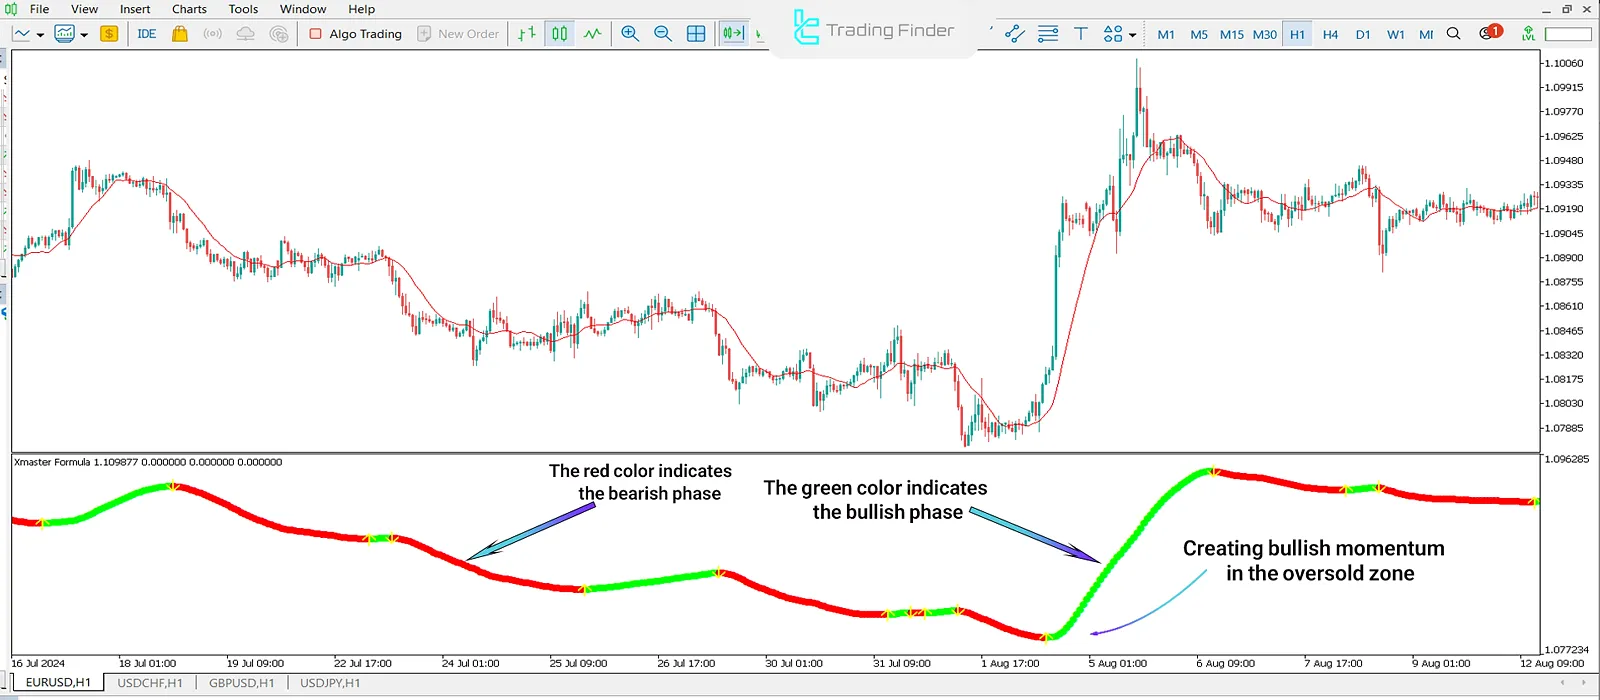
The indicator’s output is usually displayed as continuous lines on the chart where green represents a stable bullish phase, and red indicates trend weakness or the beginning of a bearish phase. The Xmaster Formula Indicator is also compatible with TradingView.
A specialist from the TradingFinder development team said:
"Some users mistakenly type XHmaster instead of Xmaster when searching for the indicator. This mistake has caused difficulties for some individuals in finding accurate information. To avoid this confusion, users should ensure they search using the correct name, which is Xmaster."
Xmaster Formula Specifications Table
The specifications table includes general information about the performance of the Xmaster formula indicator:
Indicator Categories: | Oscillators MT4 Indicators Volatility MT4 Indicators Bands & Channels MT4 Indicators |
Platforms: | MetaTrader 4 Indicators |
Trading Skills: | Elementary |
Indicator Types: | Reversal MT4 Indicators |
Timeframe: | Multi-Timeframe MT4 Indicators |
Trading Style: | Intraday MT4 Indicators |
Trading Instruments: | Share Stocks MT4 Indicators Forward Market MT4 Indicators Indices Market MT4 Indicators Commodity Market MT4 Indicators Stock Market MT4 Indicators Cryptocurrency MT4 Indicators Forex MT4 Indicators |
Xmaster Formula Code
Here is a part of XMaster (XHMaster) formula code for MT4:
The provided code is intended for educational purposes to demonstrate concepts and logic, and is not a final or ready-to-use version.
//+------------------------------------------------------------------+
//| XMaster Formula |
//| Copyright © tradingfinder.com 2023 -2025 |
//+------------------------------------------------------------------+
#property copyright "tradingfinder.com"
#property link      "https://tradingfinder.com/products/indicators/mt4/"
#property version   "1.05"
#property indicator_separate_window
#property indicator_buffers 5
#property indicator_color1 Lime
#property indicator_color2 Red
#property indicator_color3 Red
#property indicator_color4 Yellow
#property indicator_color5 Yellow

extern bool alert_on = true;
extern bool alert_sound = false;
extern bool alert_email = false;

int fast_period = 40;
int arrow_gap = 200;
int ma_method = MODE_SMMA;
int applied_price = PRICE_LOW;

double red_line[], green_line[], line_buffer[], up_arrow[], down_arrow[];
datetime last_alert;

// Alerts on trend change
void manage_alert(string dir, double tp, double sl, double price) {
   if (Time[0] == last_alert) return;
   last_alert = Time[0];
   string msg = "XMASTER FORMULA " + dir + " Price " + DoubleToStr(price, 4);
   if (tp != 0) msg += ", TakeProfit " + DoubleToStr(tp, 4);
   if (sl != 0) msg += ", StopLoss " + DoubleToStr(sl, 4);
   if (alert_on) Alert(msg + " " + Symbol() + ", " + Period() + " min");
   if (alert_sound) PlaySound("alert.wav");
   if (alert_email) SendMail("Xmaster Formula", msg);
}

int init() {
   IndicatorBuffers(5);
   SetIndexBuffer(0, red_line);     SetIndexStyle(0, DRAW_ARROW); SetIndexArrow(0, 159);
   SetIndexBuffer(1, green_line);   SetIndexStyle(1, DRAW_ARROW); SetIndexArrow(1, 108);
   SetIndexBuffer(2, line_buffer);  SetIndexStyle(2, DRAW_NONE);
   SetIndexBuffer(3, up_arrow);     SetIndexStyle(3, DRAW_ARROW); SetIndexArrow(3, 226);
   SetIndexBuffer(4, down_arrow);   SetIndexStyle(4, DRAW_ARROW); SetIndexArrow(4, 225);
   IndicatorShortName("XMASTER FORMULA");
   return(0);
}

int deinit() { return(0); }

// MA wrapper
double ma_value(int shift, int period) {
   return iMA(NULL, 0, period, 0, ma_method, applied_price, shift);
}

int start() {
   int i, counted = IndicatorCounted();
   if (counted < 0) return (-1);
   int sqrt_period = MathFloor(MathSqrt(fast_period));
   int short_period = MathFloor(fast_period / 1.9);
   int total = Bars - counted + fast_period + 1;
   if (total > Bars) total = Bars;

   double trend_dir[], tmp_ma[];
   ArraySetAsSeries(trend_dir, true); ArrayResize(trend_dir, total);
   ArraySetAsSeries(tmp_ma, true); ArrayResize(tmp_ma, total);

   // Compute double smoothed MA
   for (i = 0; i < total; i++)
      trend_dir[i] = 2.0 * ma_value(i, short_period) - ma_value(i, fast_period);
   for (i = 0; i < total - fast_period; i++)
      line_buffer[i] = iMAOnArray(trend_dir, 0, sqrt_period, 0, ma_method, i);

   // Detect trend direction and signal
   for (i = total - fast_period; i > 0; i--) {
      tmp_ma[i] = tmp_ma[i + 1];
      if (line_buffer[i] > line_buffer[i + 1]) tmp_ma[i] = 1;
      else if (line_buffer[i] < line_buffer[i + 1]) tmp_ma[i] = -1;

      if (tmp_ma[i] > 0) {
         red_line[i] = line_buffer[i];
         green_line[i] = EMPTY_VALUE;
         if (tmp_ma[i + 1] < 0  i == 1)
            manage_alert("UP Buy", 0, Close[1] - arrow_gap * Point, Close[1]);
      } else if (tmp_ma[i] < 0) {
         green_line[i] = line_buffer[i];
         red_line[i] = EMPTY_VALUE;
         if (tmp_ma[i + 1] > 0  i == 1)
            manage_alert("DOWN Sell", 0, Close[1] + arrow_gap * Point, Close[1]);
      }
   }

   // Show yellow arrow at signal transition
   for (i = 0; i < total - 1; i++) {
      if (green_line[i + 1] == EMPTY_VALUE  green_line[i] != EMPTY_VALUE)
         up_arrow[i] = green_line[i];
      if (red_line[i + 1] == EMPTY_VALUE  red_line[i] != EMPTY_VALUE)
         down_arrow[i] = red_line[i];
   }
   return(0);
}Advantages and Disadvantages of the Xmaster Formula Indicator
Focusing on signal efficiency, accuracy in volatile conditions, and reliability across different timeframes are the main features of this indicator.
The table below shows the advantages and disadvantages of the Xmaster Formula Indicator:
Advantages | Disadvantages |
Fast trend reversal detection using adaptive averages and volatility filters | Possibility of false signals in highly volatile markets |
Green and red colour schemes to distinguish between bullish and bearish phases | Volume data is not included in the calculations |
Accurate performance on 5- and 15-minute timeframes for scalping strategies | Slower response and lower accuracy on higher timeframes |
Combination of momentum and trend direction to increase signal validity | Requires complementary tools to determine exit points |
Adjustable signal sensitivity and adaptability to various market conditions | Possible rewriting of past data in some versions |
How the Xmaster Formula Indicator Works in MetaTrader 4?
The Xmaster Formula Indicator is designed based on market direction and momentum analysis, processing price behaviour in real time through a combination of filters.
Its operational structure is step-based and algorithmic, enabling the detection of trend changes with minimal delay. You can find more information about Xmaster tuturial and guidelines in the infography below:
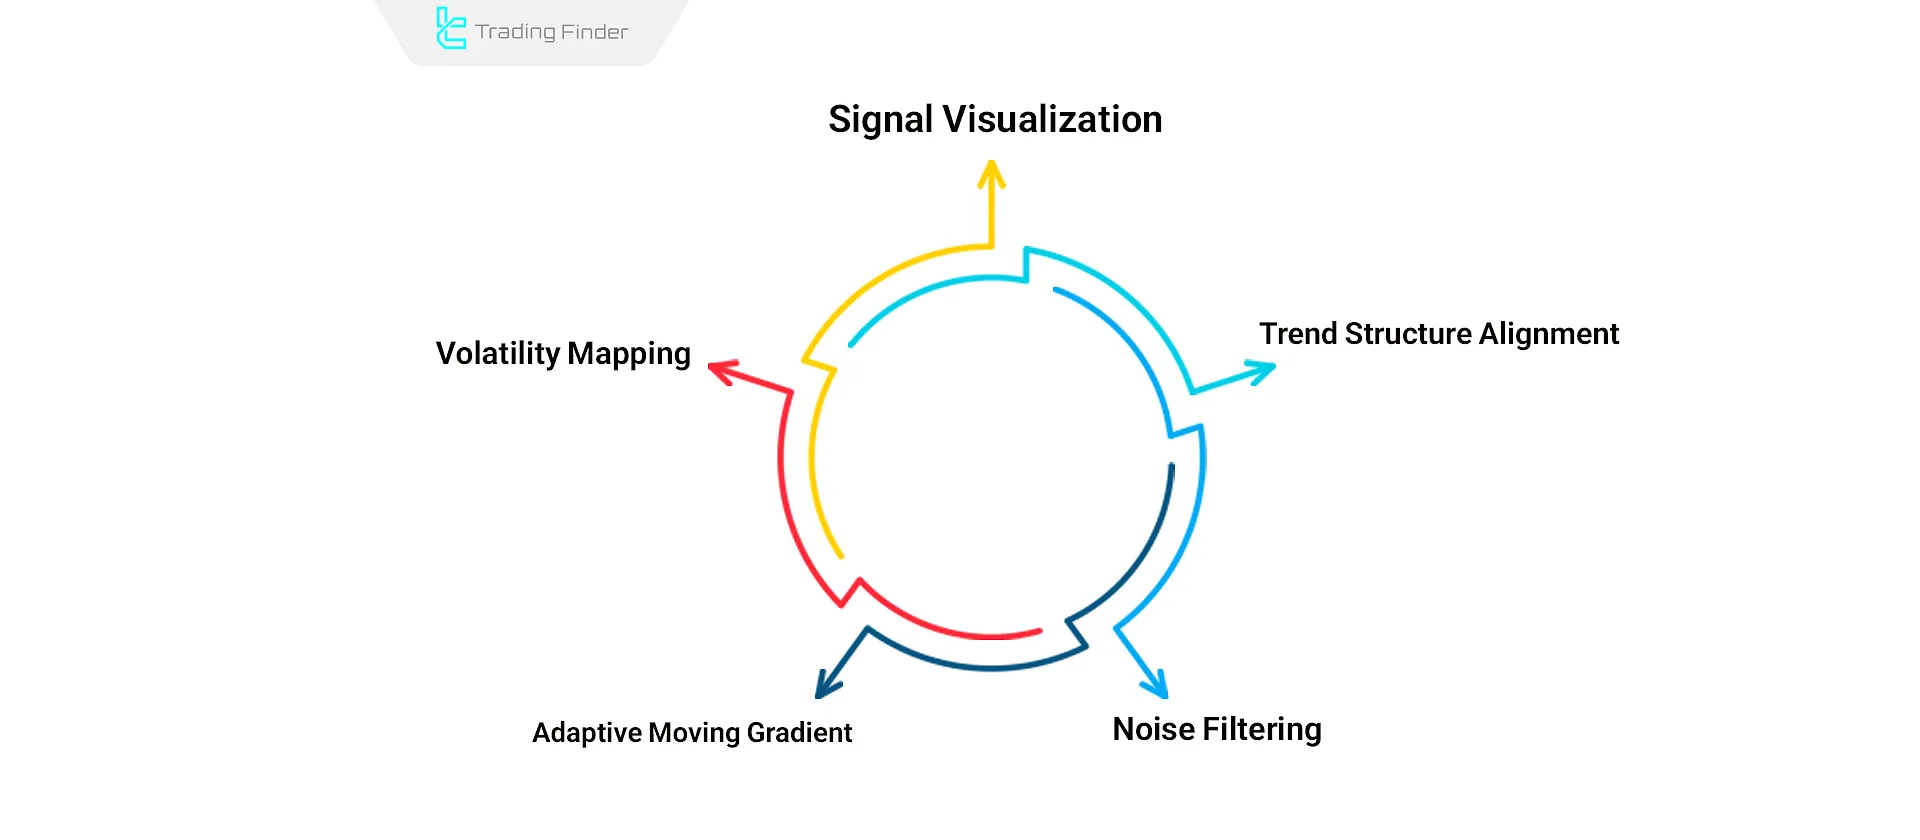
Initial Volatility Mapping
The indicator first measures the range of recent market fluctuations and sets the average range of price changes as the calculation reference.
Adaptive Moving Gradient Calculation
At this stage, the slope of price movement is calculated using live weighted averages. If the movement angle exceeds the defined threshold, the indicator records a phase change (from bearish to bullish or vice versa).
Noise Filtering
To prevent false signals, abnormal data from short-term spikes are removed using standard deviation filters.
Trend Structure Alignment
The indicator aligns the dominant market direction with the latest medium-term movement data to avoid issuing counter-trend signals.
Signal Visualization
The final result is displayed in colour on the chart:
- Green: Bullish phase or positive momentum
- Red: Bearish phase or trend weakness
- Yellow or grey: Neutral zone or price consolidation
In summary, Xmaster combines direction, momentum, and volatility deviation analysis to convert current market conditions into simple, understandable signals.
Trading Strategy Using the Xmaster Formula Indicator
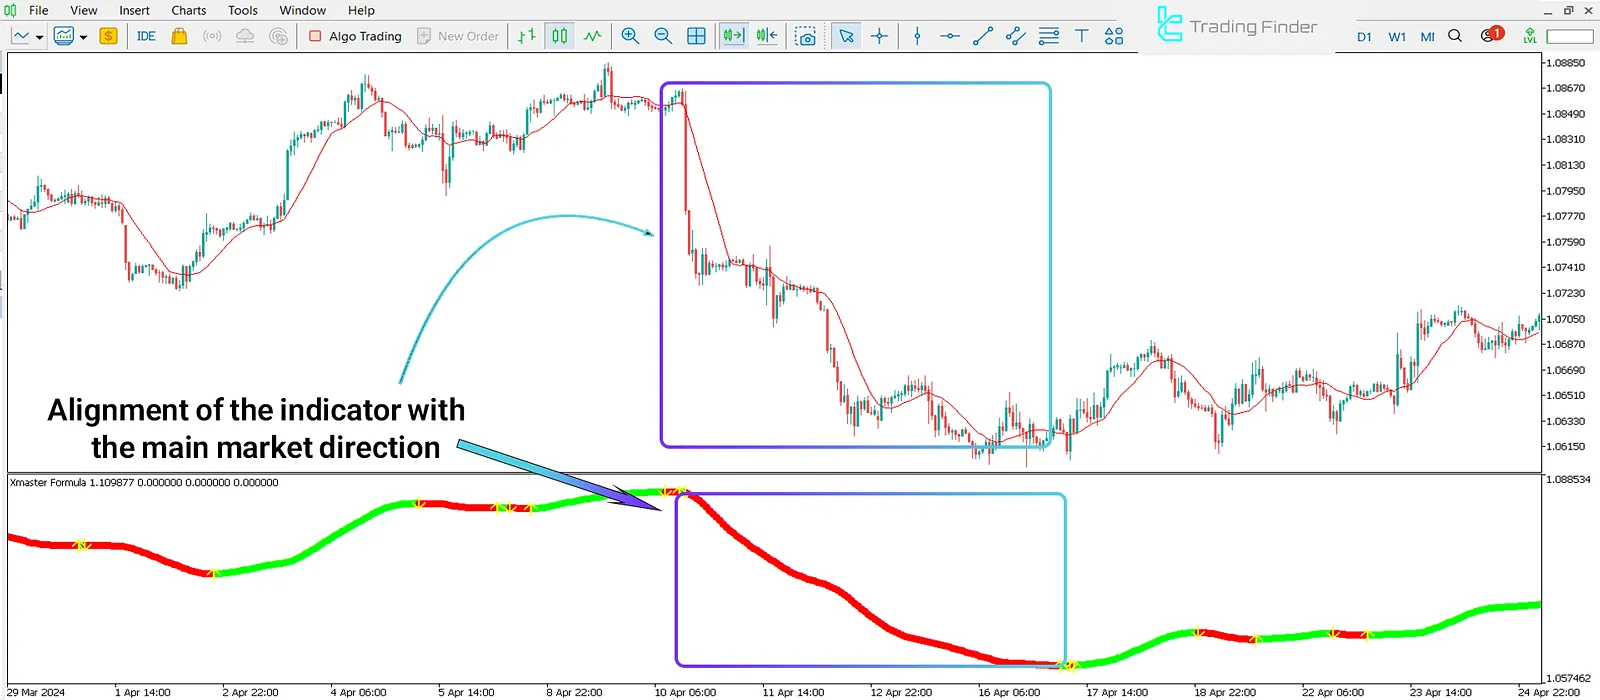
The trading strategy based on the Xmaster Formula Indicator is designed around aligning trend, momentum, and technical confirmation signals.
In this method, the overall market direction is first determined through a trend filter (such as an adaptive moving average) to avoid entering trades against the main trend.
Then, the trader enters a position only when the signal from Xmaster aligns with the current trend direction and is confirmed by an indicator such as the Relative Strength Index (RSI).
For risk management, the stop loss is placed behind the most recent price reversal zone to protect against short-term fluctuations.
Profit targets, depending on the trader’s style, can be set based on a fixed risk-to-reward ratio, support and resistance levels, or a trailing stop.
This analytical structure allows traders to enter the market only when the trend, momentum, and indicator signals converge in the same direction, increasing accuracy and consistency of results.
No-Repaint Signal in the Xmaster Formula Indicator
One of the main advantages of the Xmaster Formula Indicator is its no-repaint structure. In this indicator, signals do not change or disappear once they appear on the chart.
This feature ensures that indicator data remain stable, especially in situations requiring real-time decision-making.
The non-repaint nature of this tool allows for more precise real-time analysis of price behaviour and prevents errors caused by signal changes in the past.
Therefore, traders can determine entry and exit points with greater confidence based on the indicator’s stable data.
Combining this feature of Xmaster with confirmation indicators such as RSI or Moving Averages enhances analysis accuracy and reduces the likelihood of false signals.
This approach transforms decision-making from a reactive process into one based on multiple confirmations.
Download and Install the Xmaster Formula Indicator
To download and install the Xmaster Formula Indicator from the Trading Finder website, first visit the site and navigate to the Indicators section. Then, select the Xmaster Formula Indicator from the list. After that, you can freely download and access other available versions of the Xmaster Formula Indicator:
Step-by-Step Installation Guide
Installing the Xmaster Formula Indicator does not require any complex configuration. With just a few simple steps inside the MetaTrader platform, you can download and activate it directly on your chart to display live analytical signals. Step-by-step guide to installing the Xmaster Formula Indicator in MetaTrader:
- Download the indicator file;
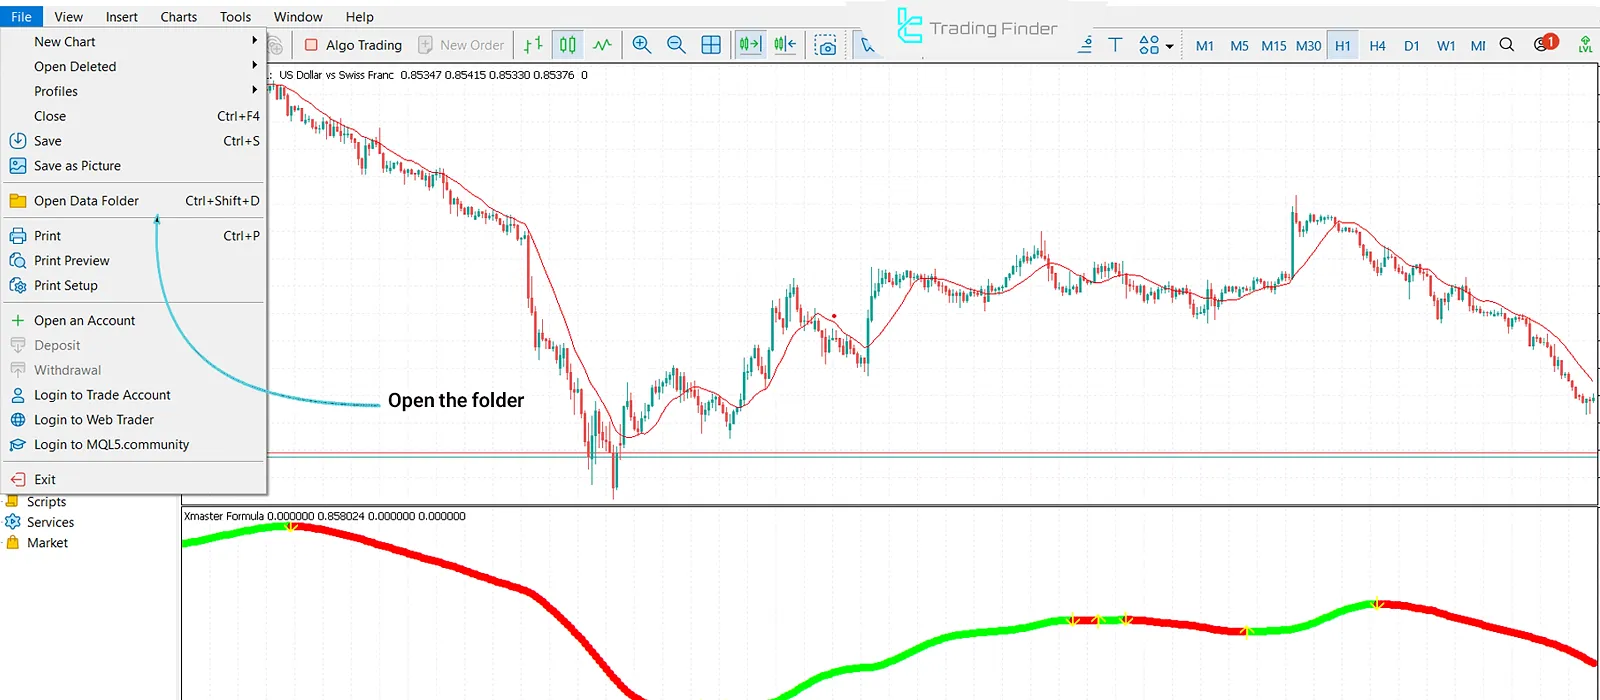
- In MetaTrader, go to the “File” tab at the top of the window;
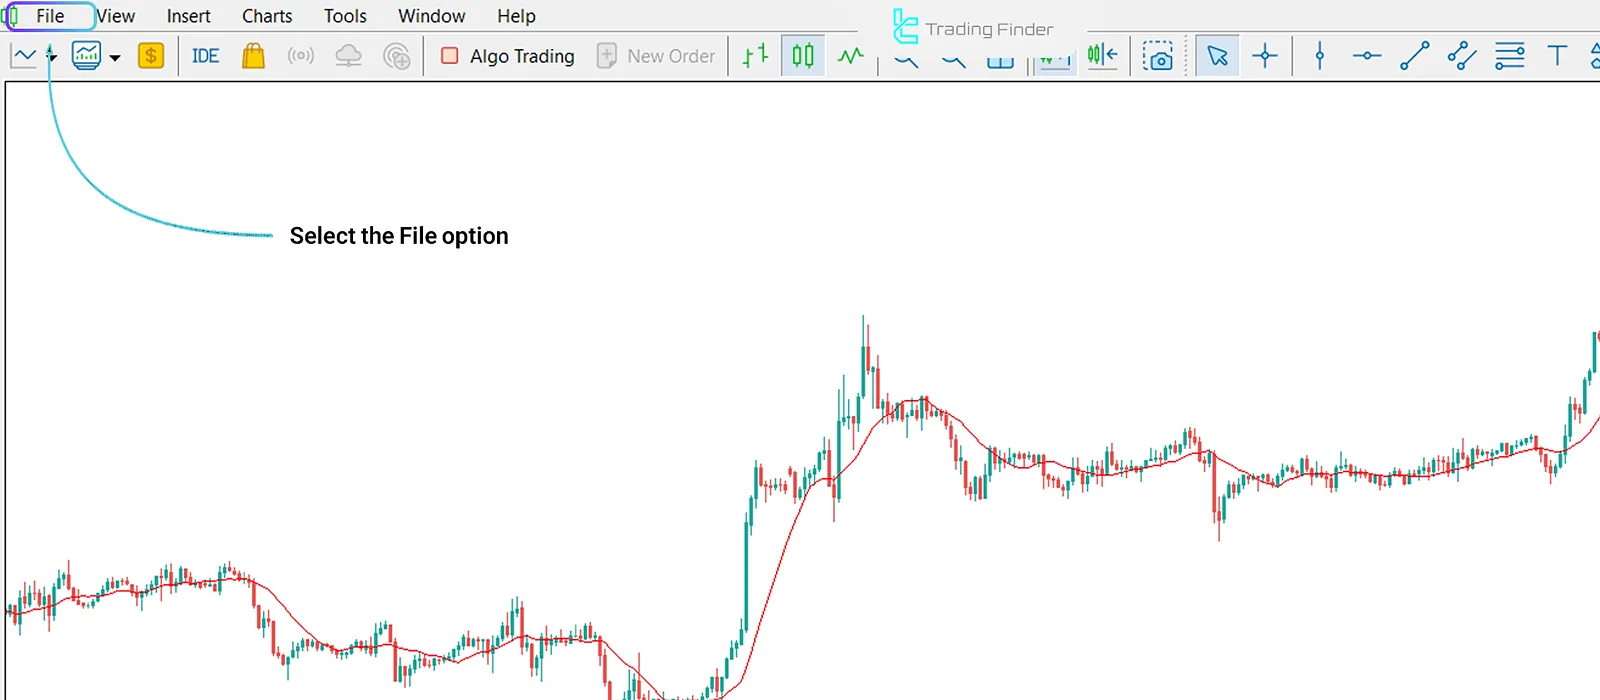
Choosing the “File” option during the installation of the Xmaster Formula Indicator - Select the “Open data folder” option;
Selecting “Open data folder” to install the Xmaster Formula Indicator - Select the “MQL4” folder, then click on the “Indicators” folder. The indicator file should be copied there;
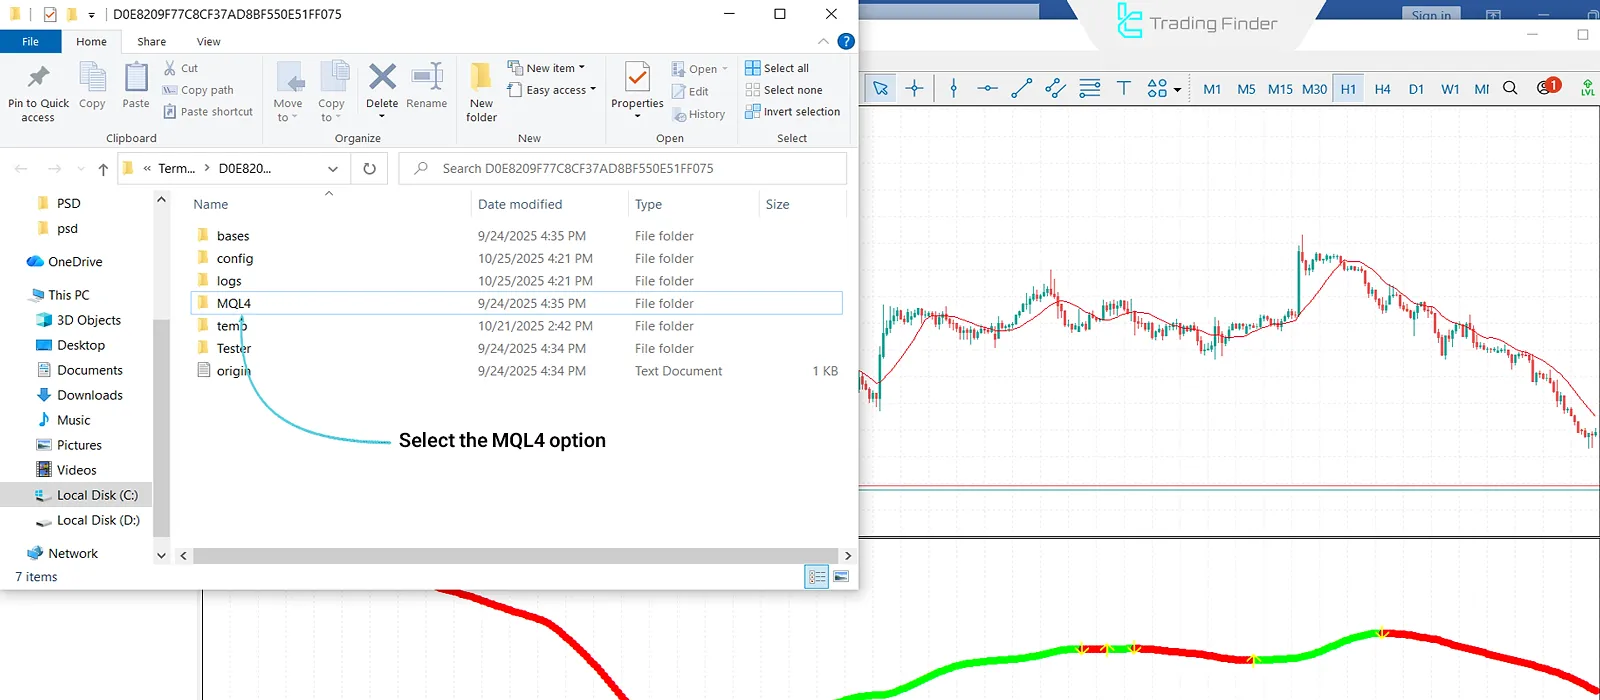
Opening the MQL4 folder to install the Xmaster Formula Indicator in MetaTrader 4 - Then, from the top menu, open “Insert” and “Indicators”;
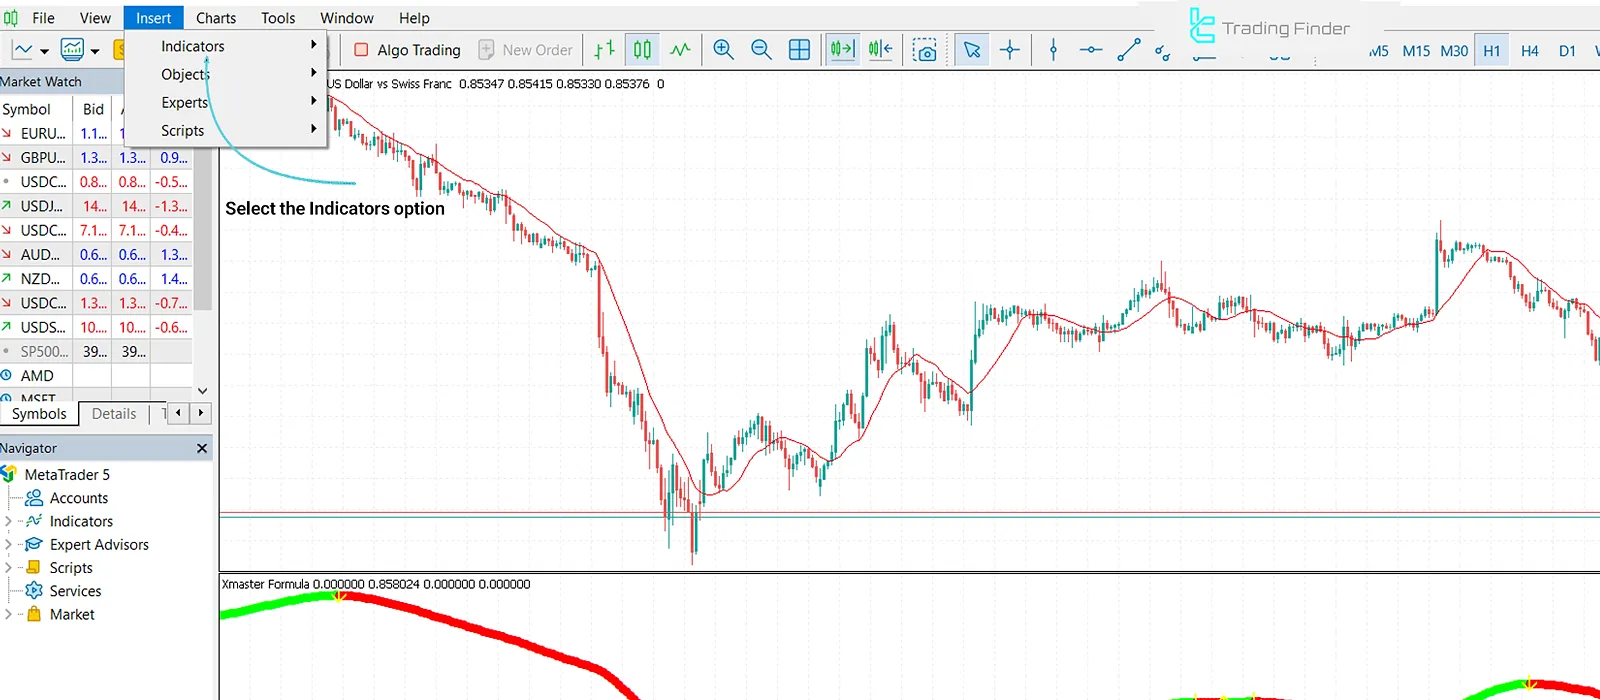
Selecting the “Indicators” option to run the Xmaster Formula Indicator - Select the “Xmaster Formula” indicator and add it to your chart;
- Or, from “Navigator” → “Indicators”, find the indicator and drag it onto the chart.
Best Method for Trading with the Xmaster Formula Indicator
The Xmaster Formula Indicator performs best when used as part of a complete strategy with supporting tools. It works well for identifying entry points and confirming trends.
Combining it with 50- or 200-period moving averages to align with the main trend, and using RSI to detect overbought and oversold zones, improves decision-making accuracy.
It is also essential to follow risk management principles, including setting stop loss based on recent highs and lows and adjusting position size according to market volatility.
Before using it on a live account, backtesting and demo testing are recommended for parameter optimization.
History of the Xmaster Formula Indicator (2020–2025)
Over the past few years, the Xmaster Formula Indicator has evolved from a simple trend detection indicator tool into a high-precision, multi-purpose analytical system.
The 2020–2025 period can be considered the phase of technical development and the establishment of its position among market volatility and direction analysis tools.
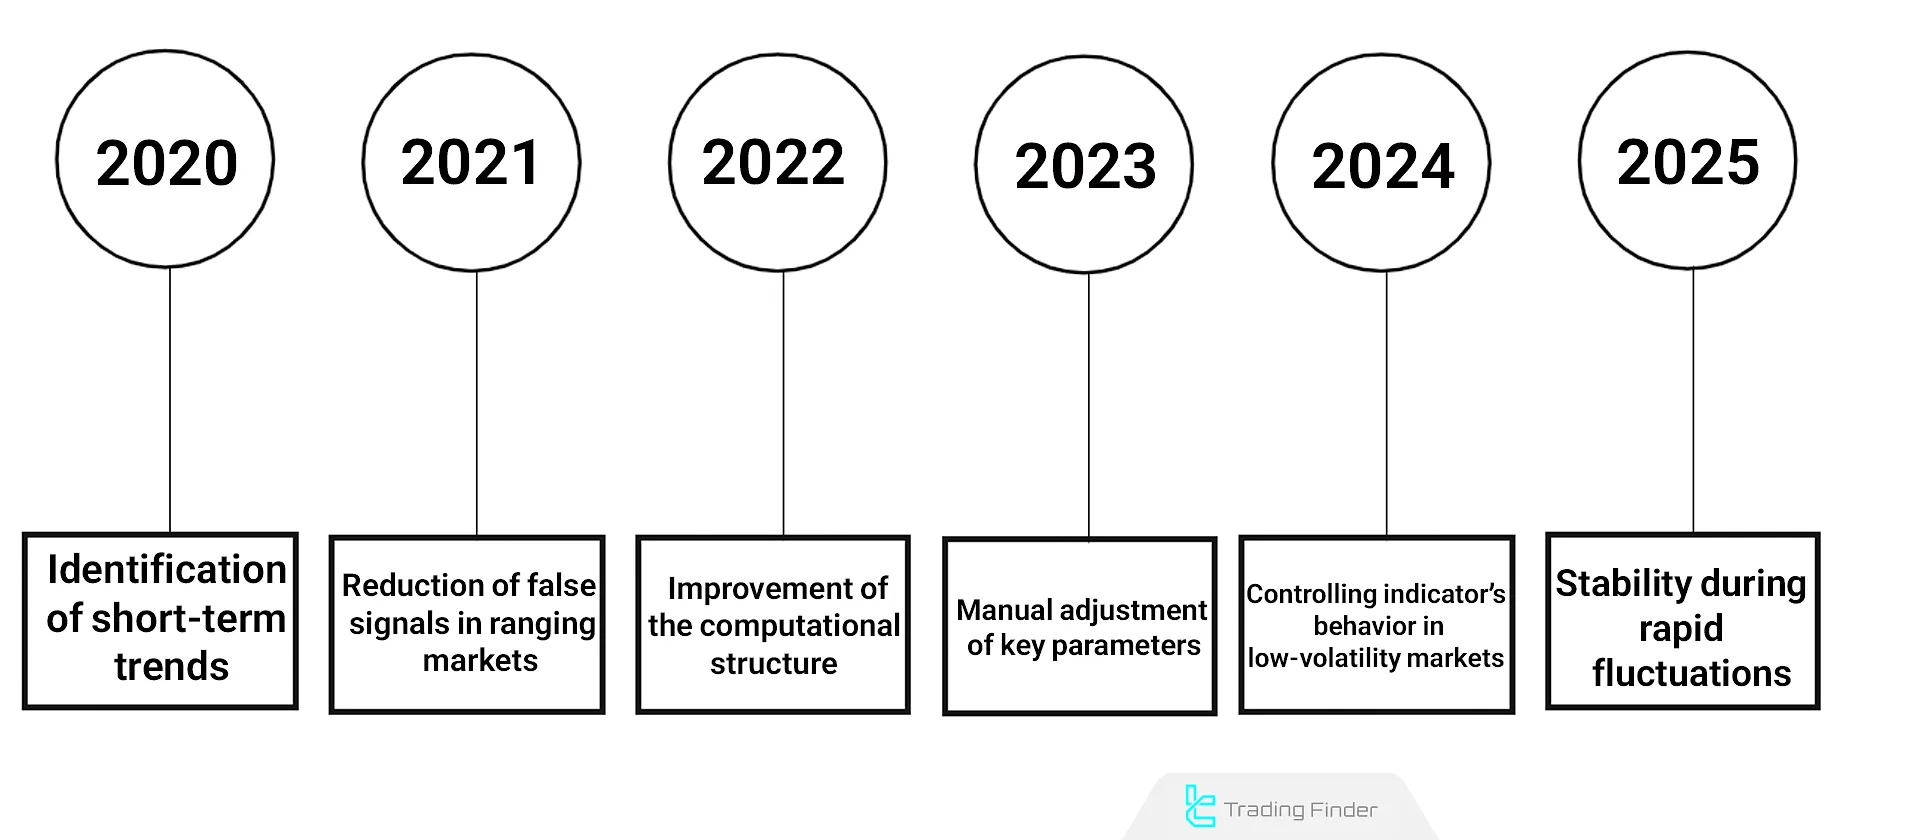
2020
During this period, many traders used the indicator for detecting short-term trends and reversal points.
Its computational core was reconstructed by combining advanced moving averages and volatility-adjusted algorithms to provide faster market reactions.
2021
In 2021, to reduce false signals in ranging markets, a version with adaptive smart filters was introduced.
These filters identified consolidation zones, eliminated unconfirmed signals, and increased indicator stability under volatile conditions.
2022
In newer versions, the indicator’s computational structure was redesigned to increase signal accuracy during trending phases. However, overall performance still depends on sensitivity settings and the type of asset traded.
2023
In 2023, manual adjustment of key parameters such as sensitivity, volatility threshold, and signal delay filter was added.
These improvements turned Xmaster from a static indicator into a dynamic and adaptive tool compatible with various market conditions.
2024
In 2024, developers focused on controlling the indicator’s behaviour in low-volatility markets. The addition of signal stabilizers and whipsaw control improved output accuracy during corrective phases.
2025
The latest versions in 2025 were redesigned to enhance signal accuracy, stability during rapid fluctuations, and reduce computational errors.
Common Mistakes in Using the Xmaster Formula Indicator
Many traders make mistakes when using Xmaster that can significantly reduce analytical accuracy. The most common mistakes when using the Xmaster Formula Indicator include:
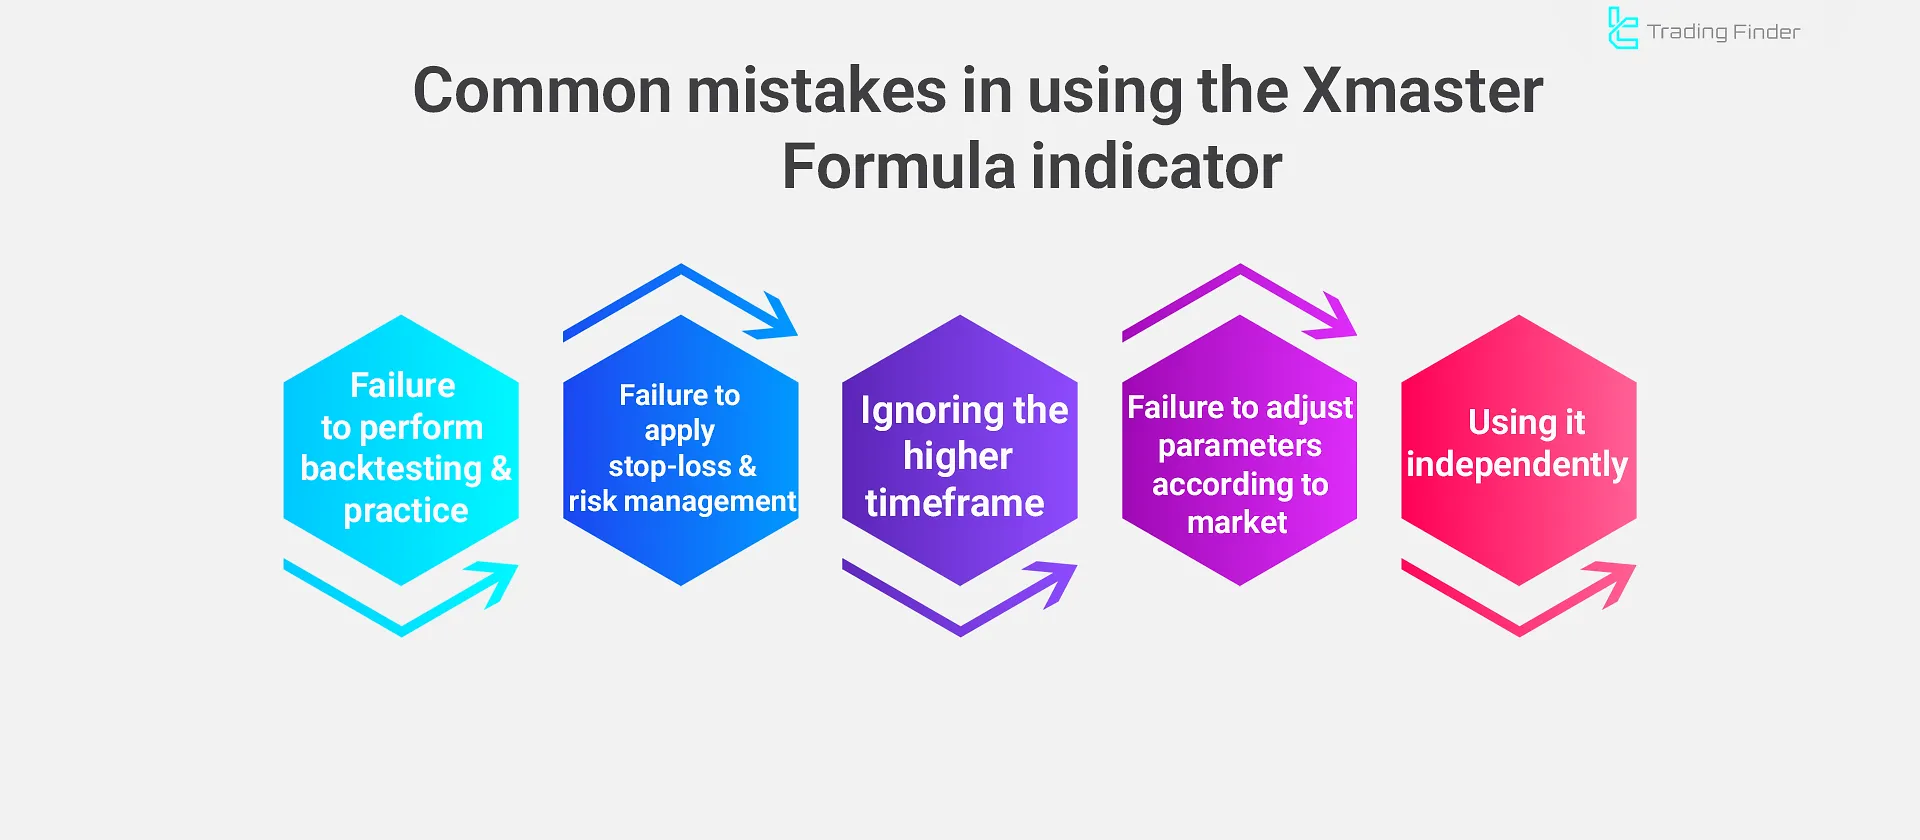
- Using it independently: Relying solely on indicator signals without confirmation tools such as RSI or EMA increases the occurrence of false signals;
- Not adjusting parameters according to market type: The default sensitivity level is not suitable for all conditions. In volatile markets, sensitivity should be reduced to minimize noise; in calm markets, it should be increased;
- Ignoring higher timeframes: Analysing only short timeframes (such as M1 or M5) without considering higher timeframes can result in trades against the main trend;
- Ignoring stop loss and risk management: Relying only on buy or sell signals without risk control can cause significant losses during sudden reversals;
- Not performing backtesting and practice: Using the indicator without analysing its past performance or testing it on a demo account leads to decisions based on incomplete data.
Main Components of the Xmaster Formula Indicator
The Xmaster Formula Indicator operates by combining several technical signals into a single, simple, and unified visual display. Instead of analyzing multiple charts and tools separately, this indicator provides a hybrid system that centrally shows the market trend direction and potential entry or exit zones.
- Exponential Moving Average (EMA): Helps identify the current market trend and crossover points between averages;
- Moving Average Convergence Divergence (MACD): Measures market momentum and the likelihood of trend reversal;
- Relative Strength Index (RSI): Indicates overbought or oversold conditions;
- Stochastic Oscillator: Adds an additional layer of momentum confirmation;
- Bollinger Bands: Detect market volatility and potential breakout zones.
The integration of these tools forms a system capable of displaying:
- Green dotted lines that indicate bullish signals;
- Red dotted lines that represent bearish signals;
- Yellow signal arrows highlighting potential entry and exit points.
Indicator Overview
This indicator visually displays trend direction using green and red arrows, A green arrow indicates price uptrend, A red arrow signals a price downtrend.
Traders can use these arrows to determine entry points for their trades.
Buy Signal in Bullish Trend
The price chart of Gold (XAU/USD) on the 4-hour timeframe is shown below.
The green arrow signals an uptrend and trend reversal. In such conditions, traders can use the green arrow as an Entry Signal and open a Buy position.
Sell Signal in Bearish Trend
The price chart below shows the USD/JPY currency pair on the 5-minute timeframe.
The red arrow signals a trend reversal and indicates a downtrend, providing a Sell position opportunity for traders.
Indicator Settings
The provided image shows the default settings of the Formula XMaster (XHMaster) indicator:
- Chart-theme: Chart theme
- Alert-on: Enable alerts
- Alert-sound: Sound alert
- Alert-email: Email alert
Xmaster vs XHMaster Formula Indicator
Both indicators are designed to generate buy and sell signals, but they cater to two different groups of traders. The XHMaster Indicator, in addition to being an upgraded version of Xmaster, represents a major evolution in its structure and functionality.
Although these two tools are often mentioned together, they differ in features, platform compatibility, and intelligence level.
Feature | Xmaster Formula Indicator | XHMaster Formula Indicator |
Core Concept | A simple and reliable signal generator | An advanced trading system with AI-based filters |
Signal Generation | Basic buy/sell arrows | Advanced arrows with trend filters and AI confirmation |
Customization | Simple settings such as periods | Advanced options such as AI strength, risk mode, and filter sensitivity |
Best Suited For | Beginners and those seeking quick, simple signals | Intermediate to professional traders |
Which One Is Better for Trading?
If you are at the beginning of your trading journey and have just entered the Forex or crypto markets, the Xmaster Formula Indicator can be a better option to start with.
It is designed to display buy and sell signals directly on the chart without requiring complex configurations or advanced technical analysis knowledge. When to Choose Xmaster Formula:
- You are a complete beginner
- You want a simple, affordable, and easy-to-understand tool for basic trading
- You acknowledge the possibility of repainting and manage risk carefully
If you have more trading experience and are looking for a smarter, more accurate, and reliable system, the XHMaster Formula Indicator is the right choice. When to Choose XHMaster Formula:
- You have trading experience
- You want to eliminate market noise using intelligent filters
- You trade assets such as gold, indices, or cross-currency pairs
- You need real-time alerts and notifications
Conclusion
The Xmaster Formula Indicator combines two widely used indicators to help traders identify entry and exit points, trend direction through green and red arrows. This tool is particularly useful for day traders and swing traders.
This tool is useful for both day traders and swing traders, and due to its non-repaint structure, it provides stable and reliable signals under various market conditions.
Xmaster Formula MT4 PDF
Xmaster Formula MT4 PDF
Click to download Xmaster Formula MT4 PDFDoes Xmaster (XHMaster) Formula Indicator provide entry signals?
Yes, this indicator provides entry zones using green and red arrows.
Does Xmaster Formula Indicator only show entry points?
No, one of the key features of this indicator is its ability to identify trends.
What is the Xmaster Formula Indicator?
The Xmaster Formula Indicator is an analytical tool created by combining adaptive moving averages and momentum oscillators.
Its main purpose is to identify trend direction, price movement strength, and to generate highly accurate buy and sell signals. This indicator uses green and red colours to display bullish and bearish market phases.
Does the Xmaster Formula Indicator repaint?
In its original versions, the Xmaster Formula is designed as a non-repaint indicator, meaning that once a candle is formed, the issued signal does not change.
However, some modified or free versions may rewrite past data, so it is recommended to use a verified and tested version.
Can Xmaster be used on any timeframe?
Yes, this indicator can be used across all timeframes, but its best performance is seen on short-term charts such as 5-minute and 15-minute intervals. On higher timeframes like H4 or Daily, the indicator’s reaction becomes slower, and signals may appear with delay.
Which strategies is the Xmaster Indicator suitable for?
This indicator is mainly used in scalping and day trading strategies, where quick identification of trend changes is essential. It serves as a primary trend filter and can be combined with other tools such as RSI or MACD to improve trading accuracy.
Does Xmaster take trading volume into account?
No, the indicator is built on price action and does not use volume data in its calculations. For more comprehensive analysis, it is advisable to combine Xmaster with indicators such as Volume Profile or OBV.
How are buy and sell signals displayed in Xmaster?
Buy signals are shown with a green arrow or line, indicating increased momentum and buyer entry. Conversely, sell signals appear as red arrows or lines, showing trend weakness or the beginning of selling pressure. These colours appear on the chart in real time.
Can the Xmaster Formula Indicator settings be adjusted?
Yes, the Xmaster Formula Indicator offers customisable settings. The trader can modify parameters such as signal sensitivity, filter distance, sound alerts, and email notifications so that the indicator output matches their trading style.
What is the best way to use the Xmaster Formula Indicator?
The best results are achieved when Xmaster signals are combined with a trend filter (such as EMA 50 or EMA 100) and indicators like RSI. This convergence reduces the likelihood of false signals and provides more precise entry points.
Is the Xmaster Formula Indicator suitable for beginners?
Yes, one of Xmaster’s main advantages is its simplicity of display and interpretation. Its colour-coded signals clearly show market direction, allowing beginner traders to make quick decisions without complex analysis.
Are free versions of Xmaster reliable?
Free versions of this indicator are widely available in trading communities, but not all of them are reliable. Some may contain computational errors or repainting issues. The Trading Finder team has provided a verified free version of this indicator.
Hi Guys, Thanks for indicators and valuable info you provide about them. xMaster indi is not updating properly. When kept long for more than 8 hours or more it prints wrong dots and arrows. It come backs to normal after refreshing the indi. You mentioned XHMaster. Is it possible to get it too. May I request the credentials for one of your indi named 'trade-assist-prop-firm-plus-tf-mt4-by-tflab' please.

Hello,"For guidance, please contact us via Telegram or WhatsApp."


