


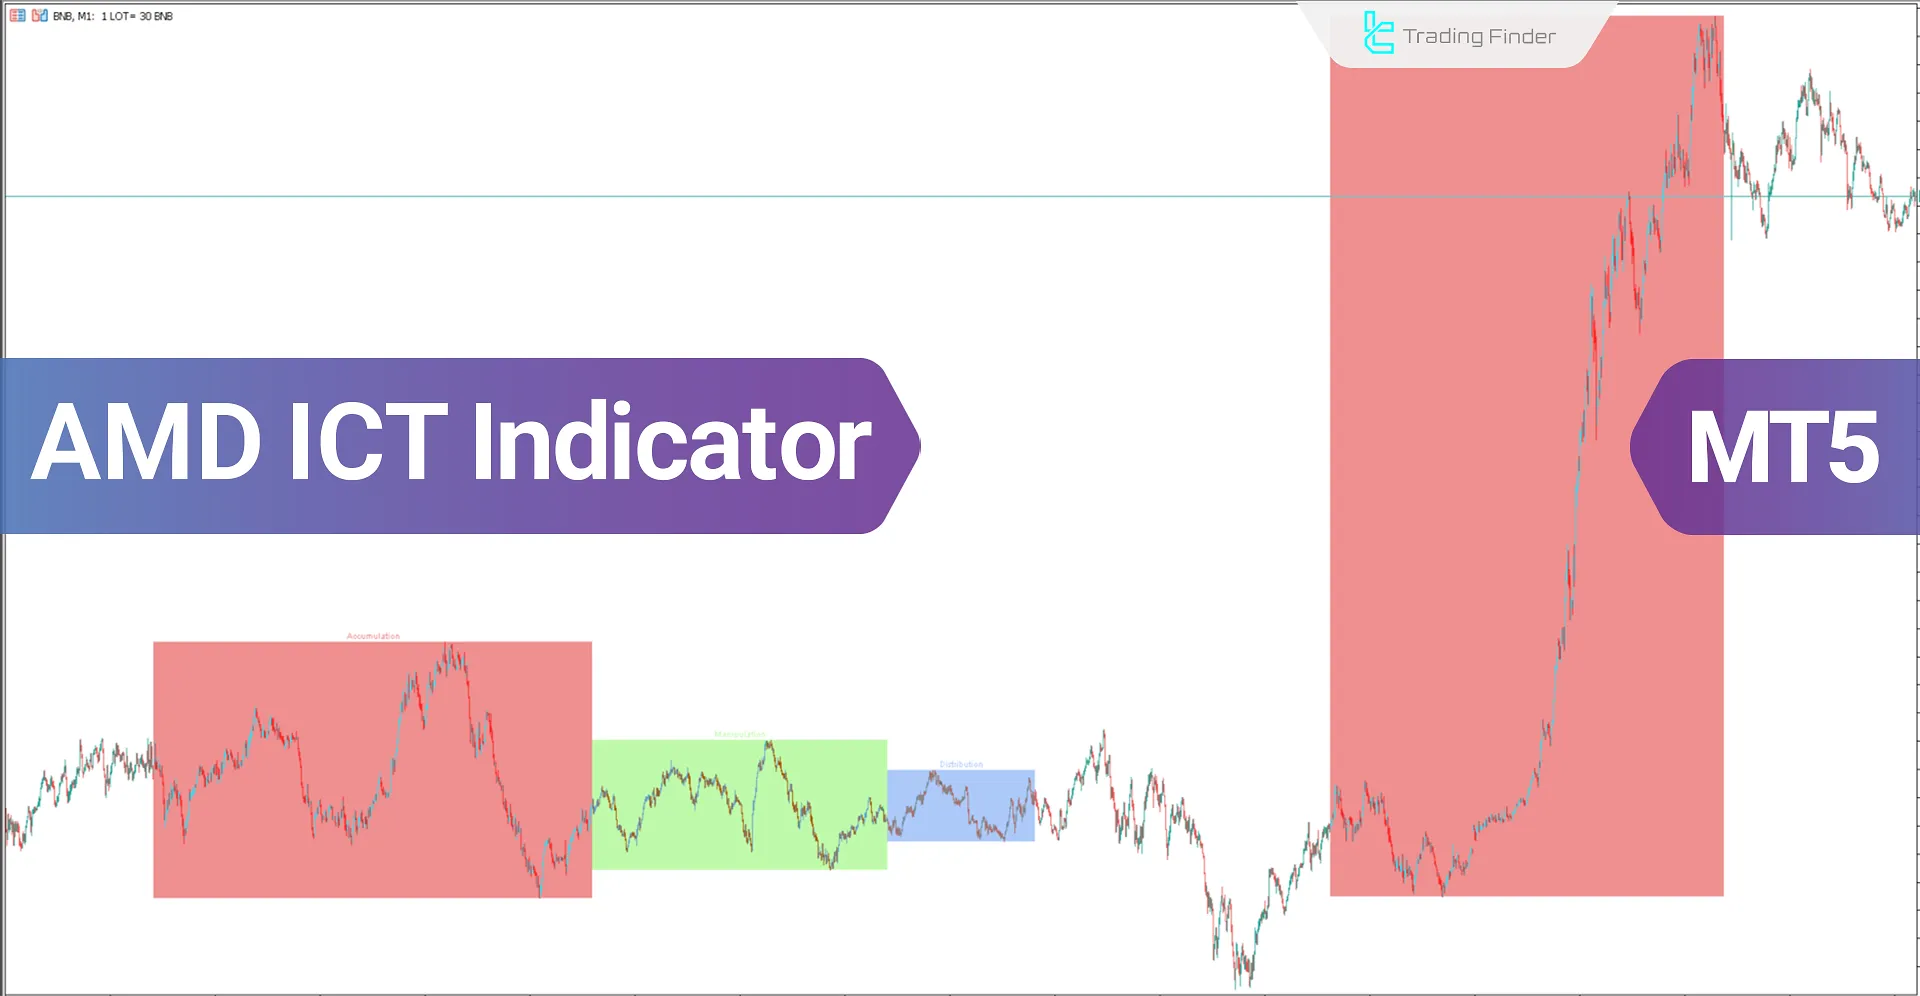


The "AMD" indicator is one of the ICT strategy indicators on the MetaTrader 5 platform. By closely analyzing trading volume and price movements in specific trading sessions, this tool categorizes market movement into three main phases: Accumulation, Manipulation, and Distribution.
For better differentiation, the AMD indicator displays the accumulation phase in pink, distribution in blue, and manipulation in green.
Indicator Specifications
Indicator Categories: | Price Action MT5 Indicators Liquidity Indicators MT5 Indicators ICT MT5 Indicators |
Platforms: | MetaTrader 5 Indicators |
Trading Skills: | Advanced |
Indicator Types: | Reversal MT5 Indicators |
Timeframe: | M1-M5 Timeframe MT5 Indicators M15-M30 Timeframe MT5 Indicators H1-H4 Timeframe MT5 Indicators |
Trading Style: | Swing Trading MT5 Indicators Day Trading MT5 Indicators |
Trading Instruments: | Forex MT4 Indicators Crypto MT5 Indicators Stock MT5 Indicators Commodity MT5 Indicators Forward MT5 Indicators Share Stock MT5 Indicators |
AMD Indicator at a Glance
By identifying and analyzing market behavior based on the three phases introduced, the AMD indicator draws traders' attention to key parts of the trading day. Generally, in the Accumulation phase, buyers dominate sellers, leading to increased buying pressure.
The Distribution phase marks the point where, through asset distribution, selling pressure surpasses buying pressure. The transition from accumulation to distribution is known as the Manipulation phase.
Uptrend Conditions
Based on the Binance Coin (BNB) price chart in a 1-minute timeframe, the point of price reversal towards an upward trend can be observed.
The accumulation and distribution zones reveal the strength of the trend.
Traders can identify suitable Entry and Exit points by recognizing signs of weakness in these areas.
Downtrend Conditions
The price chart for the EUR/USD currency pair in a 1-minute timeframe shows signs of weakness in the distribution and accumulation zones.
This pattern usually signals a trend change after the distribution phase concludes, presenting good opportunities for Short trades.
Indicator Settings
- Theme: Indicator Theme;
- Session Type: AMDX Session Type;
- Day to Start Looking Back: Desired number of days: 5.
Conclusion
The trading tool, as a Liquidity Indicator, identifies accumulation, manipulation, and distribution patterns by analyzing price highs and lows in trading sessions.
By assessing the strengths and weakness of these areas, traders can identify potential trend reversal points and find suitable Long & Short trade positions.
Accumulation Manipulation Distribution indicator MT5 PDF
Accumulation Manipulation Distribution indicator MT5 PDF
Click to download Accumulation Manipulation Distribution indicator MT5 PDFIs this indicator suitable for long-term trading?
No, this indicator is not intended for long-term trading. The AMD indicator is designed for swing trading and scalping.
What is the basis of this indicator's design?
This indicator is based on ICT (inner circle traders) trading style concepts.


