![Cracking Correlation (ICT) Indicator for MetaTrader 5 Download – [TFlab]](https://cdn.tradingfinder.com/image/262454/13-81-en-cracking-correlation-mt5-01.webp)
![Cracking Correlation (ICT) Indicator for MetaTrader 5 Download – [TFlab] 0](https://cdn.tradingfinder.com/image/262454/13-81-en-cracking-correlation-mt5-01.webp)
![Cracking Correlation (ICT) Indicator for MetaTrader 5 Download – [TFlab] 1](https://cdn.tradingfinder.com/image/262456/13-81-en-cracking-correlation-mt5-02.webp)
![Cracking Correlation (ICT) Indicator for MetaTrader 5 Download – [TFlab] 2](https://cdn.tradingfinder.com/image/262457/13-81-en-cracking-correlation-mt5-03.webp)
![Cracking Correlation (ICT) Indicator for MetaTrader 5 Download – [TFlab] 3](https://cdn.tradingfinder.com/image/262455/13-81-en-cracking-correlation-mt5-04.webp)
The Cracking Correlation Indicator is an ICT style tool that highlights correlation changes among three assets. Symbols like DJI, ND100, and SP500 often move in similar directions due to their high correlation.
However, this relationship can sometimes break, and this indicator visualizes these moments using lines.
Cracking Correlation Indicator Specifications
The table below details the main features of the Cracking Correlation Indicator.
|
Indicator Categories:
|
Smart Money MT5 Indicators
Liquidity Indicators MT5 Indicators
ICT MT5 Indicators
|
|
Platforms:
|
MetaTrader 5 Indicators
|
|
Trading Skills:
|
Advanced
|
|
Indicator Types:
|
Reversal MT5 Indicators
|
|
Timeframe:
|
Multi-Timeframe MT5 Indicators
|
|
Trading Style:
|
Day Trading MT5 Indicators
|
|
Trading Instruments:
|
Stock MT5 Indicators
|
Indicator Overview
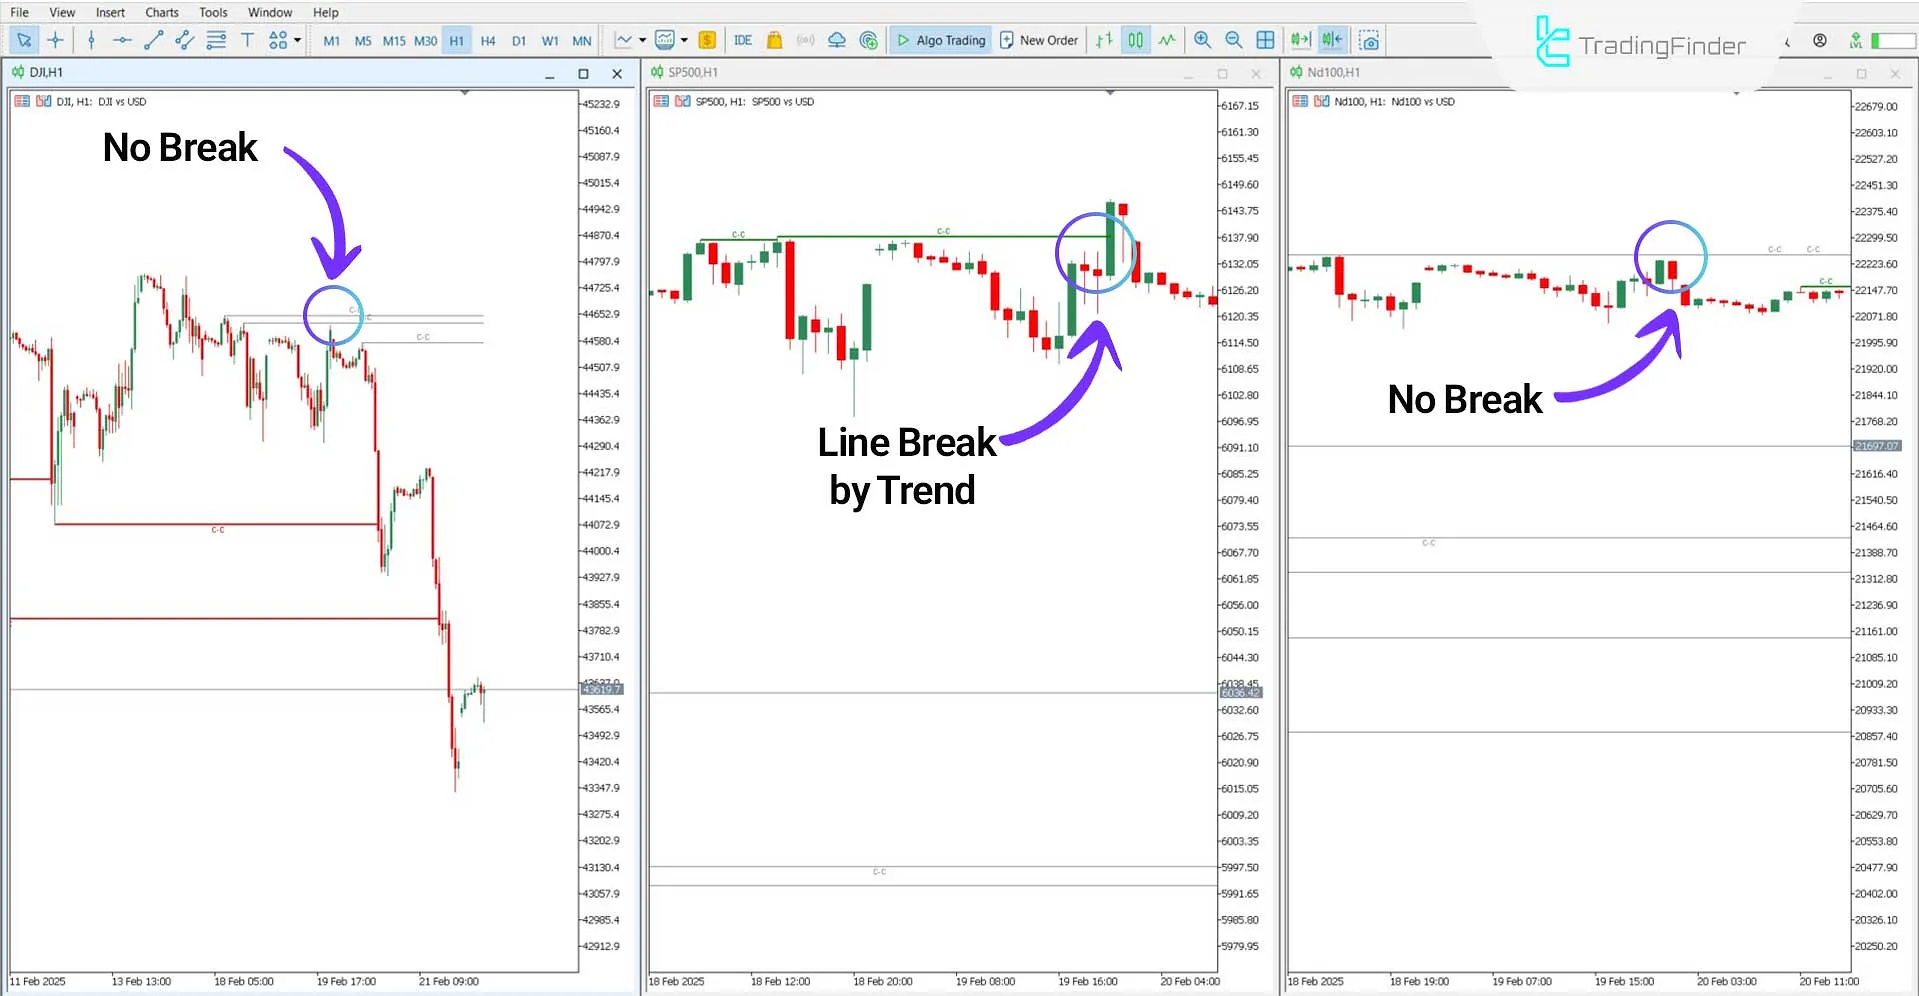
The Cracking Correlation Indicator uses color-changing lines to display correlation breaks between three trading symbols. When one asset breaks a key level, the indicator changes the line color from gray to green (bullish break) or red (bearish break), highlighting the divergence.
Bullish Market Scenario
In a 30-minute chart of DJI, ND100, and SP500, the SP500 breaks above its price ceiling, while the other two indices (DJI and ND100) fail to do so.
This situation indicates a correlation break, as SP500 leads the uptrend while the others lag.

Bearish Market Scenario
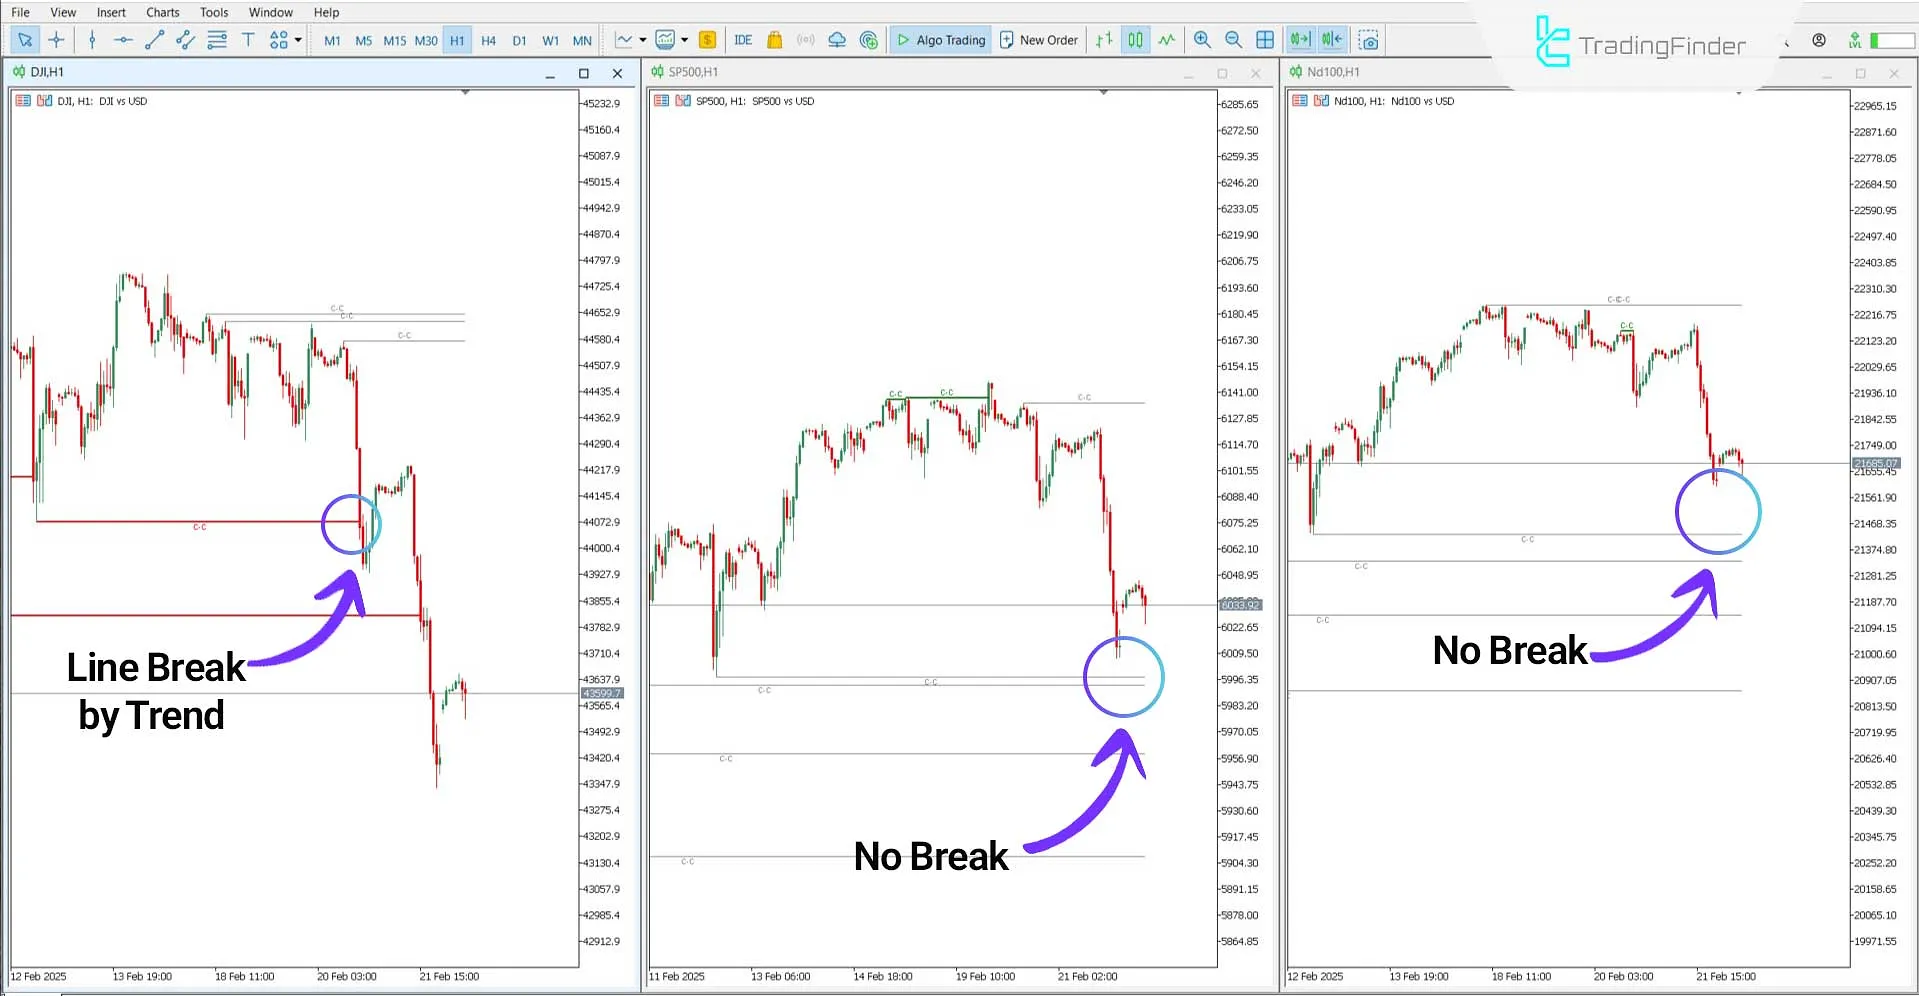
On a 1-hour chart of DJI, ND100, and SP500, the DJI breaks below a support level with strong bearish momentum.
Meanwhile, ND100 and SP500 do not break the same level, indicating a correlation divergence.
 Analyzing Bearish Trends Using the ICT Cracking Correlation Indicator
Cracking Correlation Indicator Settings
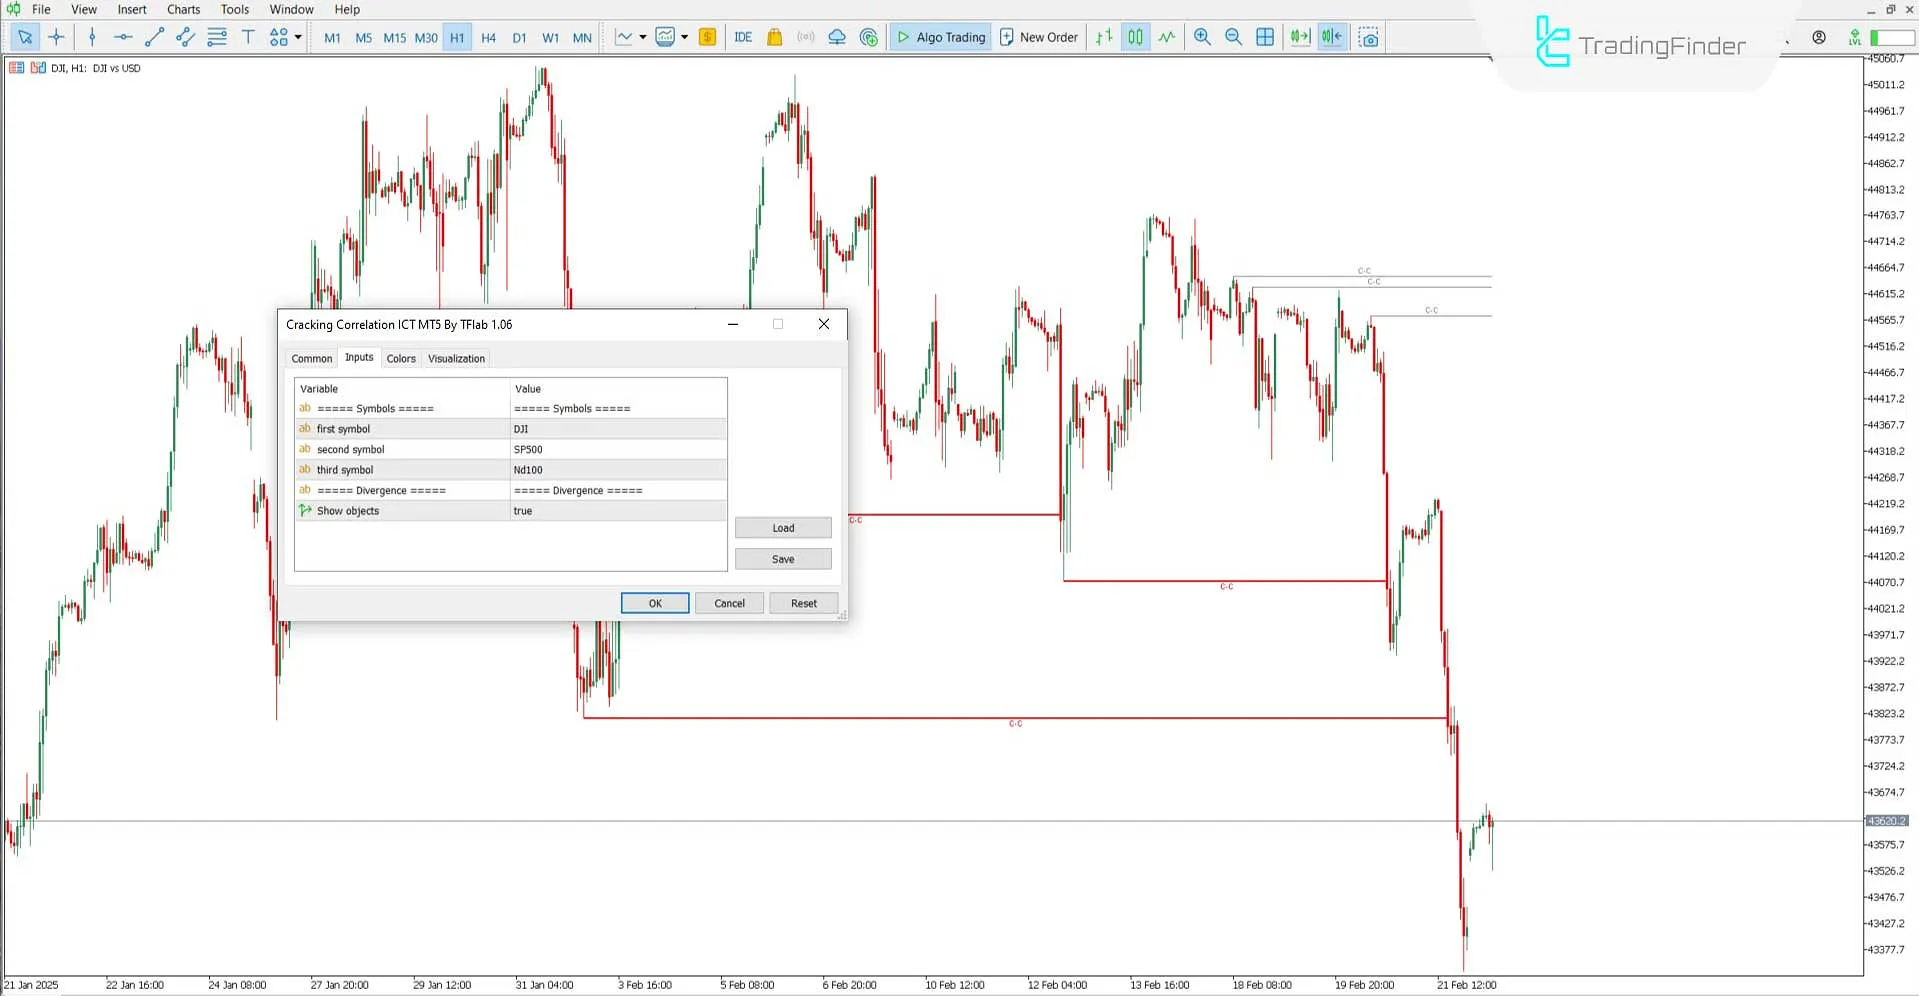
The following image displays the settings panel for the Cracking Correlation Indicator:

- First symbol: Set the primary asset for analysis
- Second symbol: Select the second asset
- Third symbol: Choose the third asset
- Show objects: Enable or disable the display of elements on the chart
Conclusion
The Cracking Correlation Indicator helps users detect correlation breaks between three trading symbols. This liquidity indicator uses color changing lines to highlight shifts in correlation.
It is worth noting that to run this trading tool, it must first be applied to the first symbol. Additionally, in trading strategies that involve fundamental analysis, this indicator can also be used.
What is the suitable timeframe for this indicator?
The Cracking Correlation Indicator is multi-timeframe and can be used across all timeframes.
When is a correlation break confirmed?
A correlation break is confirmed when a candle closes above or below the designated lines.