![Keltner Channel Indicator for MetaTrader 5 Download – Free – [TradingFinder]](https://cdn.tradingfinder.com/image/117033/11-34-en-keltner-channel-mt5.webp)
![Keltner Channel Indicator for MetaTrader 5 Download – Free – [TradingFinder] 0](https://cdn.tradingfinder.com/image/117033/11-34-en-keltner-channel-mt5.webp)
![Keltner Channel Indicator for MetaTrader 5 Download – Free – [TradingFinder] 1](https://cdn.tradingfinder.com/image/117093/11-34-en-keltner-channel-mt5-02.webp)
![Keltner Channel Indicator for MetaTrader 5 Download – Free – [TradingFinder] 2](https://cdn.tradingfinder.com/image/117088/11-34-en-keltner-channel-mt5-04.webp)
![Keltner Channel Indicator for MetaTrader 5 Download – Free – [TradingFinder] 3](https://cdn.tradingfinder.com/image/117090/11-34-en-keltner-channel-mt5-05.webp)
On July 22, 2025, in version 2, alert/notification and signal functionality was added to this indicator
The Keltner Channel Indicator is one of the MetaTrader 5 indicators used in trend-following trading strategies. This channel uses an Exponential Moving Average (EMA) to detect uptrends, downtrends, or range-bound markets, while the ATR (Average True Range) calculates the channel's volatility range.
The upper channel band equals the EMA plus two times the ATR, and the lower is EMA minus two times the ATR. These bands can act as dynamic support and resistance levels, providing traders with entry and exit points when broken.
Keltner Channel Indicator Table
Indicator Categories: | Volatility MT5 Indicators Trading Assist MT5 Indicators Bands & Channels MT5 Indicators |
Platforms: | MetaTrader 5 Indicators |
Trading Skills: | Elementary |
Indicator Types: | Breakout MT5 Indicators Reversal MT5 Indicators |
Timeframe: | Multi-Timeframe MT5 Indicators |
Trading Style: | Intraday MT5 Indicators Scalper MT5 Indicators Day Trading MT5 Indicators |
Trading Instruments: | Forex MT5 Indicators Crypto MT5 Indicators Stock MT5 Indicators Commodity MT5 Indicators Indices MT5 Indicators Forward MT5 Indicators Share Stock MT5 Indicators |
Bullish and Bearish Conditions of the Keltner Channel Indicator
Keltner Channel Indicator at a Glance
This indicator helps traders recognize market entry and exit points and make better decisions through price volatility analysis.
Unlike other band-based indicators like Bollinger Bands, which use the Simple Moving Average (SMA), the Keltner Channel uses the Exponential Moving Average (EMA) and ATR, making it more sensitive to price changes and more accurate in detecting volatility.
 Dow Jones Index price chart
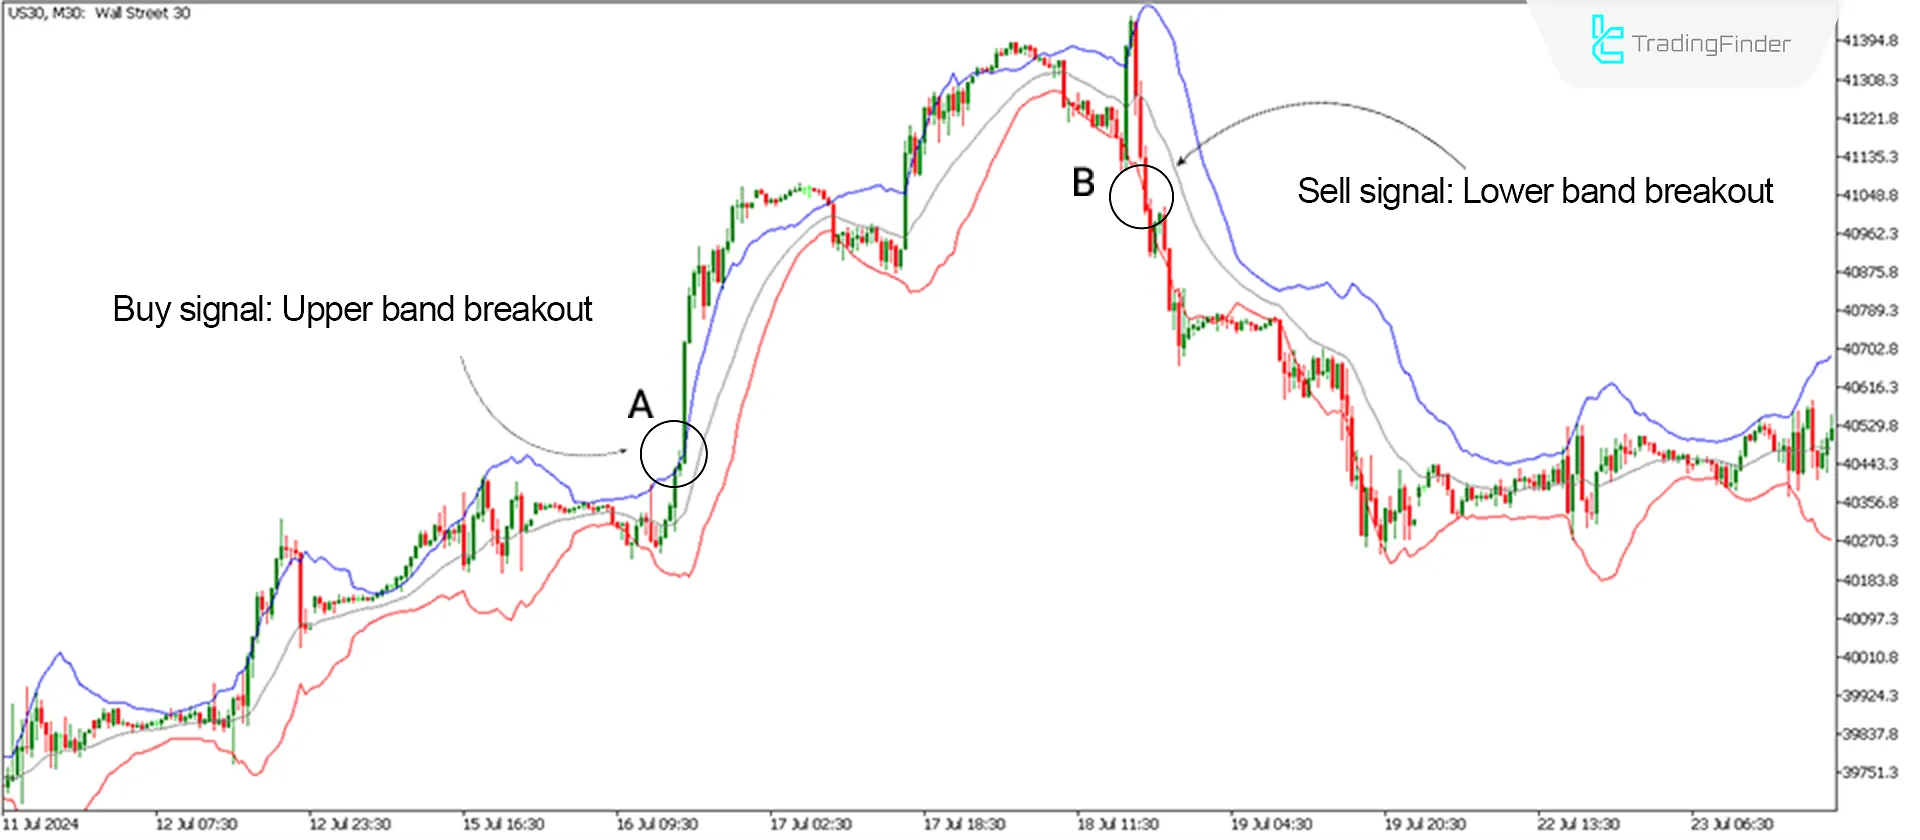
The image below displays the Dow Jones Index (US30) in the 30-minute timeframe. The channel slows bullishly at point A, and the price breaks the upper band with strength. In this condition, traders can enter buy positions after receiving confirmations from other analytical tools.
At point B, the Keltner Channel slows downward, and the lower band is broken with strength, signaling a bearish trend and entry into sell positions.
Uptrend Conditions of the Indicator (Buy Positions)
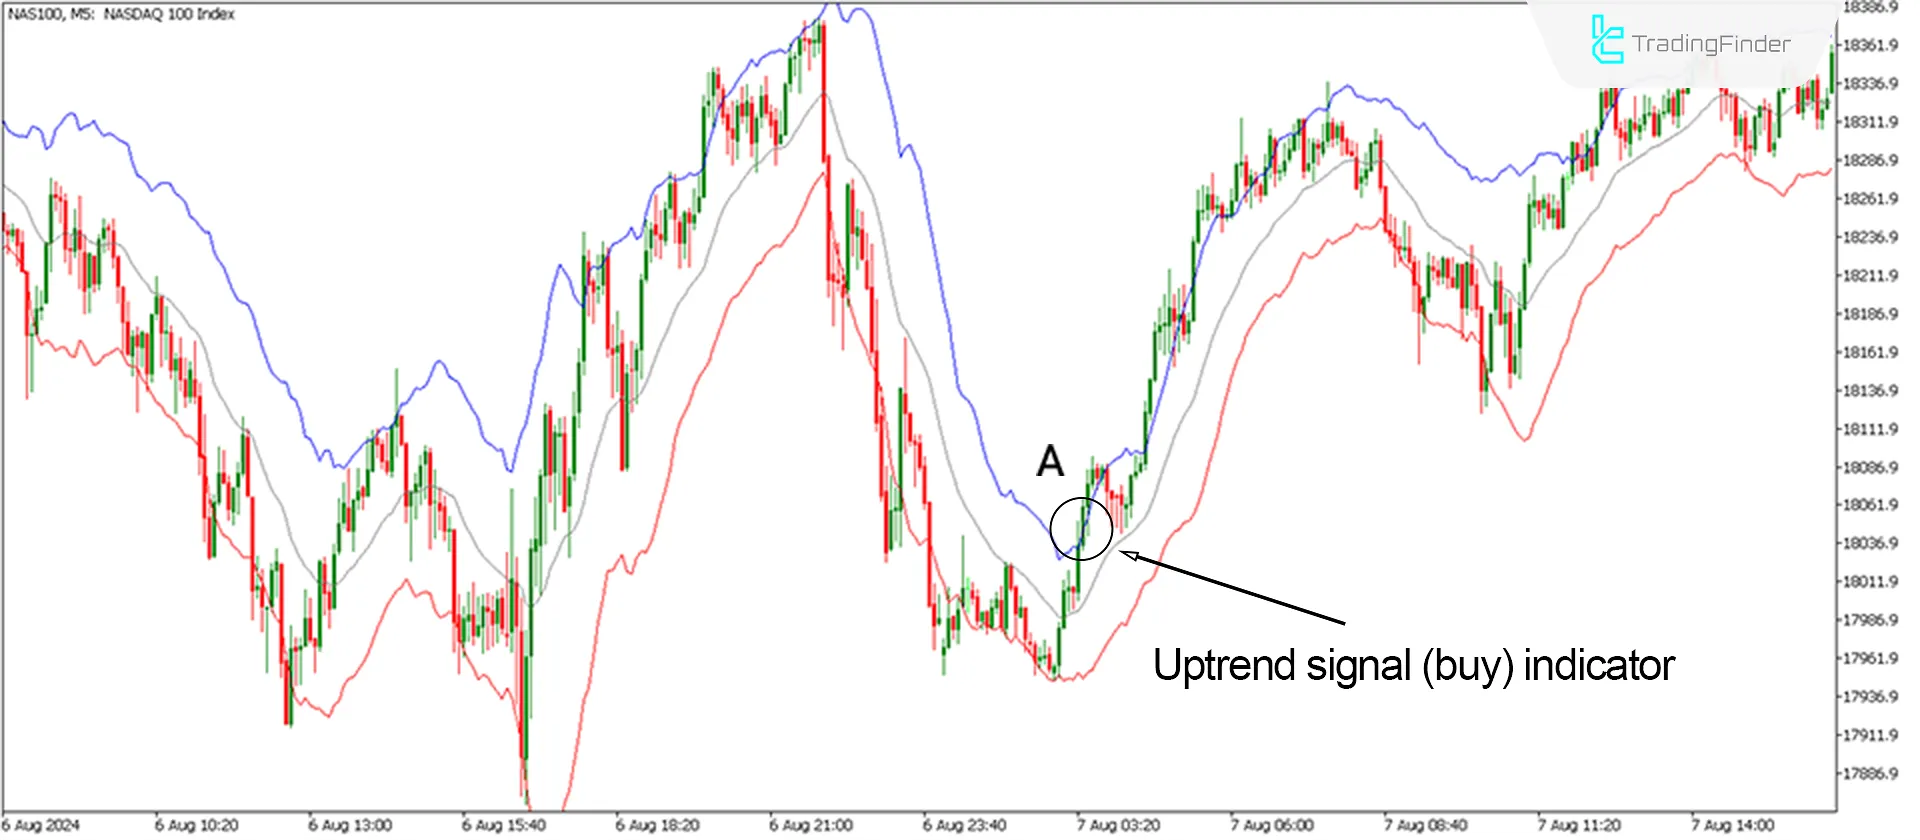
The image below displays the NASDAQ Index (NAS100) in the 5-minute timeframe. At point A, the price crosses above the 20-period EMA and breaks the upper channel band (Breakout), signaling a bullish trend, and traders can enter buy positions.

Downtrend Conditions of the Indicator (Sell Positions)
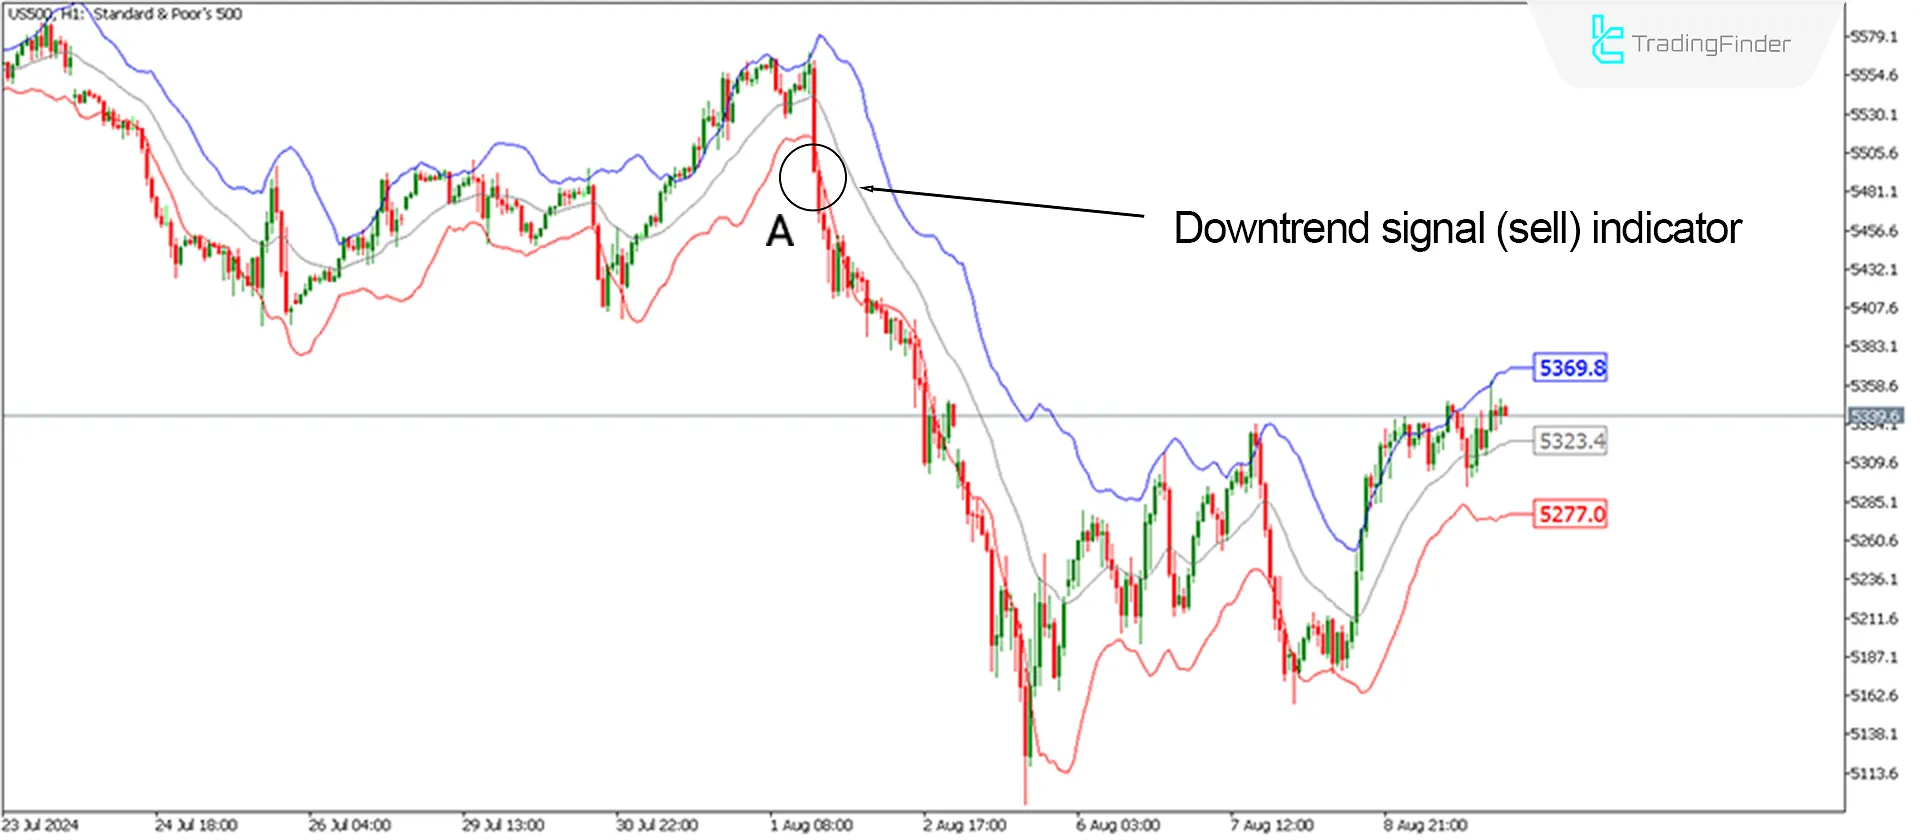
The image below displays the S&P 500 Index (US500) in the 1-hour timeframe. At point A, the price crosses below the 20-period EMA and breaks the lower channel band (Breakout), signaling a bearish trend, and traders can enter sell positions.

Keltner Channel Indicator Settings

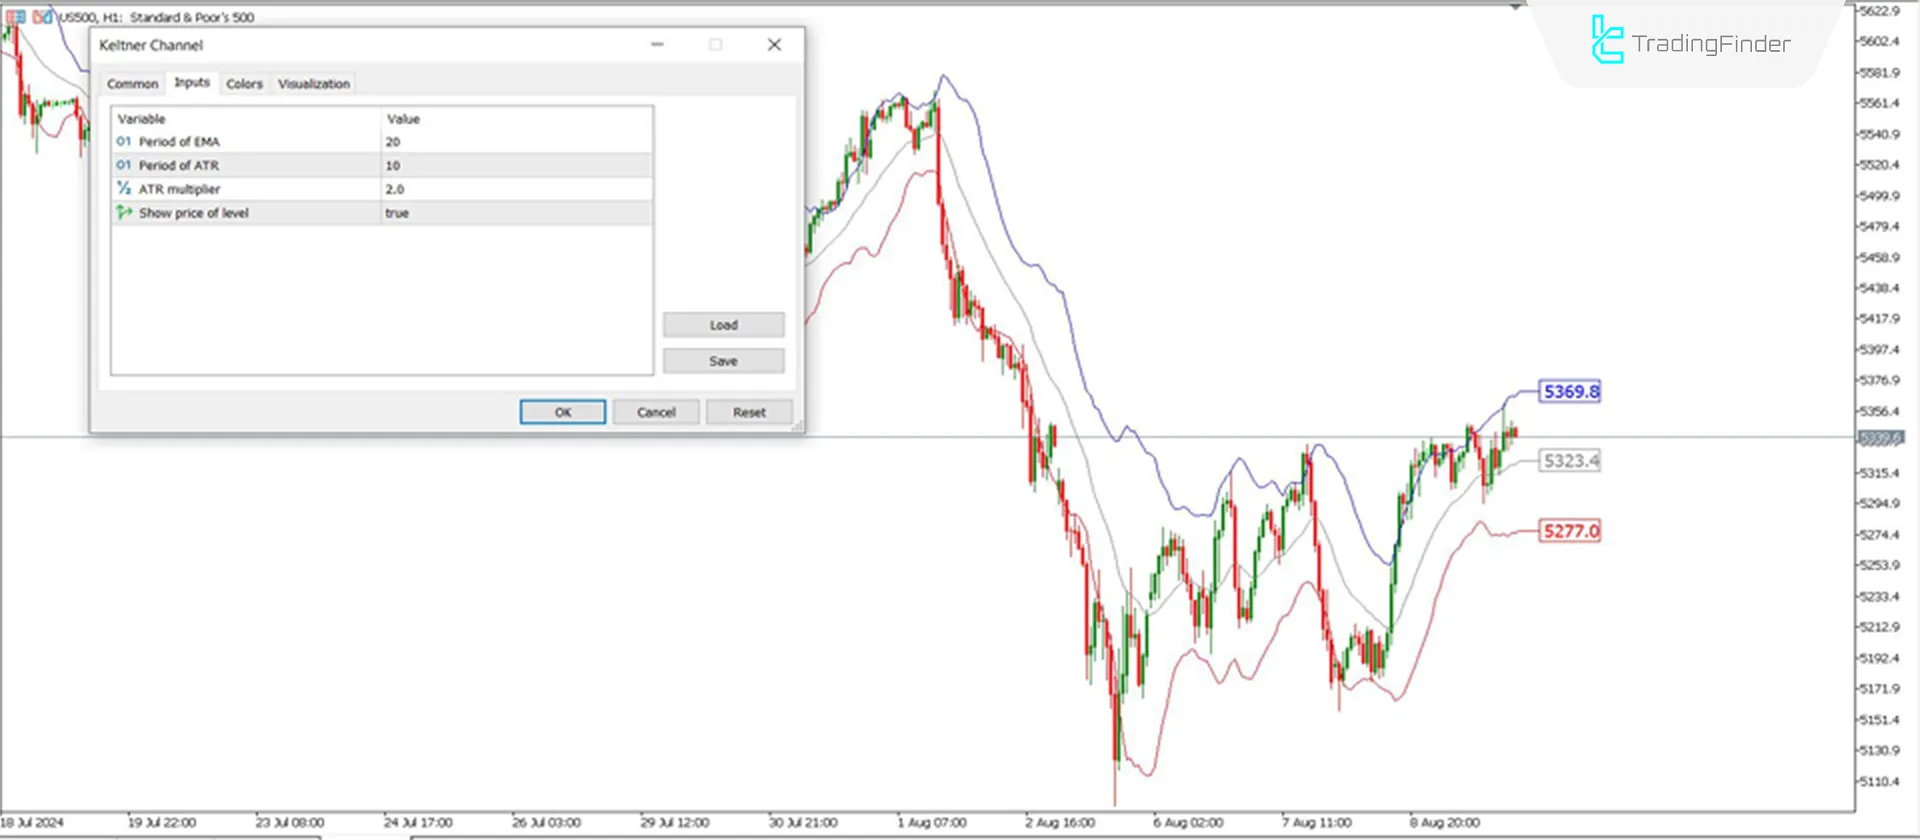
- Period of EMA: The period of the Exponential Moving Average (EMA) is set to 20;
- Period of ATR: The period of the ATR Indicator is set to 10;
- ATR Multiplier: The multiplier for the band distance from the moving average is 2;
- Show the Price of the Level: Set to true to show the price alongside the bands.
Conclusion
The Keltner Channel Indicator helps analyze market volatility and identify trading opportunities. By utilizing the Exponential Moving Average and ATR, the Volatility indicator helps traders understand the range of price fluctuations and spot potential entry and exit points. However, like any other tool, the Keltner Channel should be combined with other indicators and analytical tools to provide more vital confirmations for traders.
Keltner Channel MT5 PDF
Keltner Channel MT5 PDF
Click to download Keltner Channel MT5 PDFHow does the Keltner Channel differ from Bollinger Bands?
The Keltner Channel calculates the bands using the Exponential Moving Average (EMA) and ATR, while Bollinger Bands use the Simple Moving Average (SMA) and Standard Deviation. This difference makes the Keltner Channel more sensitive to price changes.
How can I optimize the Keltner Channel settings?
Depending on the market type and trading style, you can adjust the EMA period and ATR multiplier, but the most optimized settings have already been applied to this indicator.


