![Laguerre RSI Indicator in MT5 Download - Free - [TradingFinder]](https://cdn.tradingfinder.com/image/126938/4-13-en-laguerre-rsi-mt5-1.webp)
![Laguerre RSI Indicator in MT5 Download - Free - [TradingFinder] 0](https://cdn.tradingfinder.com/image/126938/4-13-en-laguerre-rsi-mt5-1.webp)
![Laguerre RSI Indicator in MT5 Download - Free - [TradingFinder] 1](https://cdn.tradingfinder.com/image/126907/4-13-en-lagueere-rsi-mt5-4.webp)
![Laguerre RSI Indicator in MT5 Download - Free - [TradingFinder] 2](https://cdn.tradingfinder.com/image/126906/4-13-en-lagueere-rsi-mt5-2.webp)
![Laguerre RSI Indicator in MT5 Download - Free - [TradingFinder] 3](https://cdn.tradingfinder.com/image/126905/4-13-en-lagueere-rsi-mt5-3.webp)
The Laguerre RSI indicator is a trend oscillator in MetaTrader 5 indicators that can be used either as a standalone trading system or as a complementary tool for confirmation in trading strategies.
The main difference between it and the classic RSI is the removal of signal delays, especially over longer time frames. Additionally, this indicator uses a gamma (Gamma) filter, which reduces the price coefficient and produces fewer false signals.
Indicator Table
Indicator Categories: | Oscillators MT5 Indicators Smart Money MT5 Indicators ICT MT5 Indicators |
Platforms: | MetaTrader 5 Indicators |
Trading Skills: | Intermediate |
Indicator Types: | Lagging MT5 Indicators |
Timeframe: | Multi-Timeframe MT5 Indicators |
Trading Style: | Day Trading MT5 Indicators |
Trading Instruments: | Forex MT5 Indicators Crypto MT5 Indicators Stock MT5 Indicators Forward MT5 Indicators Share Stock MT5 Indicators |
Indicator Overview
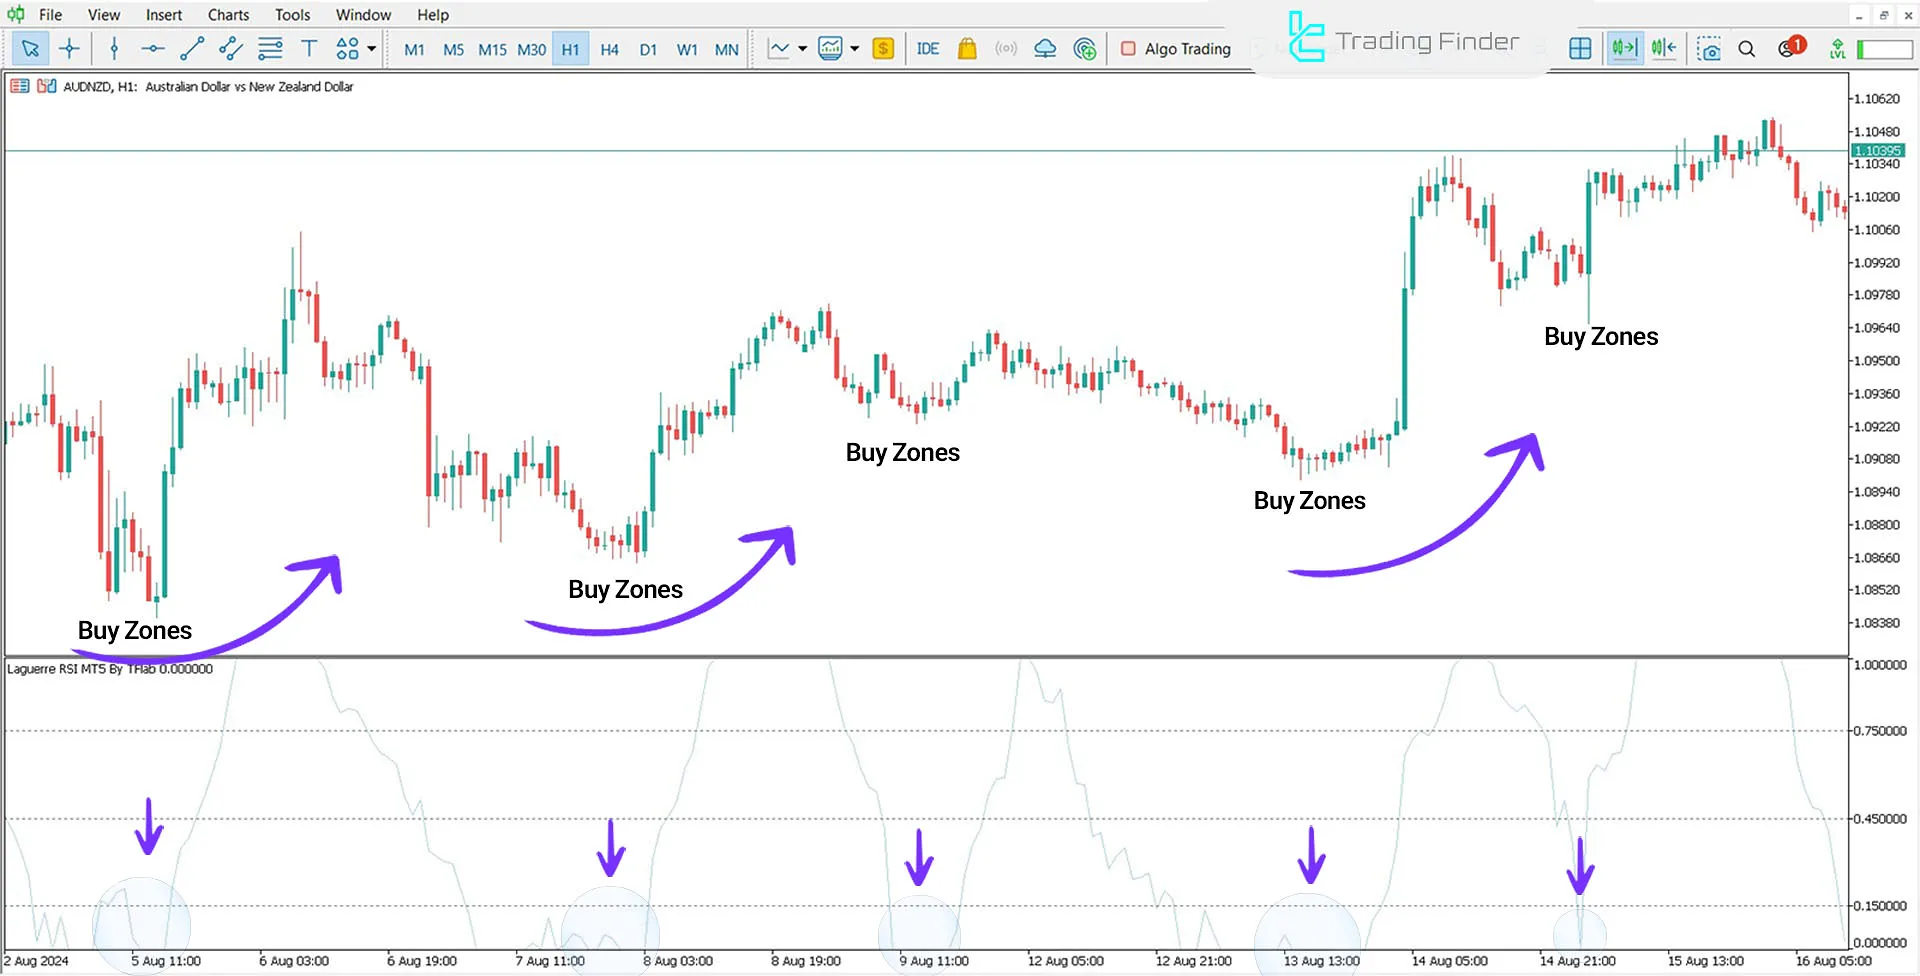
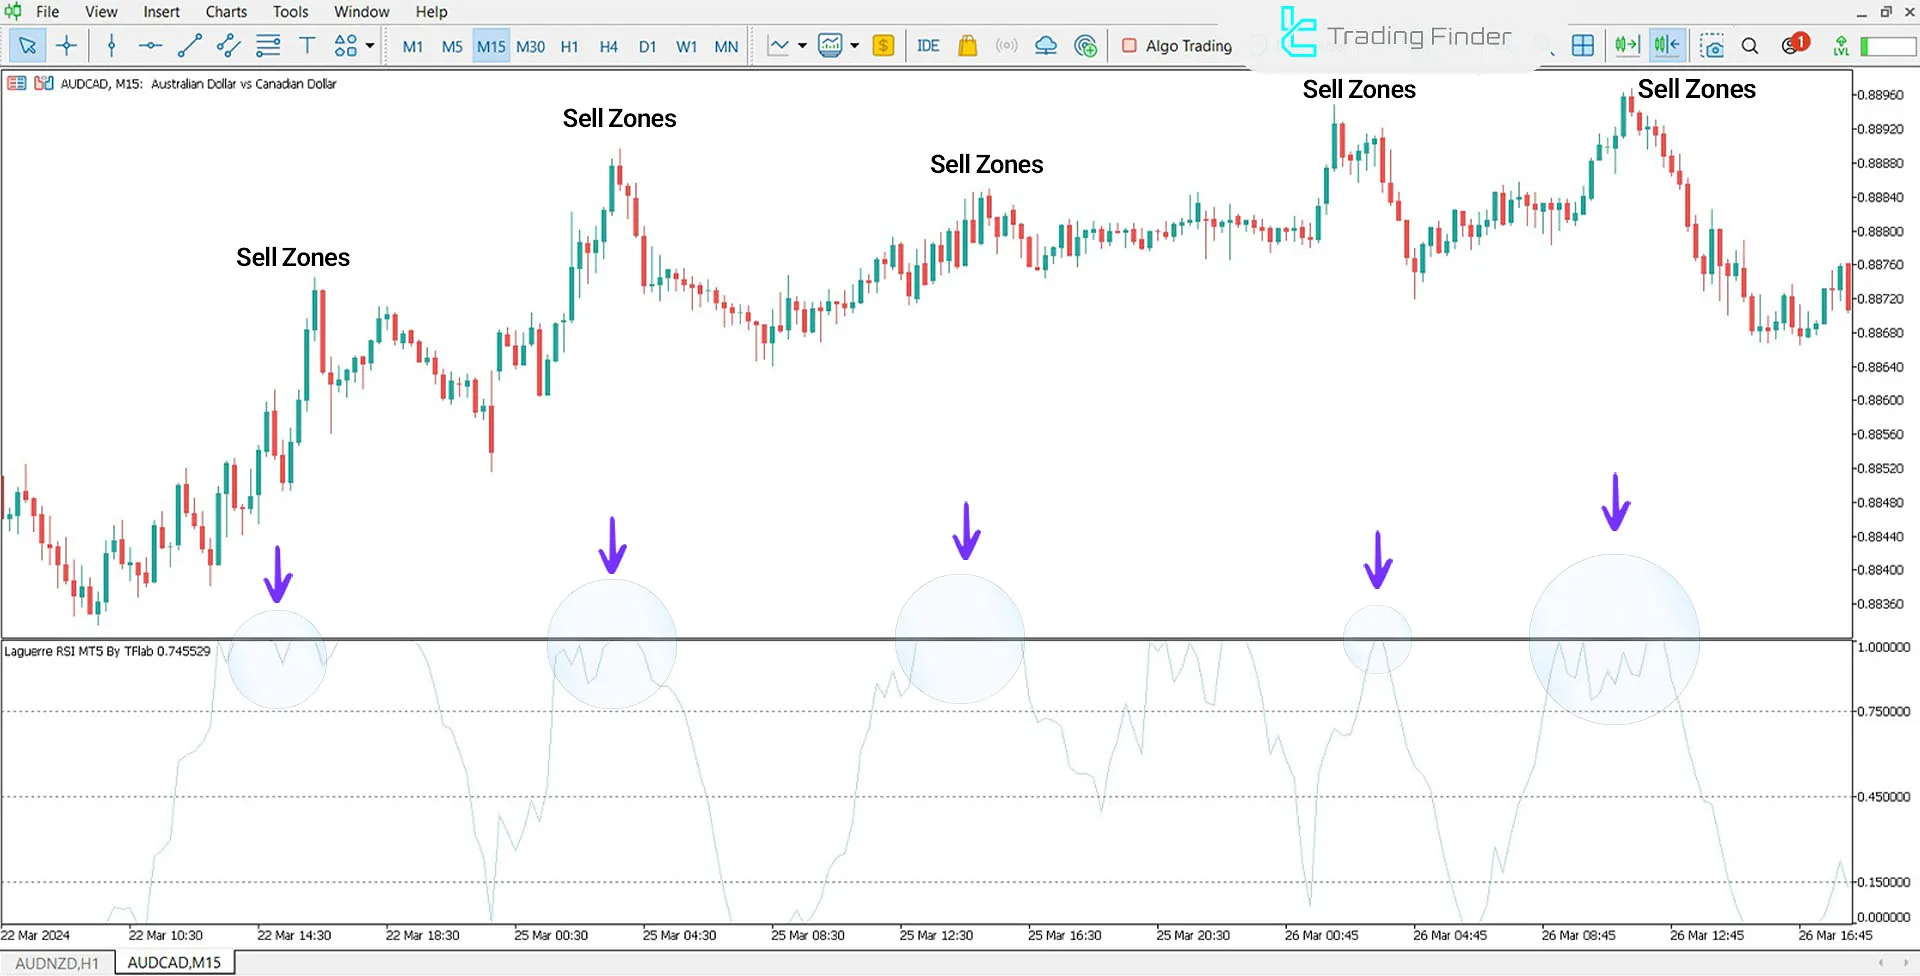
Like RSI, the Laguerre RSI indicator generates trading signals by crossing overbought and oversold levels. The default coefficient for this indicator is set at 0.7, which traders can adjust based on their strategy. When the blue lines drop below the 0.15 level, it presents a buying opportunity, and if it rises above 0.75, it signals a selling opportunity. These areas are crucial for identifying overbought (Buy) and oversold (Sell) zones in the market.
Indicator in an Uptrend
When the indicator line reaches its minimum and moves horizontally, it indicates the beginning of a strong upward movement. The AUD/NZD price chart creates a suitable buying opportunity when the price drops below 0.15.

Indicator in a Downtrend
In the AUD/CAD price chart, during an uptrend, when the blue line reaches above 0.75, it presents a selling opportunity for traders. The horizontal movement near zero indicates sustained strength in the downward direction, which this indicator identifies.

Indicator Settings

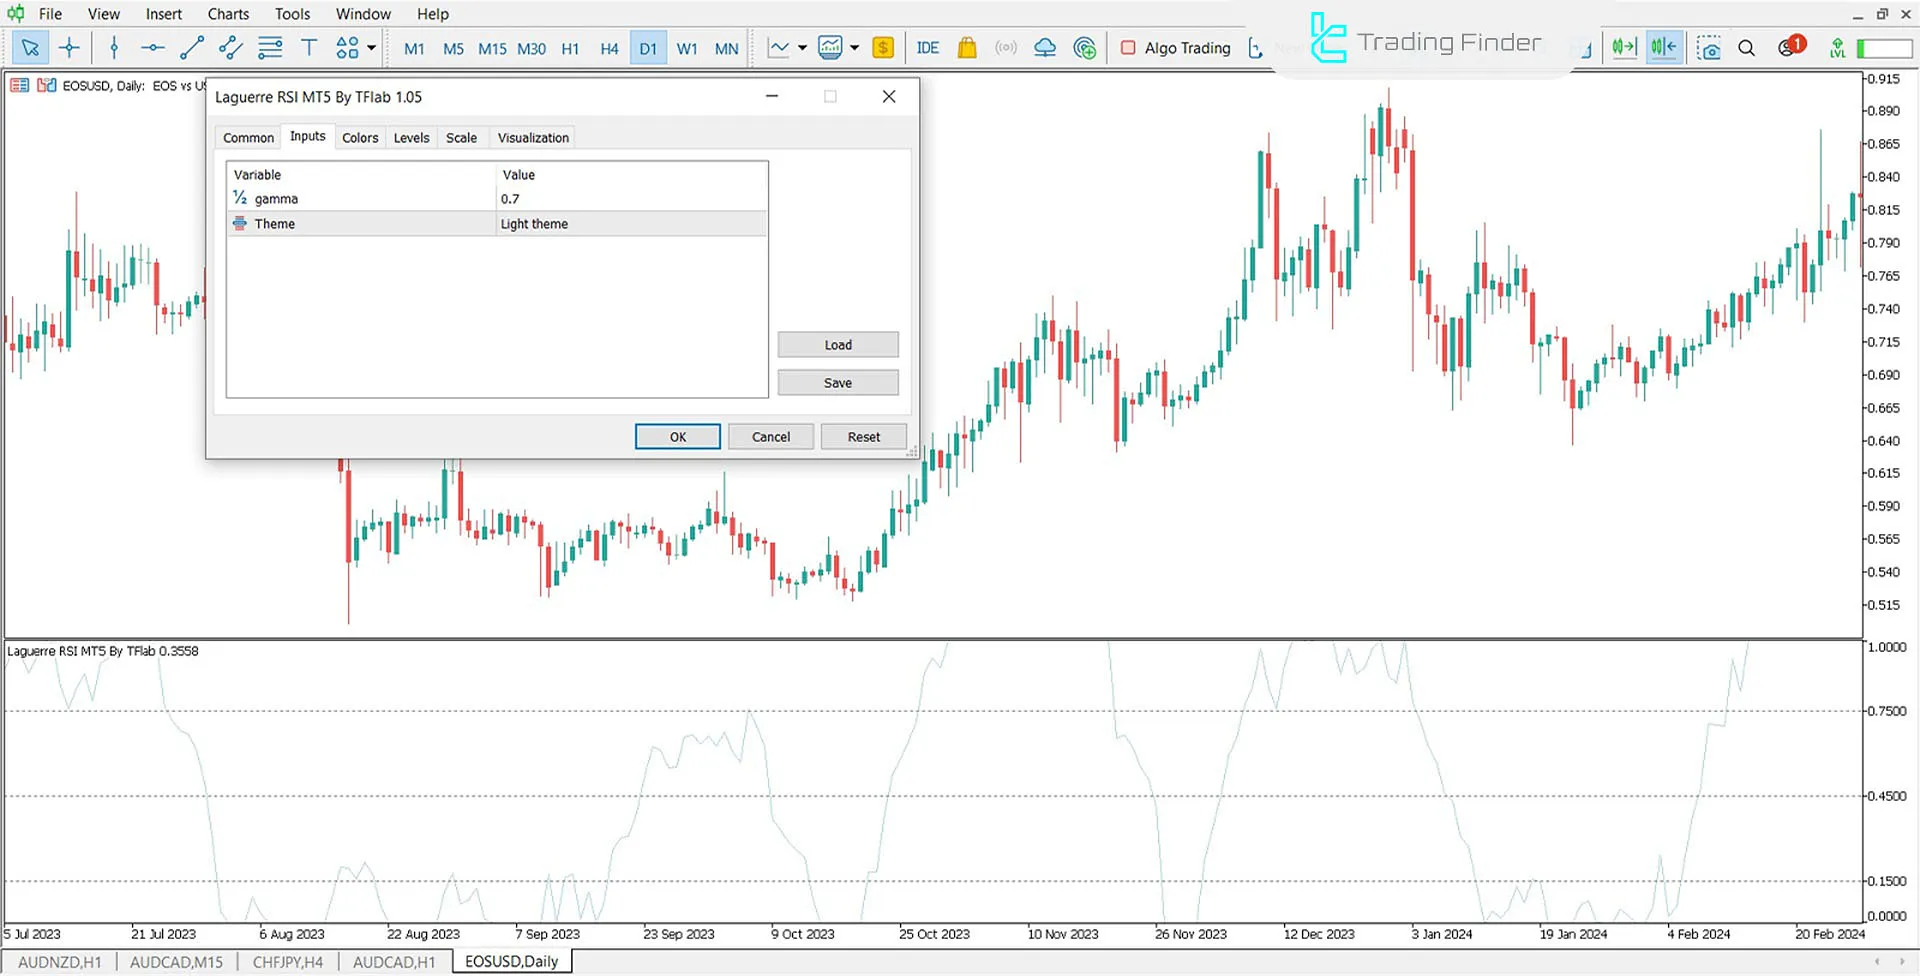
- Multiplier of RSI: Change the coefficient value;
- Theme of the chart: Background color of the chart.
Conclusion
The Laguerre RSI indicator, one of the MetaTrader 5 oscillators, works well for both beginner and professional Forex market traders. Beginner traders can identify better trading signals compared to the classic RSI, while professional traders can use this indicator in more complex trading strategies.
This indicator functions well across all daily, weekly, and monthly time frames and in short-term (Intraday) charts.
Laguerre RSI MT5 PDF
Laguerre RSI MT5 PDF
Click to download Laguerre RSI MT5 PDFWhat is the difference between the Laguerre RSI and the classic RSI?
The main difference is that it eliminates signal delays and reduces price noise, resulting in fewer false signals.
How can the Gamma coefficient of the Laguerre RSI indicator be adjusted?
In the indicator's settings section, there is an option to change the coefficient, allowing traders to adjust the default 0.7 coefficient according to their trading strategy.


