![MACD Divergence Indicator for MetaTrader5 Download - Free - [TFLab]](https://cdn.tradingfinder.com/image/104985/10-2-en-macd-divergence-mt5.webp)
![MACD Divergence Indicator for MetaTrader5 Download - Free - [TFLab] 0](https://cdn.tradingfinder.com/image/104985/10-2-en-macd-divergence-mt5.webp)
![MACD Divergence Indicator for MetaTrader5 Download - Free - [TFLab] 1](https://cdn.tradingfinder.com/image/34381/10-02-en-macd-divergence-mt5-02.avif)
![MACD Divergence Indicator for MetaTrader5 Download - Free - [TFLab] 2](https://cdn.tradingfinder.com/image/34384/10-02-en-macd-divergence-mt5-03.avif)
![MACD Divergence Indicator for MetaTrader5 Download - Free - [TFLab] 3](https://cdn.tradingfinder.com/image/34391/10-02-en-macd-divergence-mt5-04.avif)
The MACD Divergence indicator is one of the MetaTrader 5 indicators and is an essential tool in technical analysis.
Detectingdivergence in price charts is crucial for predicting trend reversal points. Therefore, to predict bullish trends, one can use the bullish divergence signals of the indicator. Similarly, one can benefit from the bearish divergence signals indicated by the indicator for identifying bearish trends.
The functionality of this indicator is such that a buy signal appears on the chart whenpositive divergence (D+) occurs, and a sell signal appears when negative divergence (D-) occurs.
Indicator Table
|
Indicator Categories:
|
Oscillators MT5 Indicators
Signal & Forecast MT5 Indicators
Currency Strength MT5 Indicators
|
|
Platforms:
|
MetaTrader 5 Indicators
|
|
Trading Skills:
|
Elementary
|
|
Indicator Types:
|
Non-Repaint MT5 Indicators
Reversal MT5 Indicators
|
|
Timeframe:
|
Multi-Timeframe MT5 Indicators
|
|
Trading Style:
|
Swing Trading MT5 Indicators
Scalper MT5 Indicators
Day Trading MT5 Indicators
Fast Scalper MT5 Indicators
|
|
Trading Instruments:
|
Forex MT5 Indicators
Crypto MT5 Indicators
Stock MT5 Indicators
Commodity MT5 Indicators
Indices MT5 Indicators
Share Stock MT5 Indicators
|
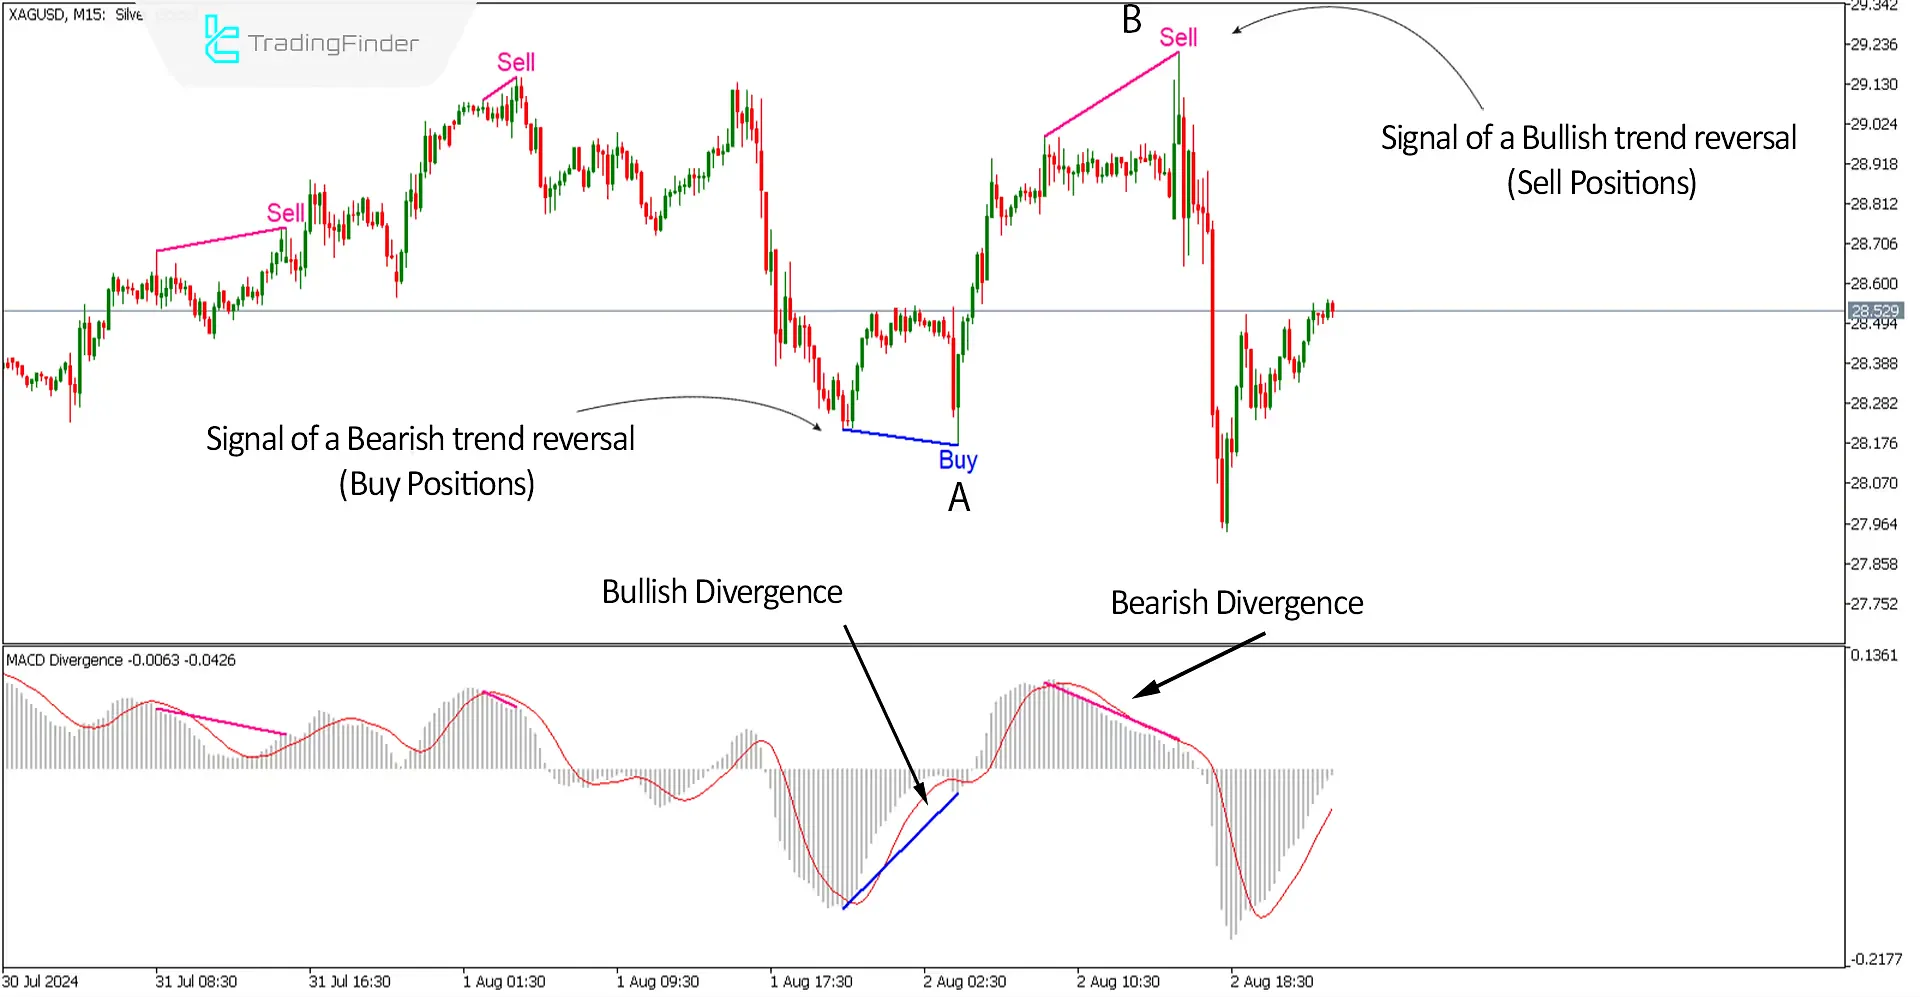
The image describes a 15-minute price chart for global silver with the symbol (XAGUSD). At point (A), following a downward trend, the latest low is lower than the previous low (LL).
Still, the MACD indicator showsbullish (positive) divergence, leading to a transition from a downtrend to an uptrend. At point (B), after an upward trend, the latest high is higher than the previous high (HH), but a bearish (negative) divergence appears on the MACD indicator, causing the trend to shift from uptrend to downtrend.

Overview
The MACD Divergence indicator is a vital technical analysis tool for identifying the main trend direction or trend reversals and can be used alongside various analytical styles.
This indicator is handy for traders who want to quickly identifydivergences in the price chart without spending much time analyzing them manually.
Uptrend Signals
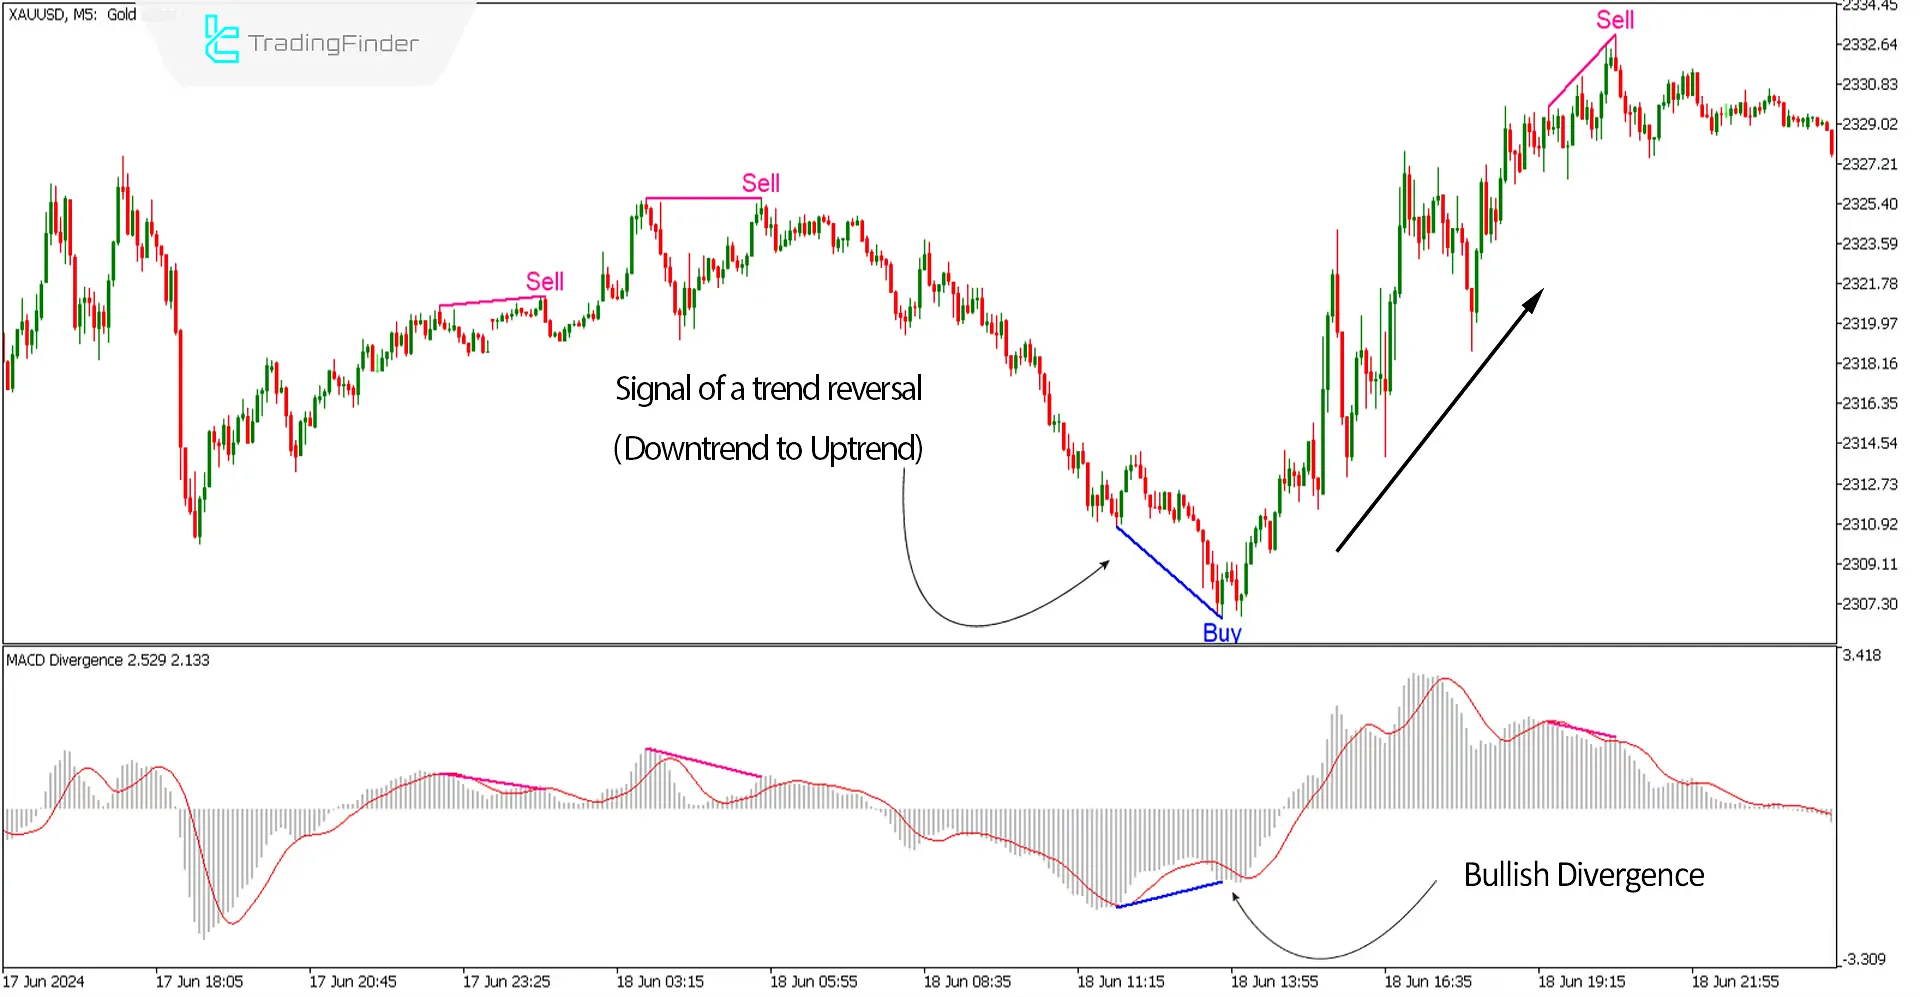
The 5-minute price chart of gold in US dollars with the symbol (XAUUSD) is shown in the image described. At the end of a downward trend, the MACD Divergence indicator identifies a bullish divergence between the latest lows and issues a (BUY) signal on the price chart.
In this situation, one can look for an appropriate confirmation(Trigger) according to their analytical style, whether classical or modern, to enter long (buy) positions.

Downtrend Signals
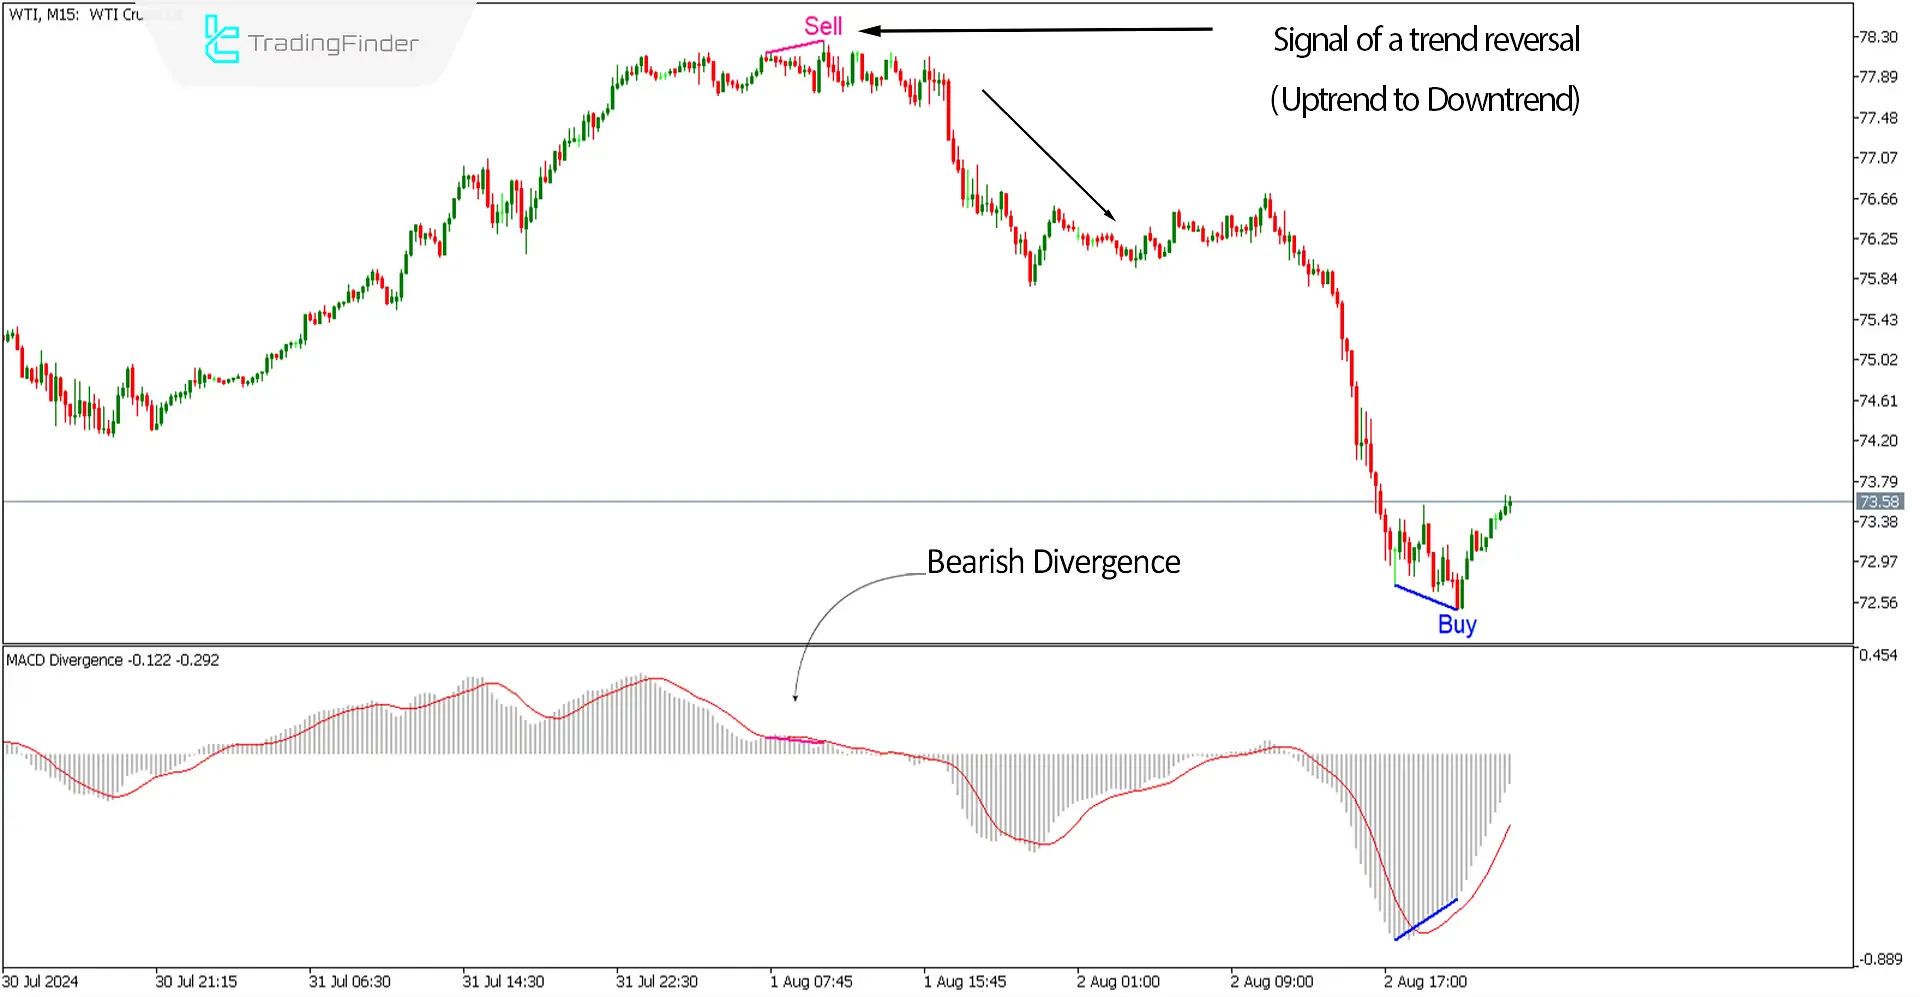
The image described shows the 15-minute price chart of Texas oil with the symbol (WTI). At the end of an upward trend, the indicator detects a bearish (negative) divergence between the two latest peaks and issues a (SELL) signal on the price chart.
In this situation, one can look for an appropriate confirmation(Trigger) according to their analytical style, whether classical or modern, to enter short (sell) positions.

Settings of the MACD Divergence Indicator

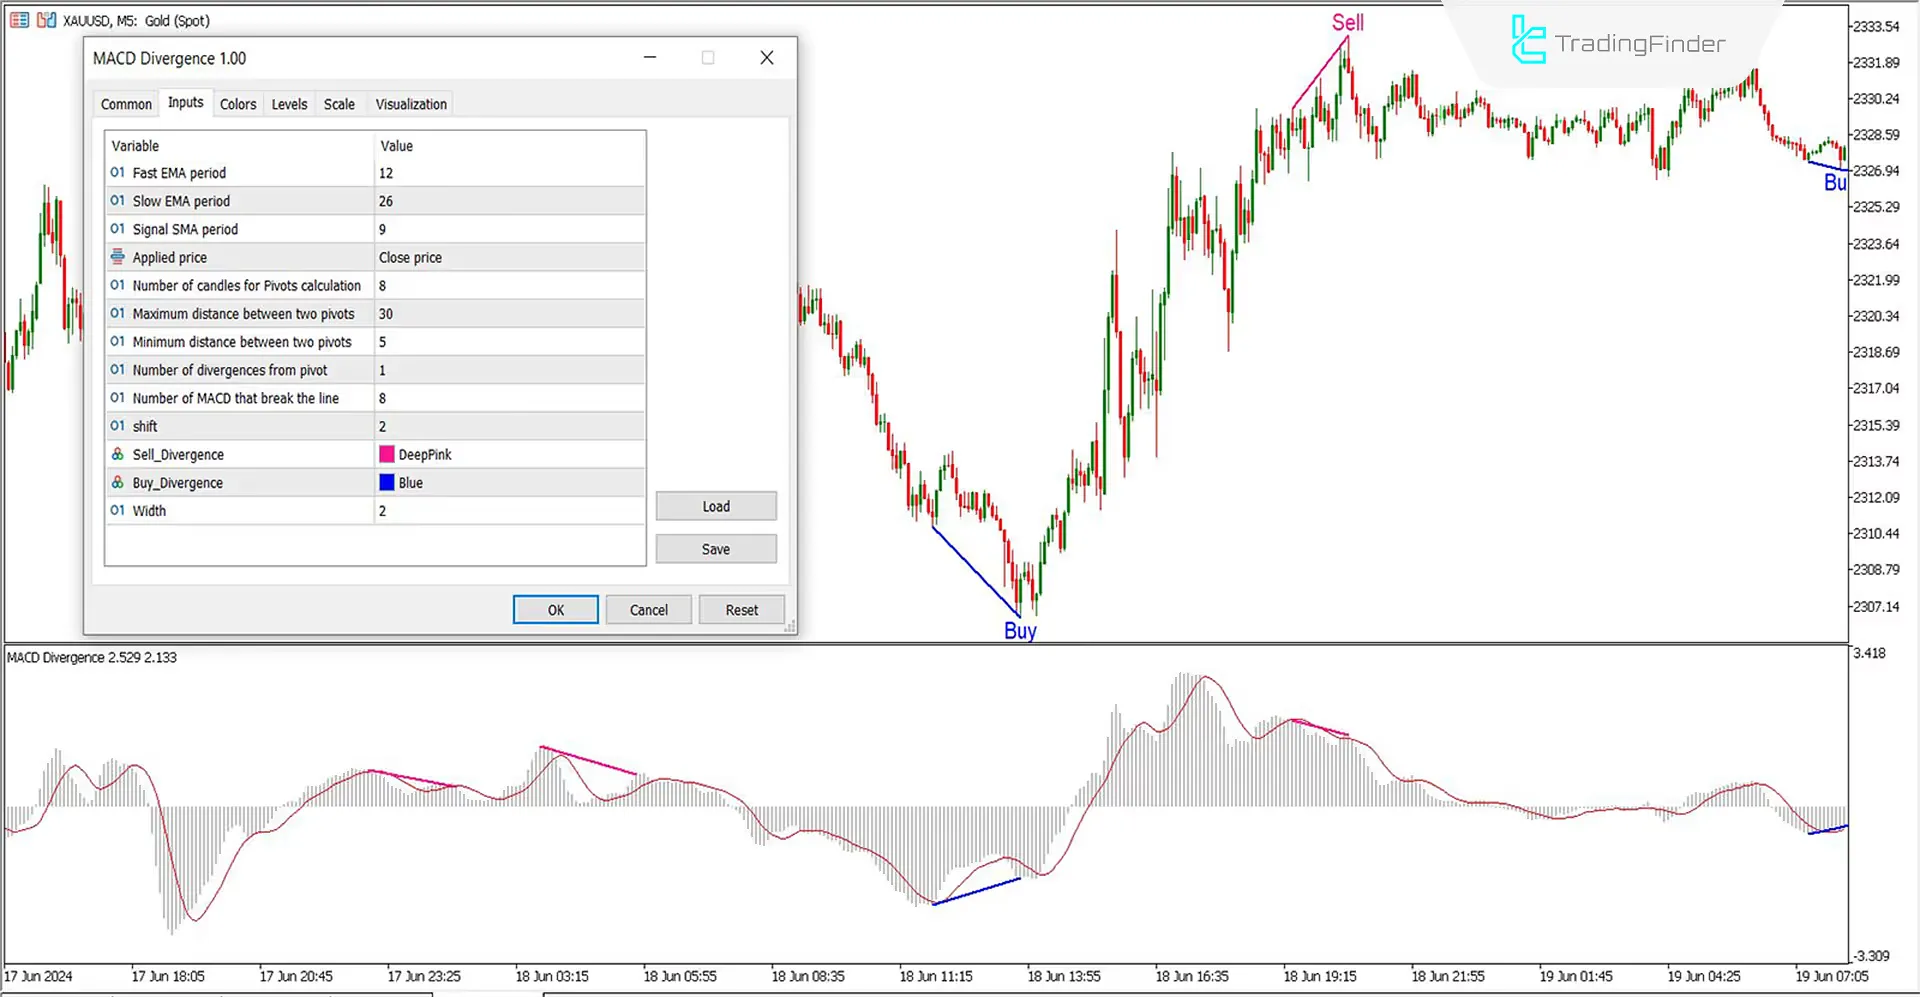
- Fast EMA Period: Use a 12-period moving average for the fast EMA;
- Slow EMA Period: Use a 26-period moving average for the slow EMA;
- Signal SMA Period: Set the signal line (colored red) to a 9-period moving average;
- Applied Price: The indicators are calculated based on the closing price (Close price);
- Number of Candles for Pivots Calculation: Set the number of candles for calculating pivots to 8;
- Maximum Distance Between Two Pivots: The maximum distance between two pivots is 30;
- Minimum Distance Between Two Pivots: The minimum distance between two pivots is 5;
- Number of Divergences from Pivot: There is one divergence from each pivot;
- Number of MACD that Break the Line: The number of line breaks by the MACD is 8;
- Shift: The shift parameter is set at 2;
- Sell Divergence: You can choose the color for selling divergence signals, such as pink or any color you prefer;
- Buy Divergence: Choose the color for buying divergence signals, such as blue or any color you prefer;
- Width: Set the width of the divergence line to 2.
Summary
Major trend reversals in price charts often occur with the appearance of divergences, making divergences some of the most critical indicators in trading strategies that prioritize reversal points.
Traders can use divergences to identify changes intrend directions or the continuation of strong trends in their trading strategies. A divergence occurs when the price and indicator behavior move in opposite directions.
The discrepancy between the price behavior and the indicator serves as a signal for potential trend reversals. Utilizing this Oscillators Metatrader is particularly beneficial for traders who must become fully adept at handling divergence-related concepts.
What is the use of the MACD Divergence indicator?
The MACD Divergence indicator automatically identifies divergences in price charts for traders who do not have the time to examine these signals manually or are not entirely familiar with divergences.
This makes it an accessible tool for those needing quick insights into potentialreversal points without deep technical analysis.
Does the MACD Divergence indicator identify the direction of price movements?
Yes, this indicator is highly effective in identifying crucial reversal or continuation points in price trends, which typically have a high win rate.
It presents these findings assignals, providing traders with the confidence to make informed decisions about market entries and exits based on trend changes.