![Market Crash Alert Indicator for MetaTrader 5 - Free Download [TFlab]](https://cdn.tradingfinder.com/image/464909/2-109-en-market-crash-alert-mt5-1.webp)
![Market Crash Alert Indicator for MetaTrader 5 - Free Download [TFlab] 0](https://cdn.tradingfinder.com/image/464909/2-109-en-market-crash-alert-mt5-1.webp)
![Market Crash Alert Indicator for MetaTrader 5 - Free Download [TFlab] 1](https://cdn.tradingfinder.com/image/464906/2-109-en-market-crash-alert-mt5-2.webp)
![Market Crash Alert Indicator for MetaTrader 5 - Free Download [TFlab] 2](https://cdn.tradingfinder.com/image/464919/2-109-en-market-crash-alert-mt5-3.webp)
![Market Crash Alert Indicator for MetaTrader 5 - Free Download [TFlab] 3](https://cdn.tradingfinder.com/image/464921/2-109-en-market-crash-alert-mt5-4.webp)
The Market Crash Alert Indicator is a technical analysis tool designed to detect sudden and sharp price jumps in markets by analyzing the size of candlestick bodies across specific timeframes.
When a candle forms with a significantly larger body than the average within the market’s price structure, it indicates an abnormal price fluctuation.
The indicator highlights this as a critical signal using colored oscillator bars or a text alert on the chart.
Market Crash Alert Indicator Table
The following table provides a general overview of the core features of the Market Crash Alert Indicator:
Indicator Categories: | Oscillators MT5 Indicators Trading Assist MT5 Indicators Momentum Indicators in MT5 |
Platforms: | MetaTrader 5 Indicators |
Trading Skills: | Elementary |
Indicator Types: | Reversal MT5 Indicators |
Timeframe: | Multi-Timeframe MT5 Indicators |
Trading Style: | Intraday MT5 Indicators |
Trading Instruments: | Forex MT5 Indicators Crypto MT5 Indicators Stock MT5 Indicators Commodity MT5 Indicators Indices MT5 Indicators Share Stock MT5 Indicators |
Market Crash Alert Indicator Overview
The Market Crash Alert Indicator, by focusing on the analysis of candlestick volatility range, acts as a tool for identifying unusual price actions in financial markets.
Its operation revolves around detecting high-momentum candles, often indicating the start of a fast and directional price movement.
The output is displayed as colored bars in the oscillator panel, described as follows:
- Green Bars: Represent dominant buyer strength and indicate the beginning or continuation of a strong bullish move;
- Red Bars: Signal selling pressure and a sharp bearish move in the market.
Uptrend Conditions
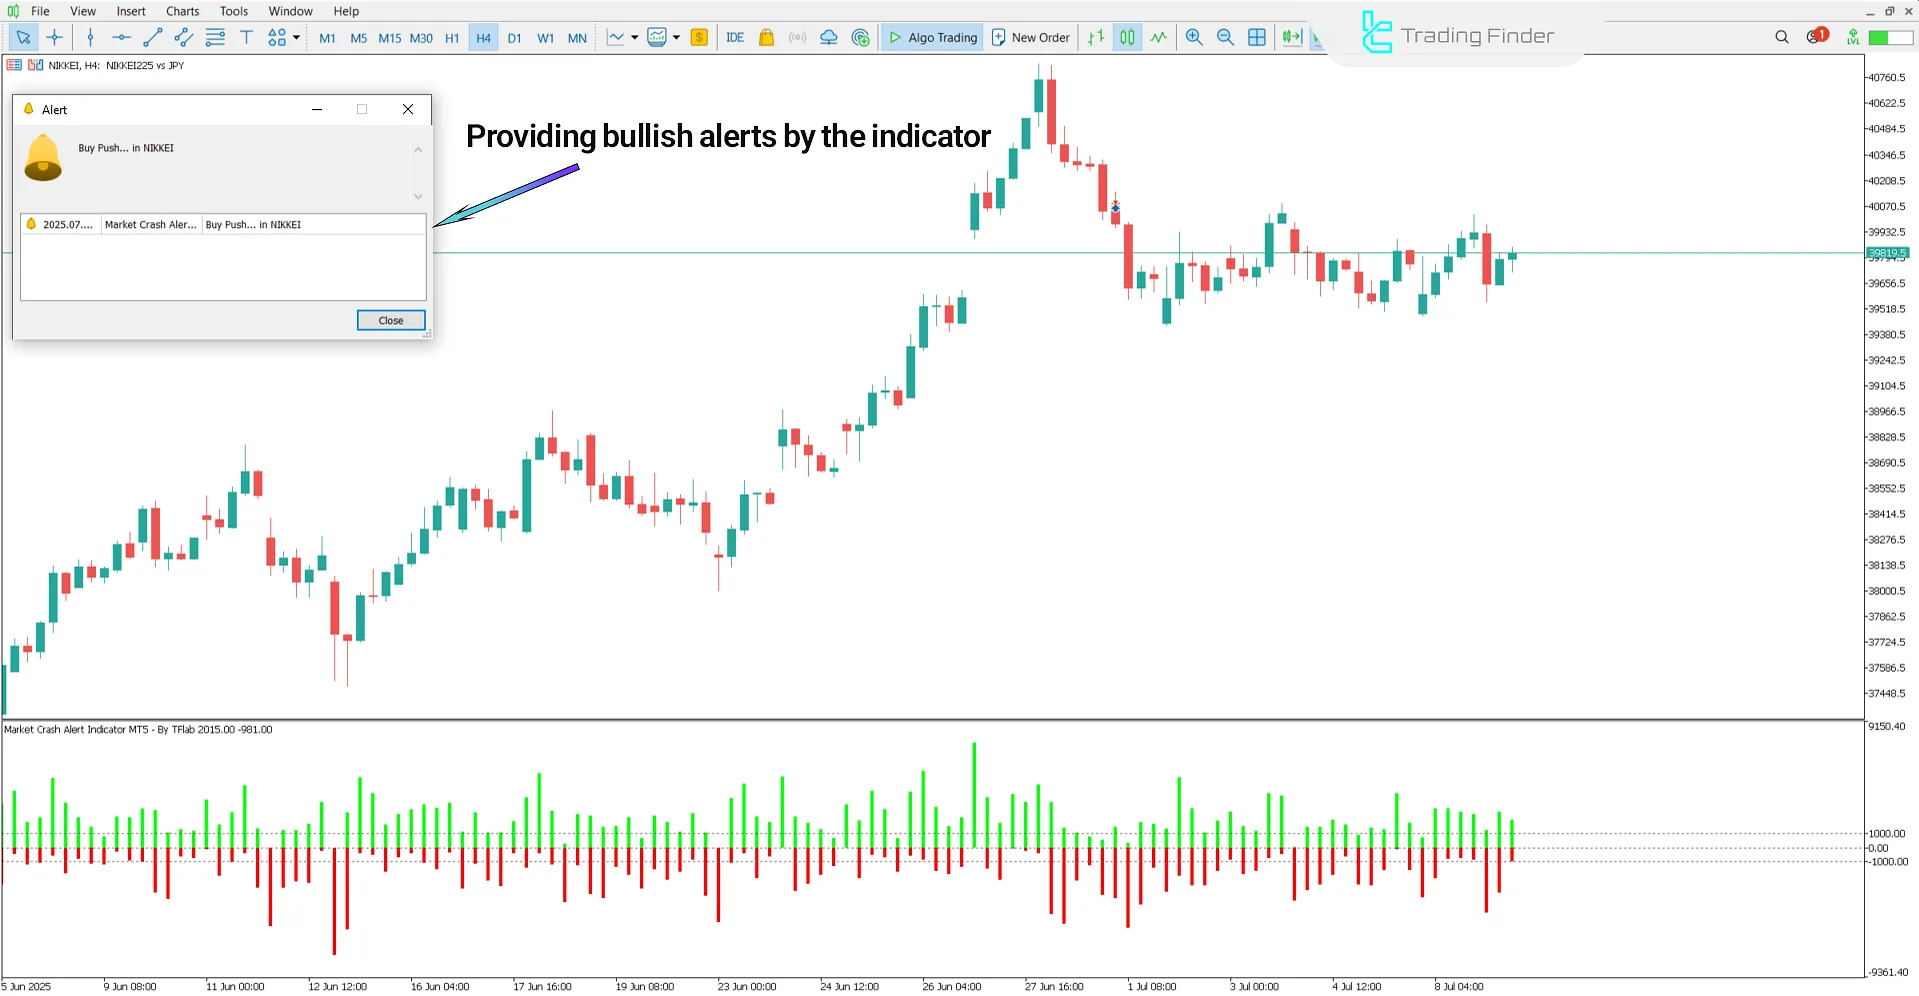
The price chart below shows the Nikkei 225 Index (NIKKEI225) on the 4-hour timeframe.
When the strength of the green bar exceeds the red bar, and the green bar’s value crosses above 1000, it signals the beginning of a strong upward trend.
In such conditions, the market enters a powerful phase, making it a suitable time to enter buy positions.

Downtrend Conditions
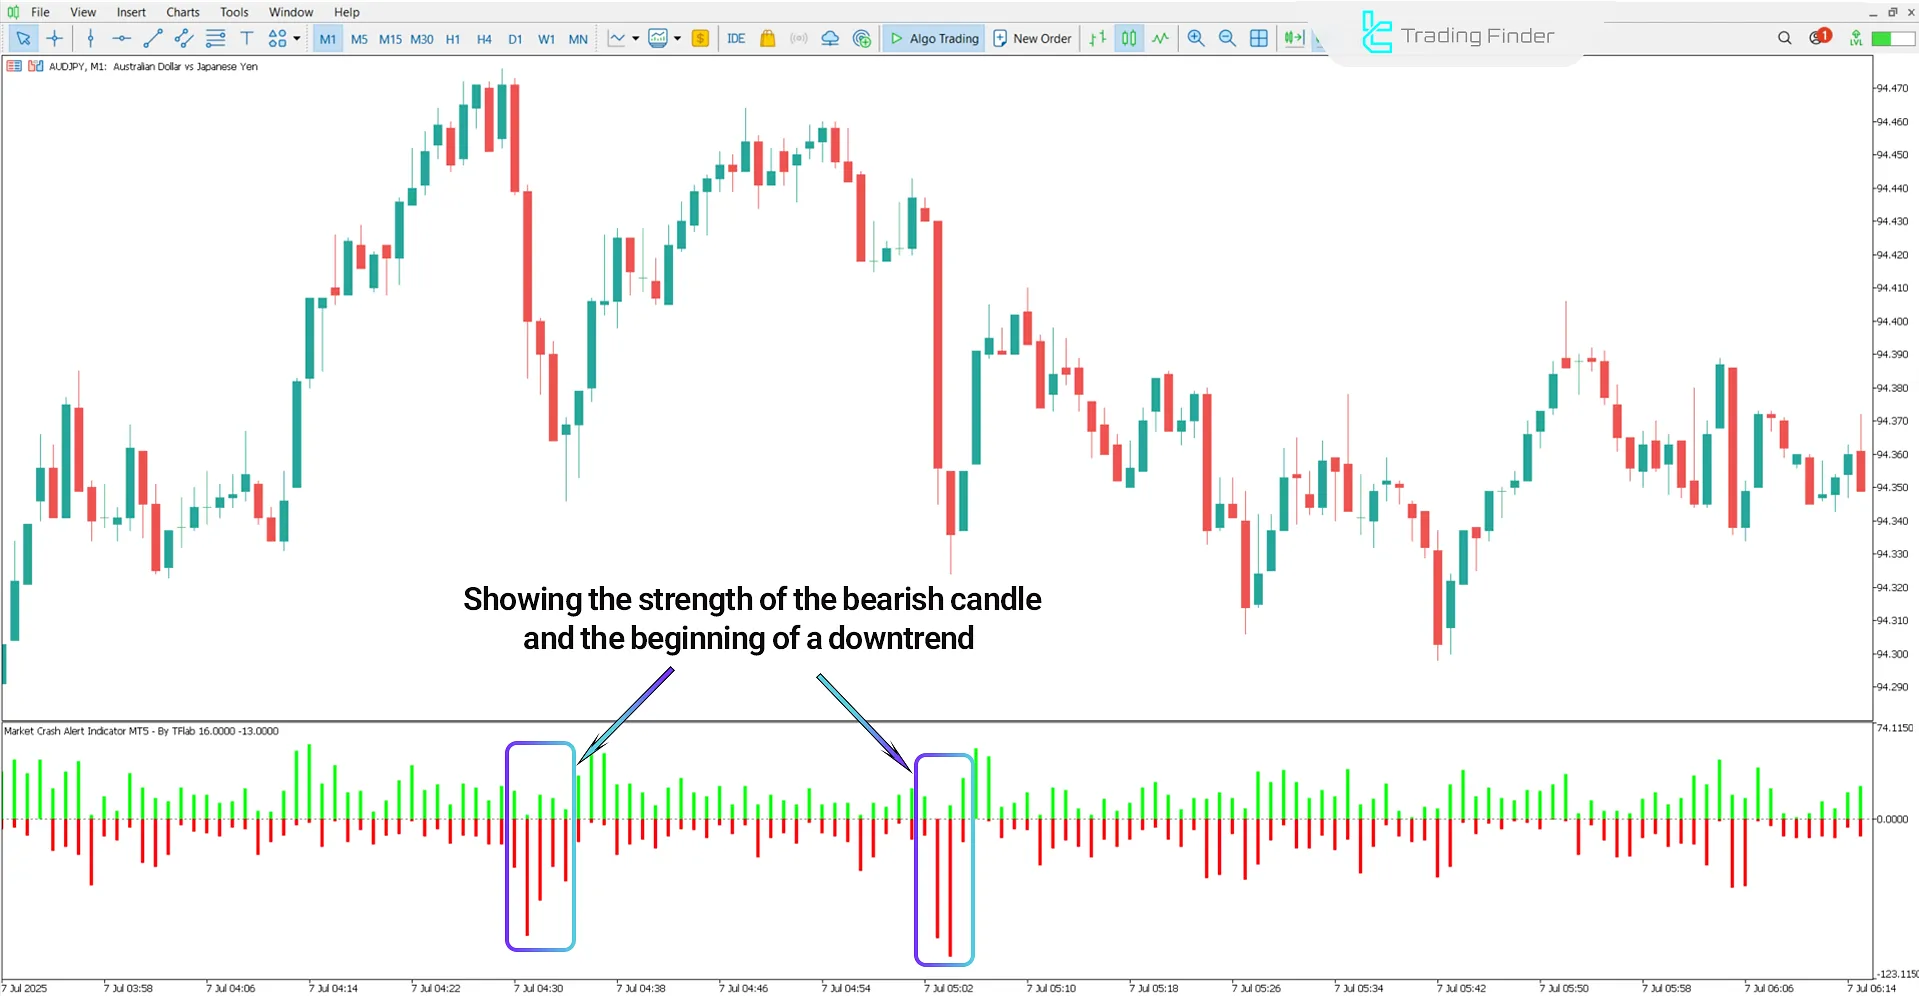
The following chart displays the AUD/JPY currency pair in the 1-minute timeframe.
In this oscillator, when selling pressure dominates over buying power, a bearish move forms. If the red bar drops below the critical 1000-level, it indicates the start of a strong downward movement.
At this point, the indicator displays a text warning on the chart to highlight a suitable entry zone for selling.

Market Crash Alert Indicator Settings
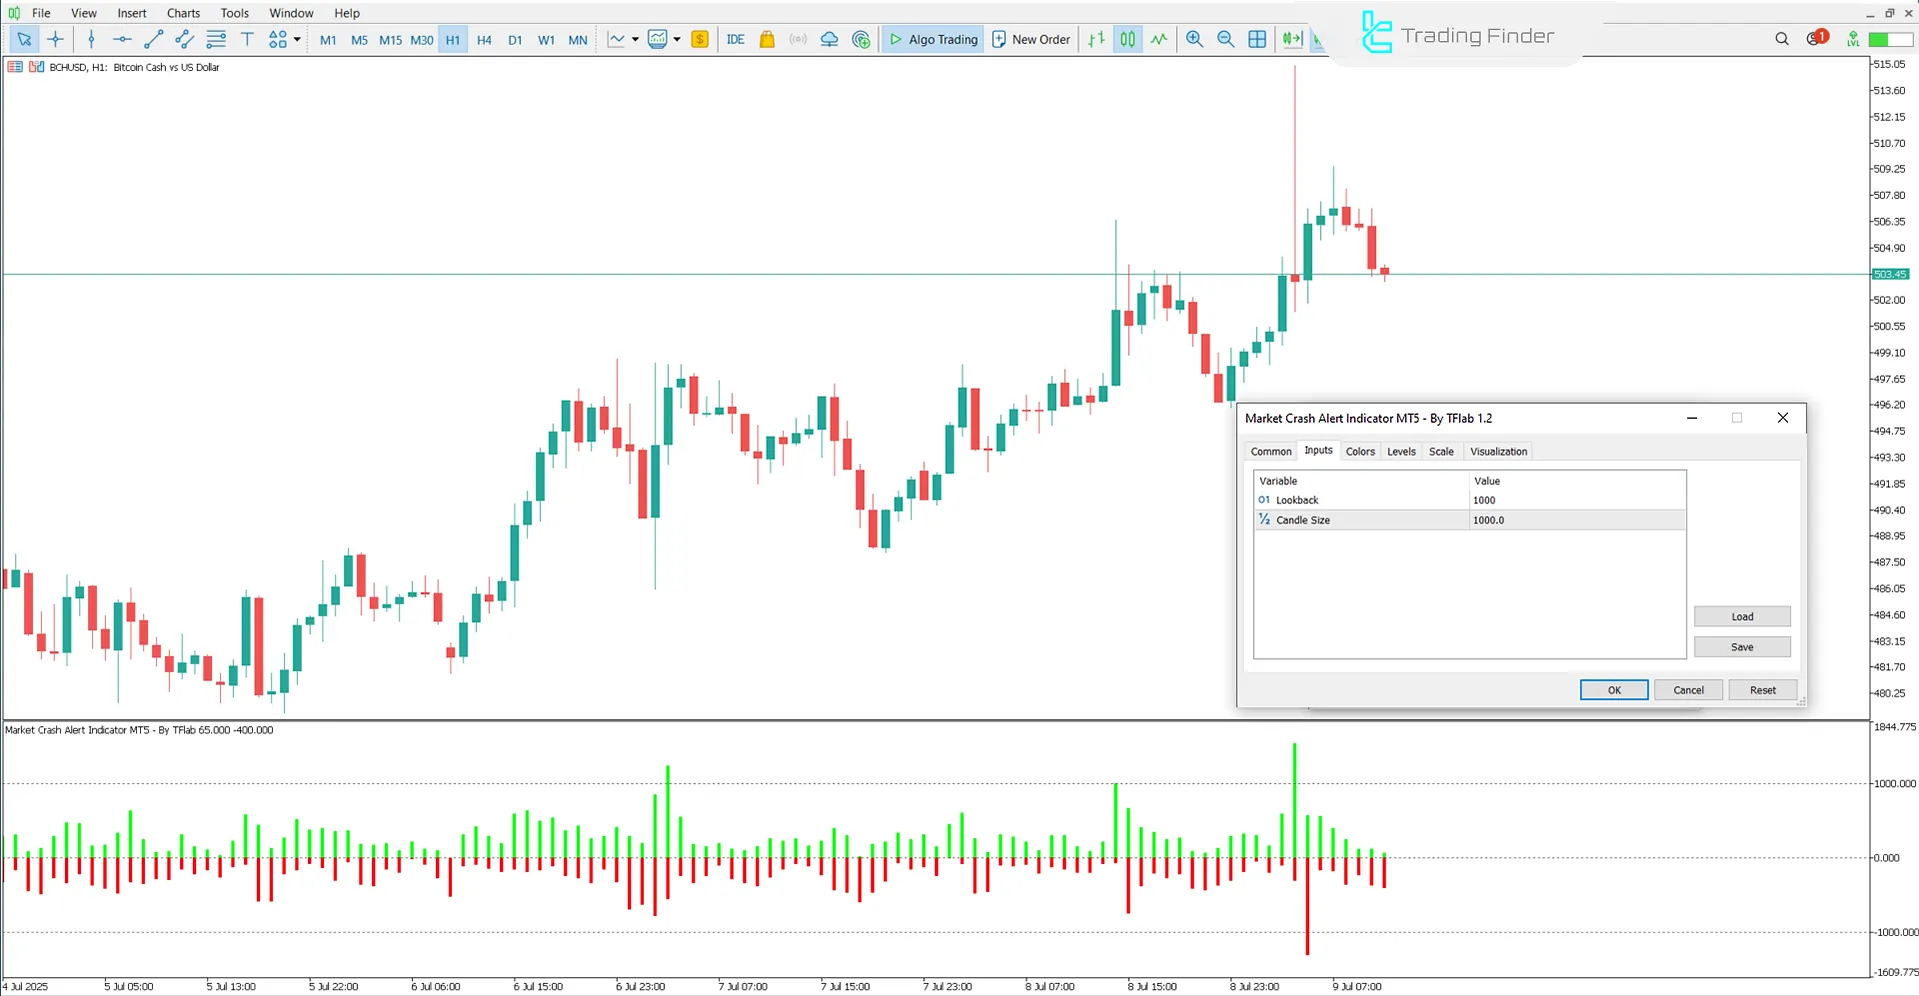
The image below shows the customizable settings panel of the Market Crash Alert Oscillator:

- Lookback: Historical reference period;
- Candle Size: Candlestick body size.
Conclusion
The Market Crash Alert Oscillator identifies buyer or seller pressure by comparing the strength of green and red bars.
This trading tool not only reveals price direction, but also precisely measures momentum strength by evaluating whether bars break through the key 1000+ and 1000- levels.
These thresholds are vital for identifying high-momentum moves and possible strong liquidity inflows into the market.
Market Crash Alert MT5 PDF
Market Crash Alert MT5 PDF
Click to download Market Crash Alert MT5 PDFCan the Market Crash Alert Indicator be used in ranging or sideways markets?
No, this tool is not practical in ranging markets or markets without a clear directional bias.
Which timeframes are best suited for the Market Crash Alert Indicator?
This indicator can be used across all timeframes.


