![Multi Meter Indicator (MMI) for Meta Trader 5 Download - Free - [Trading Finder]](https://cdn.tradingfinder.com/image/107420/11-3-en-multi-meter-mt5.webp)
![Multi Meter Indicator (MMI) for Meta Trader 5 Download - Free - [Trading Finder] 0](https://cdn.tradingfinder.com/image/107420/11-3-en-multi-meter-mt5.webp)
![Multi Meter Indicator (MMI) for Meta Trader 5 Download - Free - [Trading Finder] 1](https://cdn.tradingfinder.com/image/29107/11-03-en-multui-meter-mt5-02.avif)
![Multi Meter Indicator (MMI) for Meta Trader 5 Download - Free - [Trading Finder] 2](https://cdn.tradingfinder.com/image/29112/11-03-en-multui-meter-mt5-03.avif)
![Multi Meter Indicator (MMI) for Meta Trader 5 Download - Free - [Trading Finder] 3](https://cdn.tradingfinder.com/image/29121/11-03-en-multui-meter-mt5-04.avif)
The Multi Meter Indicator (MMI) is a trend strength display tool that uses 9 volatility indicators available on MetaTrader 5 (MT5) for traders.
The MM indicator is a display that shows nine different indicators for easier analysis, such as the Parabolic SAR and Stochastic Oscillator with a 14-period, in the lower right corner of the chart for traders.
The MM indicator can help traders analyze trends and assess the strength of buyers and sellers in the market.
Indicator table
Indicator Categories: | Signal & Forecast MT5 Indicators Volatility MT5 Indicators Currency Strength MT5 Indicators Trading Assist MT5 Indicators |
Platforms: | MetaTrader 5 Indicators |
Trading Skills: | Intermediate |
Indicator Types: | Leading MT5 Indicators |
Timeframe: | M15-M30 Timeframe MT5 Indicators H1-H4 Timeframe MT5 Indicators |
Trading Style: | Intraday MT5 Indicators Scalper MT5 Indicators Day Trading MT5 Indicators |
Trading Instruments: | Forex MT5 Indicators Crypto MT5 Indicators Stock MT5 Indicators Share Stock MT5 Indicators |
Buy Signal of the Indicator

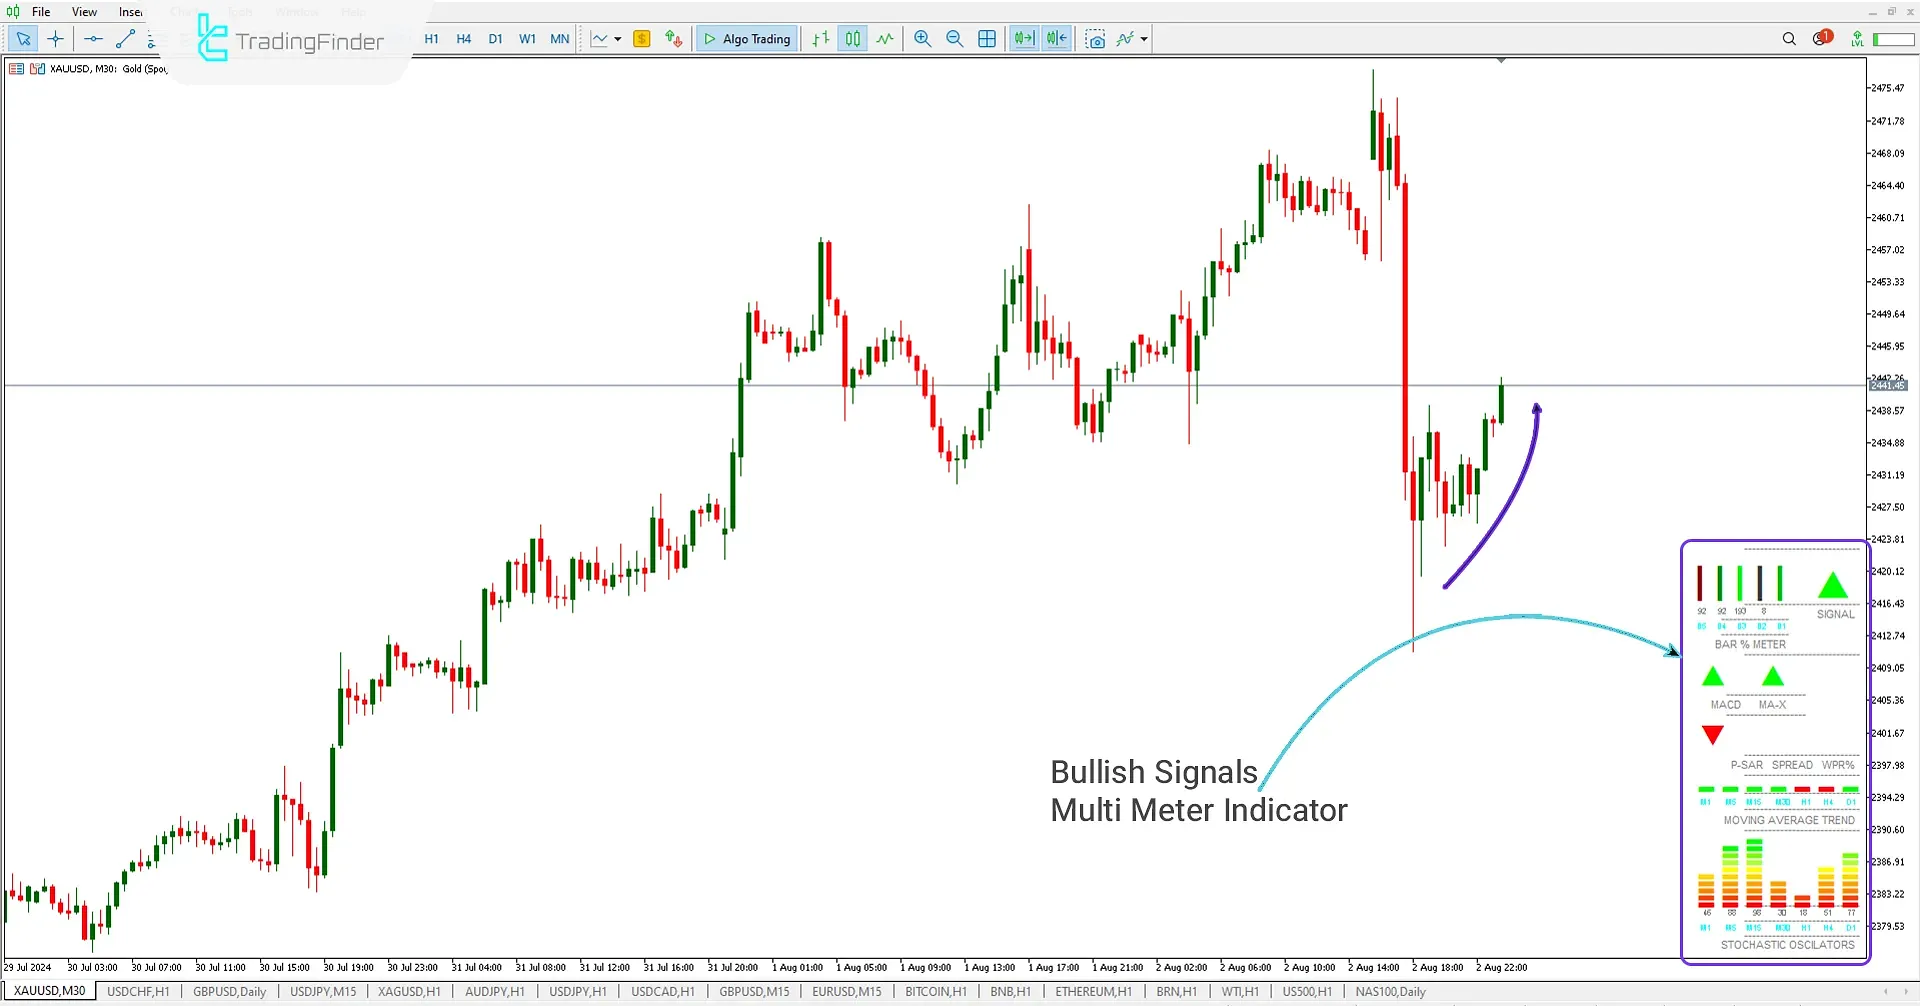
In the 30-minute (XAUUSD) chart, the MM indicator has issued a buy signal by analyzing 9 different indicators, all of which indicate an upward market trend.
The trader, upon seeing the signal and analyzing the data, can enter a buy trade (BUY).
Sell Signal of the Indicator

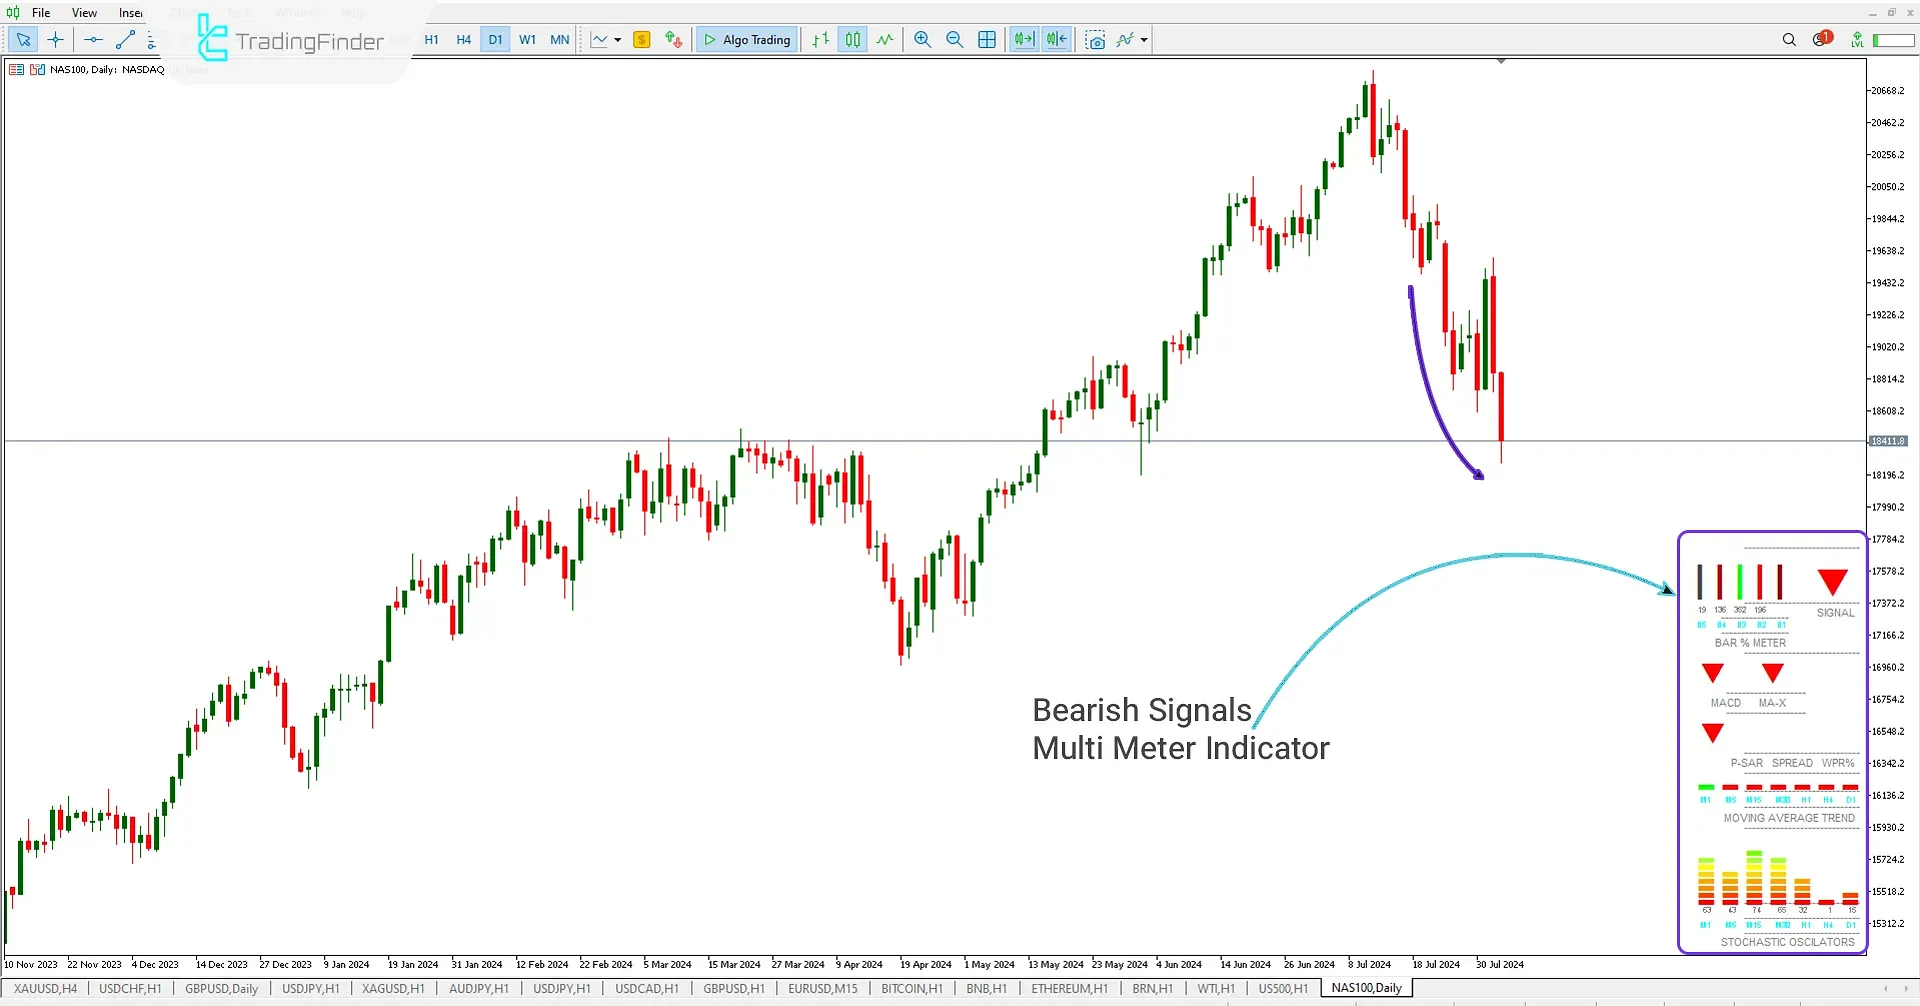
In the daily (NAS100) chart, the MM indicator has issued a sell signal by analyzing 9 different indicators, all of which indicate a downward market trend.
Upon seeing the signal and analyzing the data, the trader can enter a sell trade (SELL).
Indicator settings

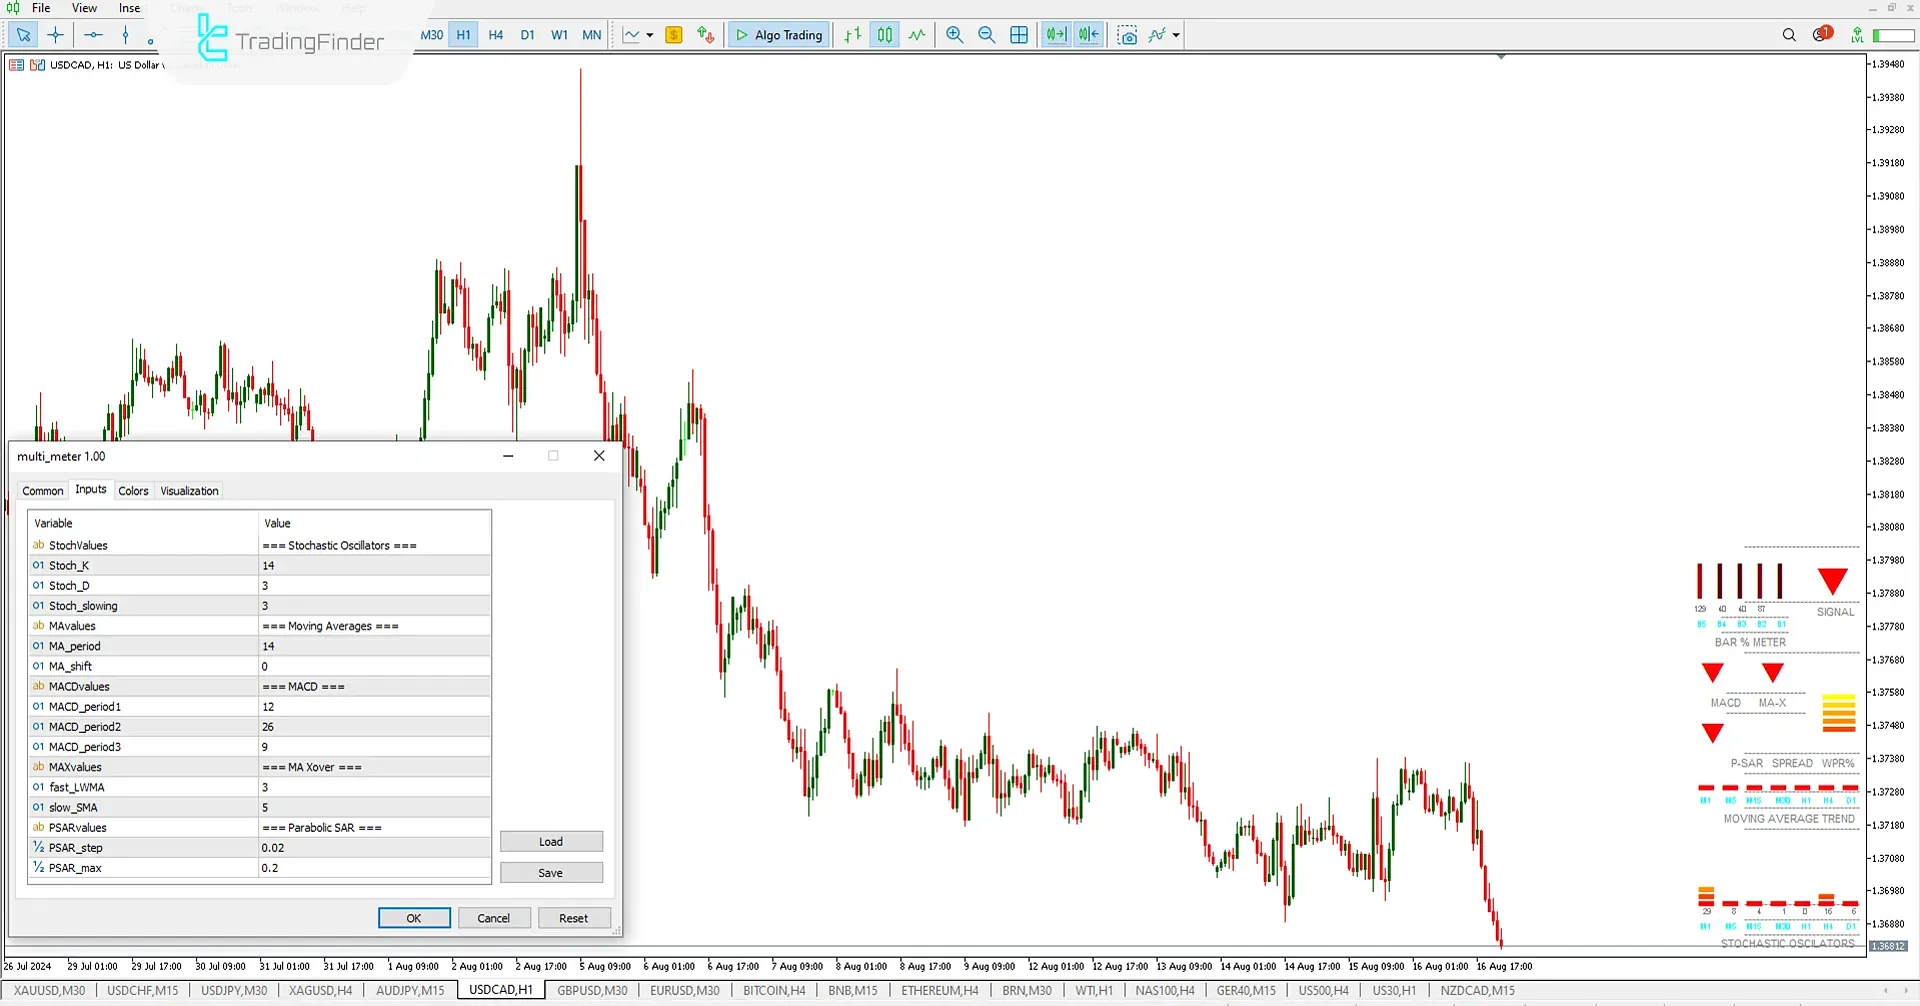
- StockValues: Stochastic Oscillator;
- Stock_K: Select the K value of the Stochastic Oscillator;
- Stock_D: Select the D value of the Stochastic Oscillator;
- Stoch_Slowing: Select the slow line value of the Stochastic Oscillator;
- MA_Values: Moving Average;
- MA_Period: Select the period of the Moving Average;
- MA_Shift: Calculate the Moving Average from which past candle;
- MACD_Values: MACD Indicator;
- MACD_Period1: Select the period for MACD FAST MA;
- MACD_Period2: Select the period for MACD SLOW MA;
- MACD_Period3: Select the period for the MACD Signal;
- MAXVALUES: MAX Indicator;
- FastLWMA: Select the period of the Linear Weighted Moving Average for the MA-X indicator;
- SlowSMA: Select the period of the Simple Moving Average for the MA-X indicator;
- PSARValues: Parabolic SAR (Parabolic SAR);
- PSAR_STEP: Select the step value for the Parabolic SAR;
- PSAR_MAX: Select the maximum value for the Parabolic SAR.
Summary
The Multi Meter (MM) indicator consolidates 9 Metatrader 5 indicators into a single histogram, preventing chart clutter and reducing trader confusion.
The MMI histogram simplifies chart analysis by displaying trend strength and buy/sell pressure in the market, making it more accessible for traders.
Multi Meter MMI MT5 PDF
Multi Meter MMI MT5 PDF
Click to download Multi Meter MMI MT5 PDFWhat information does the multi-meter indicator display?
This indicator typically displays information such as trend strength, the MACD indicator, trading spreads, and other essential data, providing the trader with a more comprehensive market analysis.
Is the Multi Meter indicator only available for MetaTrader 5?
No, the Multi Meter Indicator (MMI) is available for both Meta Trader 4 and MetaTrader 5 platforms. You can easily download the MetaTrader 4 version by visiting the top of the page.


