![Only One Trade a Day Indicator MT5 Download – Free – [TradingFinder]](https://cdn.tradingfinder.com/image/471337/13-171-en-only-one-trade-a-day-mt5-01.webp)
![Only One Trade a Day Indicator MT5 Download – Free – [TradingFinder] 0](https://cdn.tradingfinder.com/image/471337/13-171-en-only-one-trade-a-day-mt5-01.webp)
![Only One Trade a Day Indicator MT5 Download – Free – [TradingFinder] 1](https://cdn.tradingfinder.com/image/471335/13-171-en-only-one-trade-a-day-mt5-02.webp)
![Only One Trade a Day Indicator MT5 Download – Free – [TradingFinder] 2](https://cdn.tradingfinder.com/image/471334/13-171-en-only-one-trade-a-day-mt5-03.webp)
![Only One Trade a Day Indicator MT5 Download – Free – [TradingFinder] 3](https://cdn.tradingfinder.com/image/471333/13-171-en-only-one-trade-a-day-mt5-04.webp)
On aug 4, 2025, in version 2, alert/notification and signal functionality was added to this indicator
The Only One Trade a Day strategy indicator is developed to identify and visually display optimal buy and sell points on the MetaTrader 5 platform. This indicator utilizes two moving averages with different periods to analyze market trends.
It displays the results of its analysis via colored arrows – blue (for buy)and red (for sell) – directly on the chart.
Specification Table of the Only One Trade a Day Strategy Indicator
The following table outlines the specifications of the One Trade a Day indicator.
Indicator Categories: | Signal & Forecast MT5 Indicators Volatility MT5 Indicators Trading Assist MT5 Indicators |
Platforms: | MetaTrader 5 Indicators |
Trading Skills: | Elementary |
Indicator Types: | Reversal MT5 Indicators |
Timeframe: | Multi-Timeframe MT5 Indicators |
Trading Style: | Swing Trading MT5 Indicators Scalper MT5 Indicators Day Trading MT5 Indicators |
Trading Instruments: | Forex MT5 Indicators Crypto MT5 Indicators Stock MT5 Indicators |
A Glance at the Only One Trade a Day Indicator
The One Trade a Day indicator generates its signals based on the crossover of two moving averages with different periods. When the fast-moving average crosses above the slow one, a blue arrow appears on the chart indicating a buy signal.
Conversely, in the event of a downward crossover, a red arrow displayed representing a sell signal.
Buy Signal
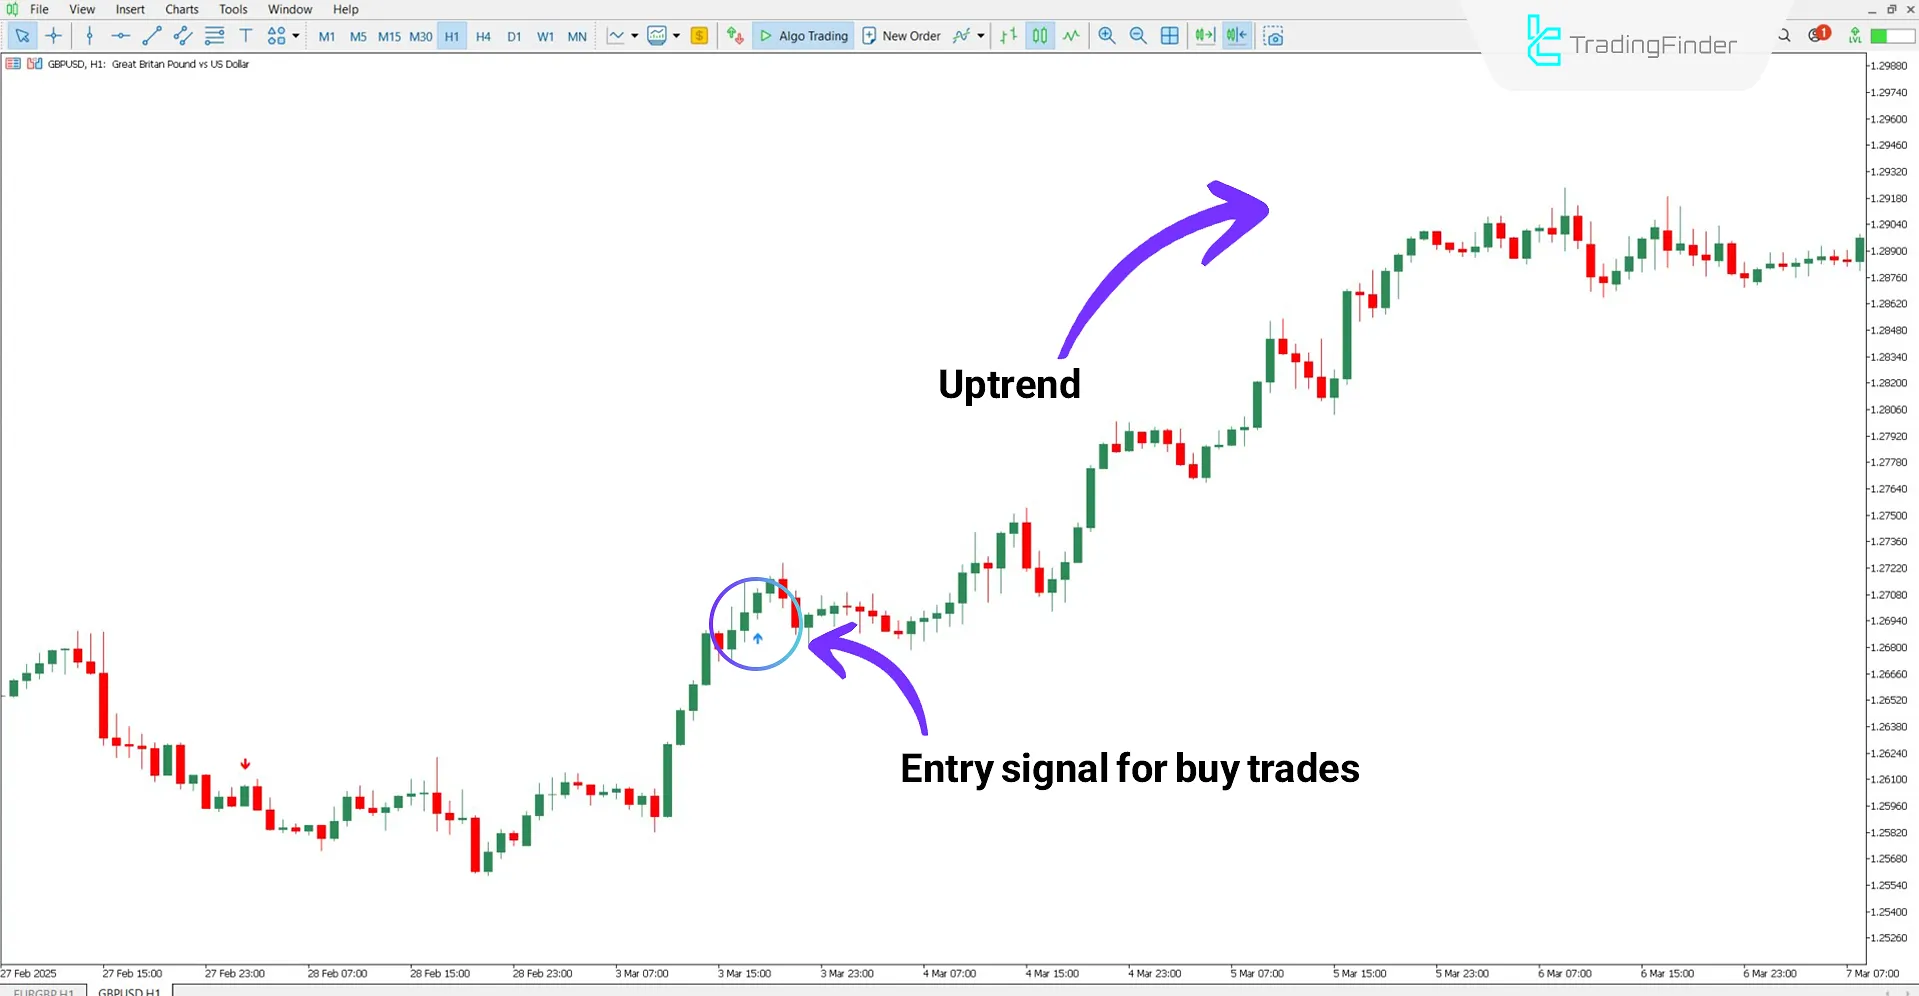
According to the analysis of the GBP/USD chart on the 1-hour timeframe, the appearance of a blue arrow on the chart indicates a Buy signal issued by the indicator. This marker forms as a result of the fast moving average crossing above the slow one, signaling the start of an uptrend.

Sell Signal
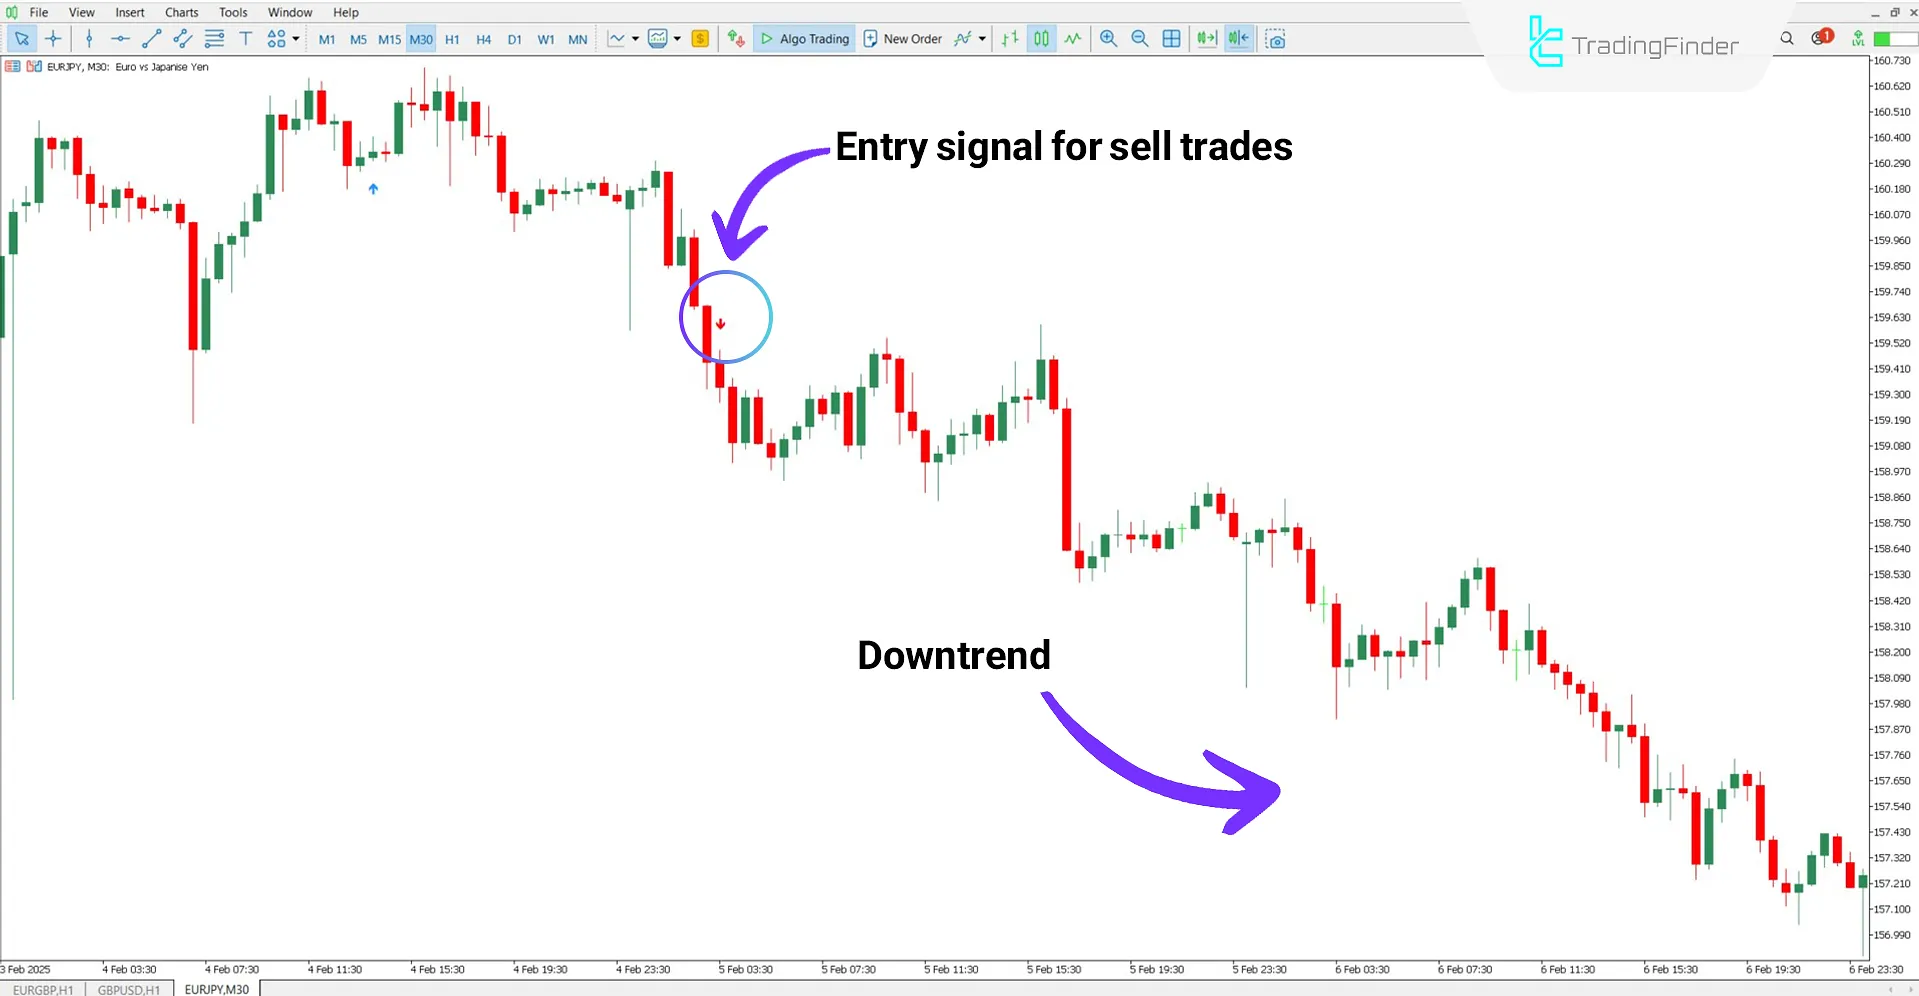
In an example using the EUR/JPY 30-minute chart, the appearance of a red arrow on the chart indicates the occurrence of a bearish crossover between the fast and slow moving averages. In this scenario, the point marked with a red arrow is a suitable entry for sell trades.

Only One Trade a Day Indicator Settings
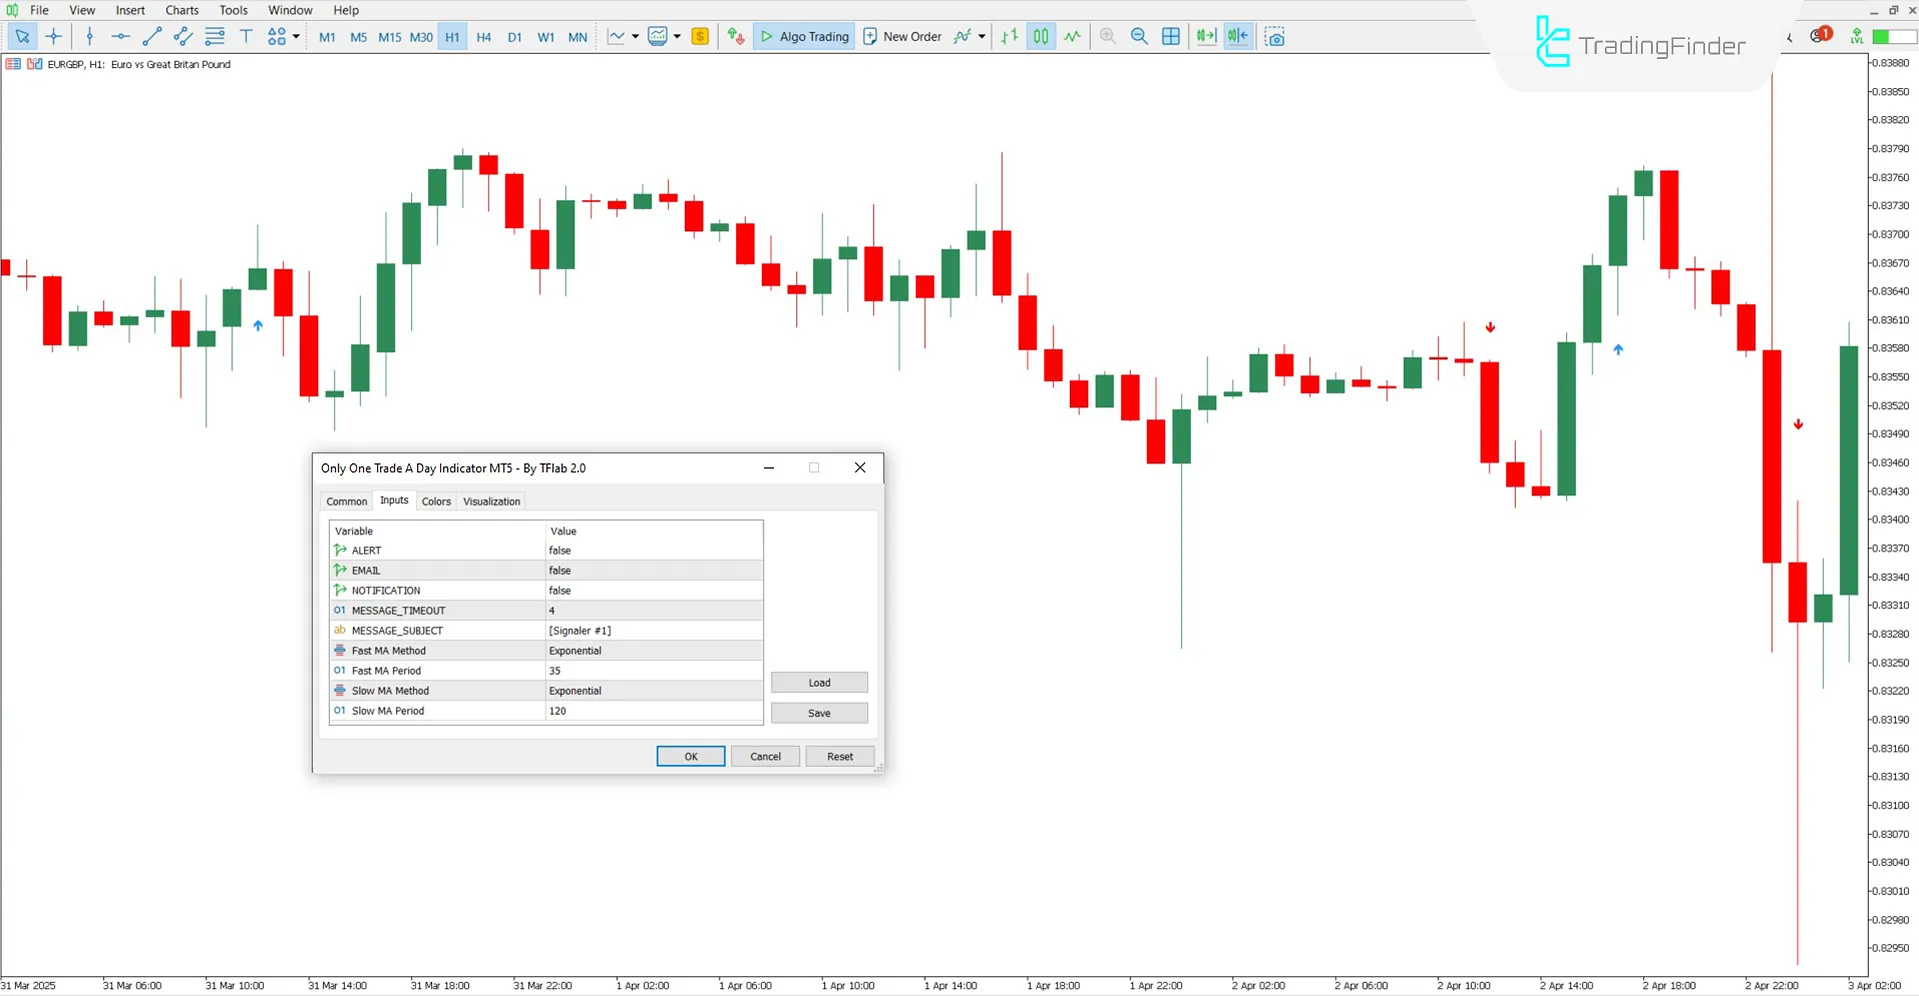
The settings of the Only One Trade a Day indicator are shown below:

- ALERT: Enable alert
- EMAIL: Enable email alerts
- NOTIFICATION: Enable push notifications
- MESSAGE_TIMEOUT: Time interval between alerts in seconds
- MESSAGE_SUBJECT: Subject line of the alert message
- Fast MA Method: Type of fast moving average
- Fast MA Period: Period of the fast moving average
- Slow MA Method: Type of slow moving average
- Slow MA Period: Period of the slow moving average
Conclusion
The Only One Trade a Day strategy indicator is designed based on the crossover of the fast and slow moving averages, and accordingly, provides reliable trading signals. The periods of these averages can be customized in the settings panel.
Moreover, due to its simple, lightweight, and flexible structure, this indicator can be easily integrated into most trading systems and trading strategies.
Only One Trade A Day MT5 PDF
Only One Trade A Day MT5 PDF
Click to download Only One Trade A Day MT5 PDFIs the One Trade a Day indicator limited to the Forex market?
No, this indicator is compatible not only with the Forex market but also with cryptocurrencies, stocks, and commodities.
Can this indicator be used in all markets without limitations?
Yes, this indicator is fully functional across all markets with no restrictions.
How does the Only One Trade a Day indicator generate its signals?
This tool generates signals based on the fast and slow moving averages and their crossovers, using blue arrows to indicate buy signals and red arrows to indicate sell signals.


