![Schaff Trend Cycle Indicator for MetaTrader 5 Download - Free - [Trading Finder]](https://cdn.tradingfinder.com/image/106778/10-15-en-shaff-trend-cycle-mt5.webp)
![Schaff Trend Cycle Indicator for MetaTrader 5 Download - Free - [Trading Finder] 0](https://cdn.tradingfinder.com/image/106778/10-15-en-shaff-trend-cycle-mt5.webp)
![Schaff Trend Cycle Indicator for MetaTrader 5 Download - Free - [Trading Finder] 1](https://cdn.tradingfinder.com/image/101676/10-15-en-schaff-trend-cycle-mt5-03.webp)
![Schaff Trend Cycle Indicator for MetaTrader 5 Download - Free - [Trading Finder] 2](https://cdn.tradingfinder.com/image/101687/10-15-en-schaff-trend-cycle-mt5-02.webp)
![Schaff Trend Cycle Indicator for MetaTrader 5 Download - Free - [Trading Finder] 3](https://cdn.tradingfinder.com/image/101688/10-15-en-schaff-trend-cycle-mt5-04.webp)
Schaff Trend Cycle Indicator is an oscillator in MetaTrader 5 that examines overbought and oversold points on the price chart. This indicator combines the MACD (Moving Average Convergence Divergence) and Stochastic Oscillator.
This tool identifies values below 25 as oversold areas and above 75 as overbought areas, displaying fluctuations between these ranges with a purple curve. Traders can use this oscillator alongside other tools and strategies to find optimal trade entry points.
Indicator Table
|
Indicator Categories:
|
Oscillators MT5 Indicators
Signal & Forecast MT5 Indicators
|
|
Platforms:
|
MetaTrader 5 Indicators
|
|
Trading Skills:
|
Elementary
|
|
Indicator Types:
|
Overbought & Oversold MT5 Indicators
Reversal MT5 Indicators
|
|
Timeframe:
|
Multi-Timeframe MT5 Indicators
|
|
Trading Style:
|
Swing Trading MT5 Indicators
Scalper MT5 Indicators
Day Trading MT5 Indicators
|
|
Trading Instruments:
|
Forex MT5 Indicators
Crypto MT5 Indicators
Stock MT5 Indicators
Commodity MT5 Indicators
Indices MT5 Indicators
Forward MT5 Indicators
Share Stock MT5 Indicators
|
Indicator at a Glance
The Schaff Trend Cycle Indicator is an advanced oscillator designed based on two popular indicators, MACD and Stochastic, performing its calculations using these tools.
Traders can quickly identify the market trend with this indicator. Additionally, the MetaTrader5 indicator provides key signals when the price reaches overbought or oversold zones.
The oversold zone is at the 25 level, and the overbought zone is at the 75 level, alerting traders to potential market trend reversals.

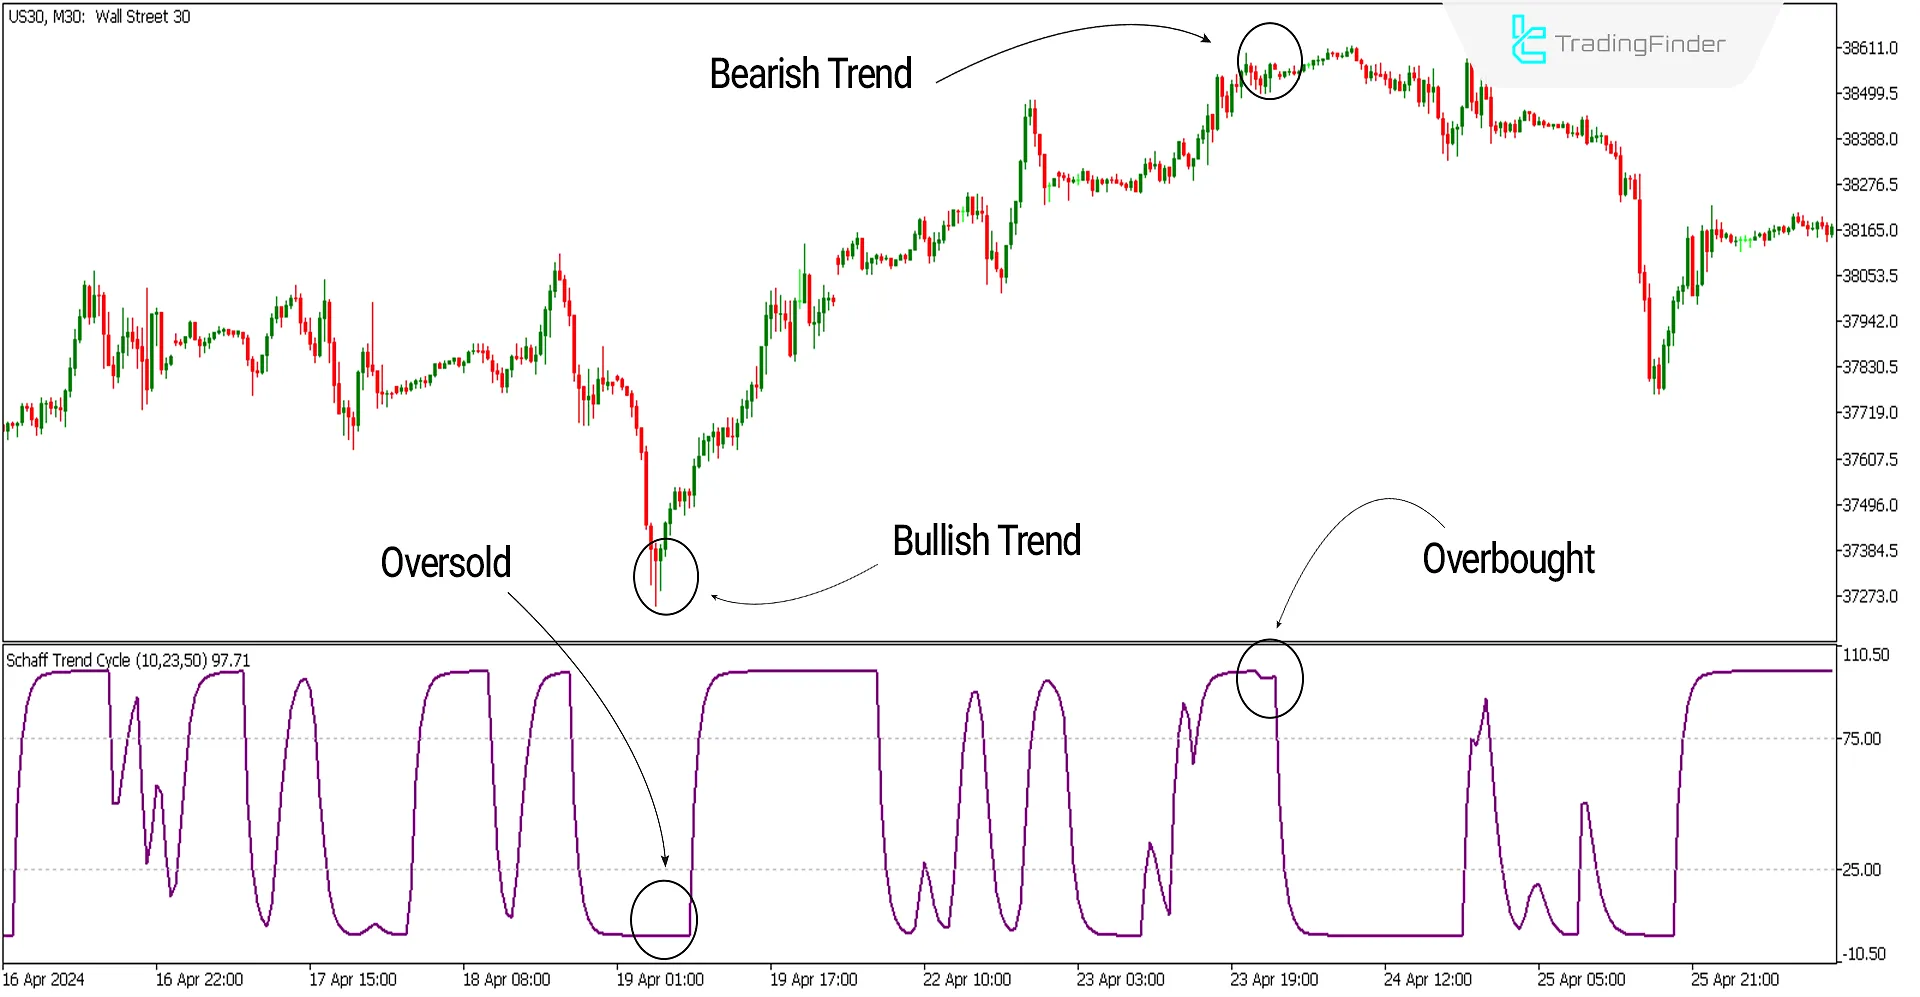
In the image below, the chart of the Dow Jones index with the symbol [US30] is shown in the 30-minute timeframe. On April 19th, the indicator reached the oversold zone, and when the oscillator curve crossed above the 25 level, a Bullish signal and buy positions were issued.
Also, on April 23rd, the price reached the overbought zone, and the oscillator curve crossed below the 75 level, at which point a Bearish signal and sell positions were issued.
Bullish Signal Conditions of the Indicator (Bullish Setup)
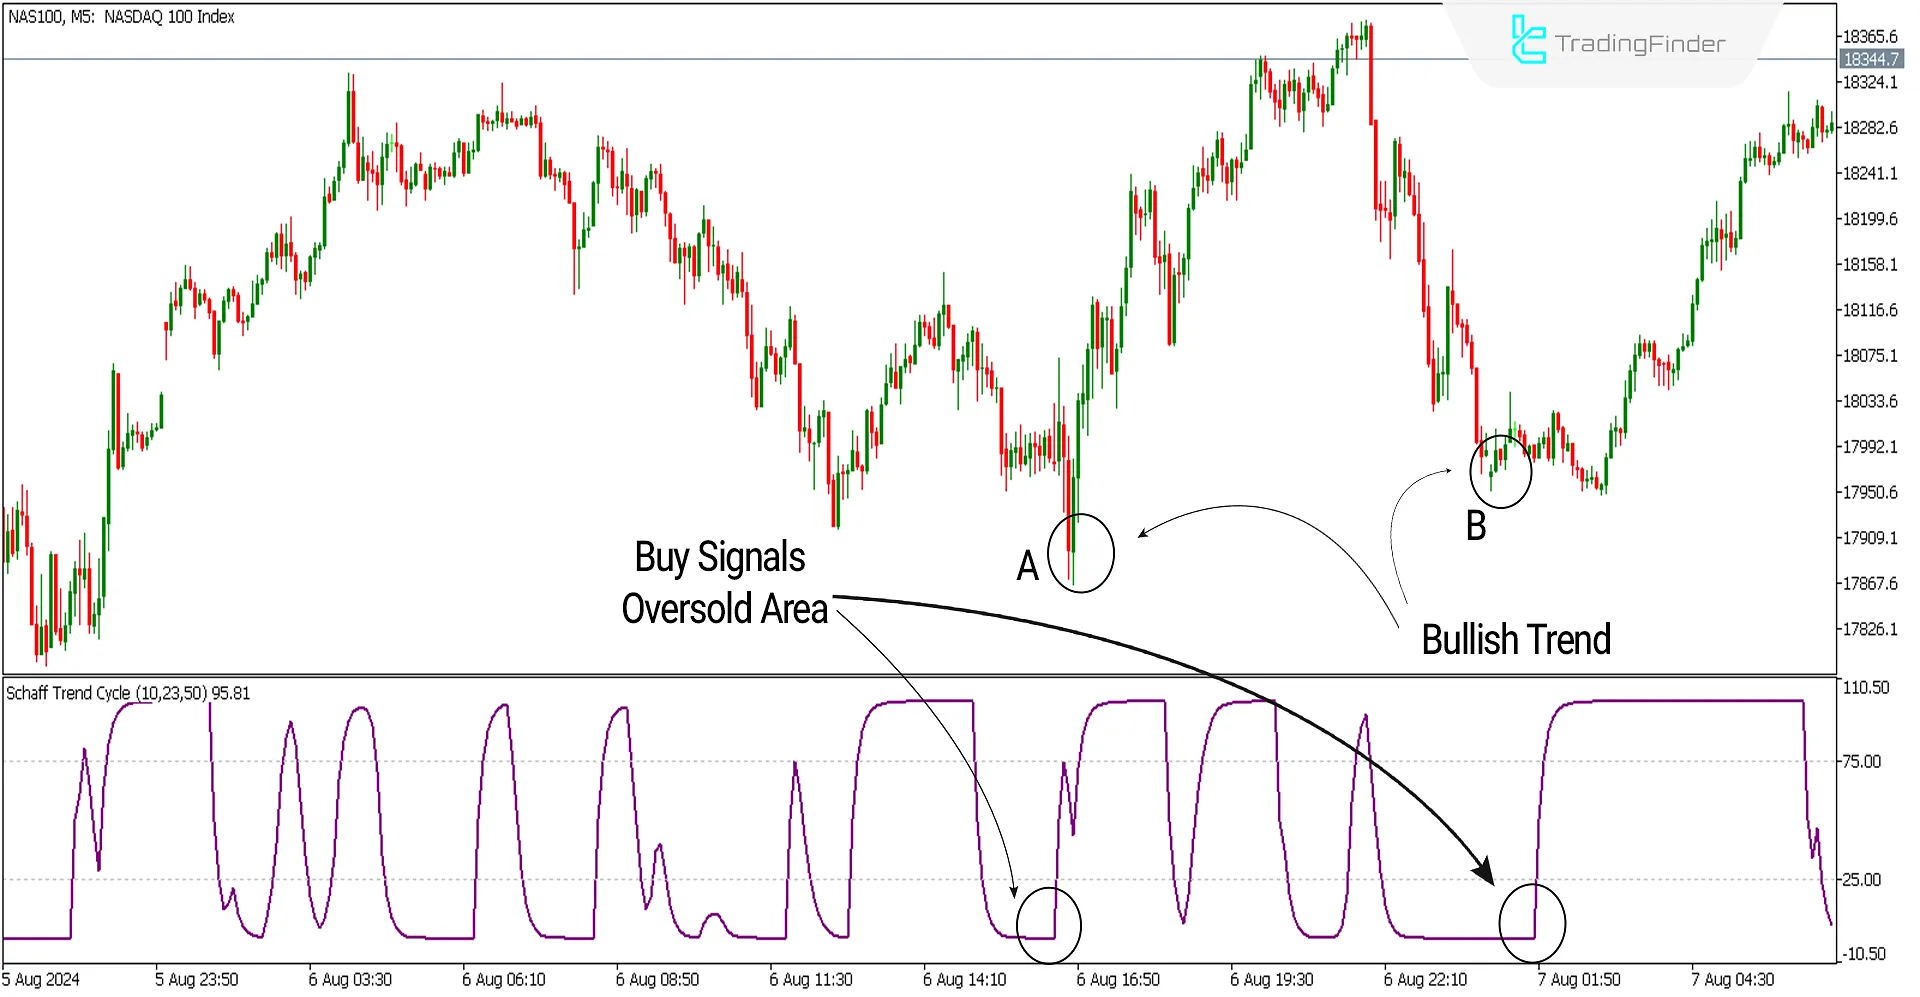
The image below shows the NASDAQ index chart with the symbol (NAS100) in the 5-minute timeframe. At points A and B, the indicator reaches the oversold zone and cuts the 25 line upward, issuing an Uptrend signal. In this situation, one can look for buying opportunities with the help of a bullish candlestick pattern or other technical analysis tools.

Bearish Signal Conditions of the Indicator (Bearish Setup)
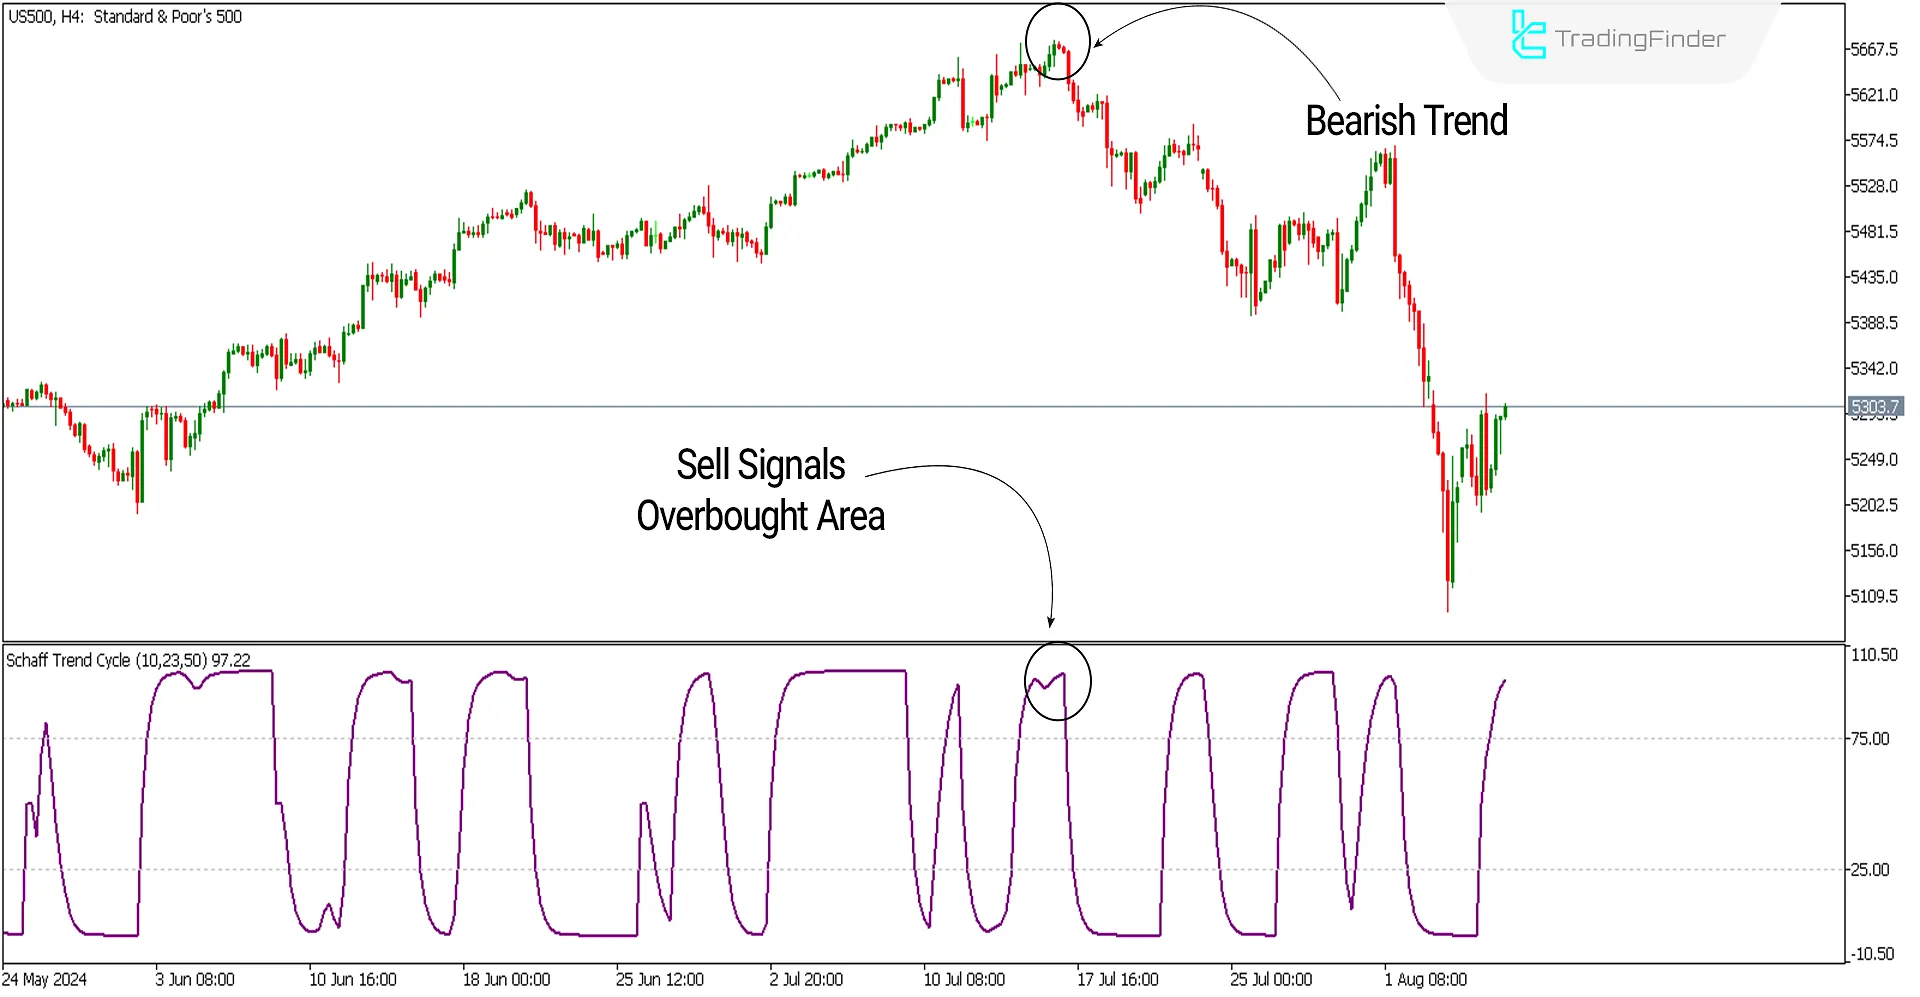
The image below shows the S&P 500 index chart with the symbol (US500) in the 4-hour timeframe. The indicator reaches the overbought zone in the indicated area and cuts the 75 line downward, issuing a Bearish signal. With the help of a bearish candlestick pattern or other technical analysis tools, one can look for selling opportunities.

Schaff Trend Cycle Indicator Settings

- Schaff period: The indicator period is set to 10;
- Fast EMA period: The fast-moving average period is 23;
- Slow EMA period: The slow-moving average period is 50.
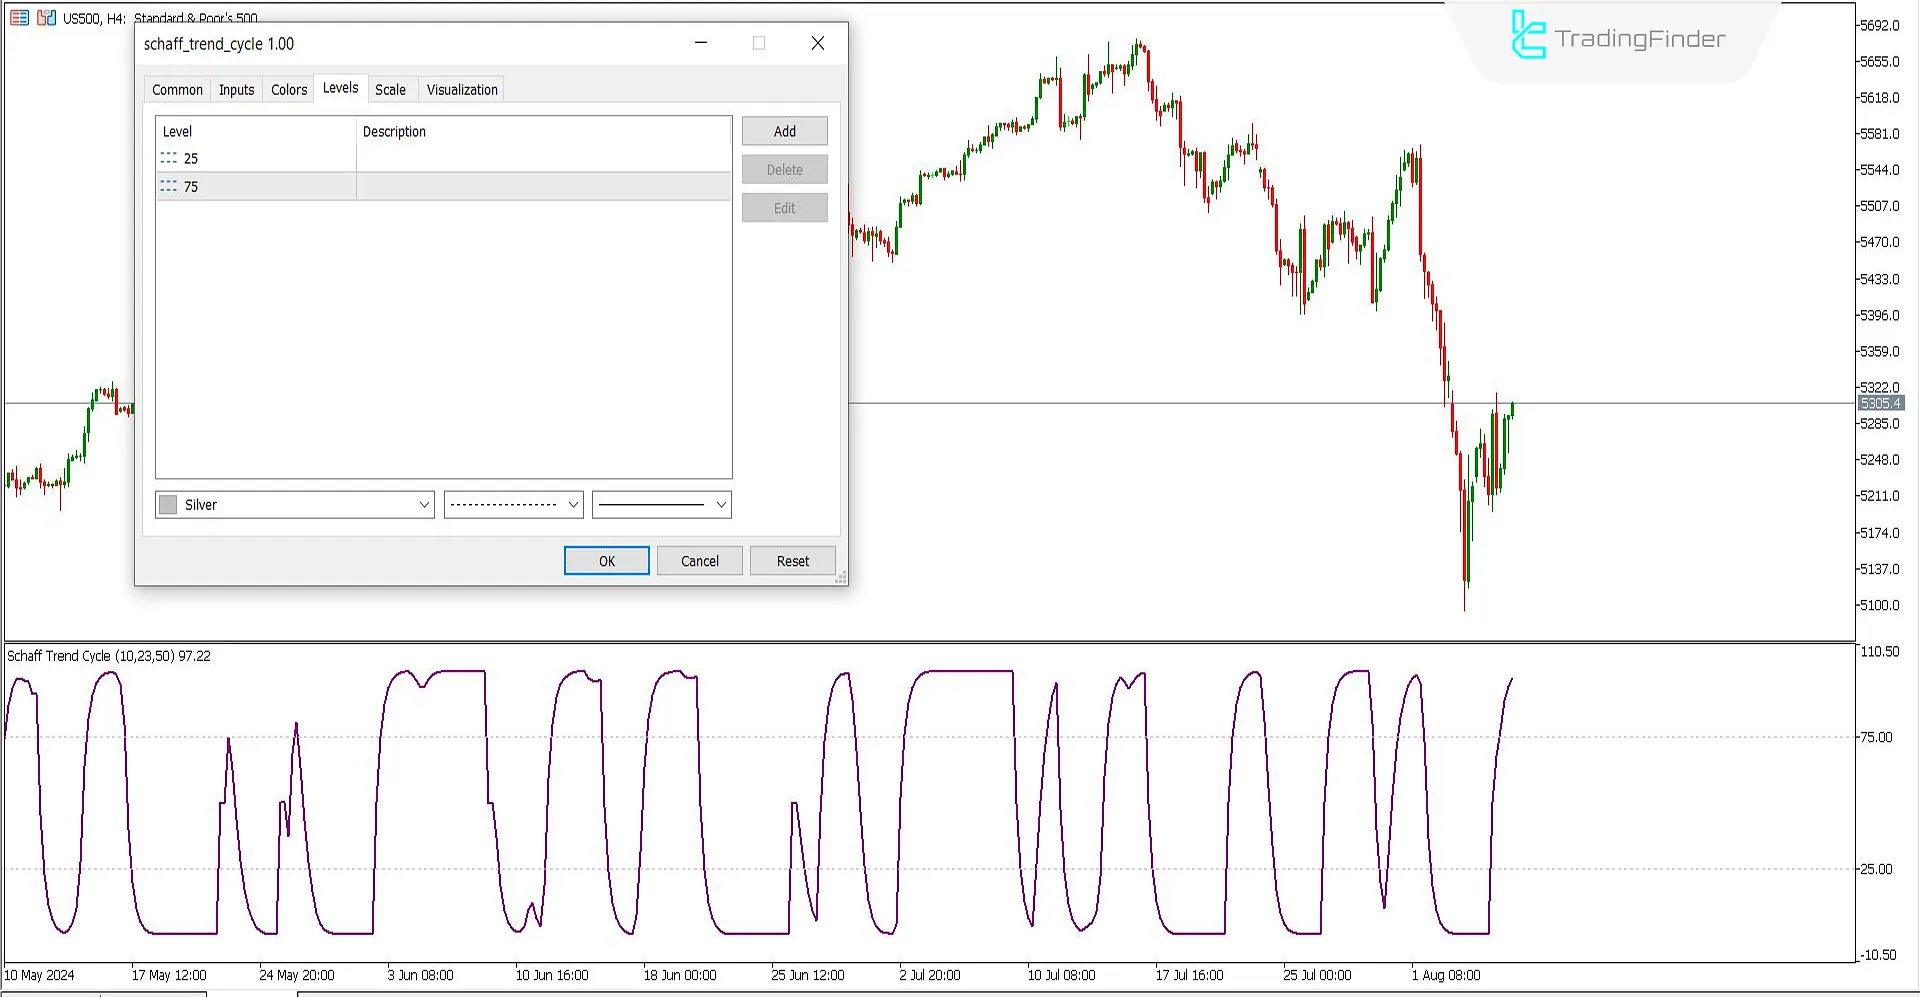
Explanation: To create the 25 and 75 lines on the indicator, as shown in the image below, you can add the desired levels in the (Levels) section.
Conclusion
Using overbought and oversold oscillators alone may carry high risks for trades. The Schaff Trend Cycle (STC) indicator, by combining two other oscillators, can filter out minor fluctuations and false signals. However, it is suggested to use it alongside other analytical methods such as classic analysis, Price Action, etc.
What is the Schaff Trend Cycle (STC) Indicator?
The Schaff Trend Cycle is an oscillator for identifying overbought and oversold areas that combines MACD and Stochastic.
Is the (STC) indicator usable on its own?
Yes, but for better use of this indicator, it can be combined with other analytical styles like Price Action.