![TMA Centered Bands Indicator for MetaTrader 5 Download - Free - [TFLab]](https://cdn.tradingfinder.com/image/106084/10-5-en-tma-centered-bands-mt5.webp)
![TMA Centered Bands Indicator for MetaTrader 5 Download - Free - [TFLab] 0](https://cdn.tradingfinder.com/image/106084/10-5-en-tma-centered-bands-mt5.webp)
![TMA Centered Bands Indicator for MetaTrader 5 Download - Free - [TFLab] 1](https://cdn.tradingfinder.com/image/29365/10-05-en-tma-centered-bands-mt5-02.avif)
![TMA Centered Bands Indicator for MetaTrader 5 Download - Free - [TFLab] 2](https://cdn.tradingfinder.com/image/29367/10-05-en-tma-centered-bands-mt5-03.avif)
![TMA Centered Bands Indicator for MetaTrader 5 Download - Free - [TFLab] 3](https://cdn.tradingfinder.com/image/29372/10-05-en-tma-centered-bands-mt5-04.avif)
The TMA Centered Bands indicator, a feature of MetaTrader 5 Indicator, uses a Moving Average (MA) visualized through three bands on the chart to determine prevailing market trends. In bullish trends, the middle band is colored blue, and in bearish trends, it turns red.
When the price exits the upper bands, there's a potential for a price reversal back into the band, indicating asell signal.
Similarly, abreakout below the lower band typically signals a buying opportunity. This setup provides traders with visual cues for potential entry and exit points based on trend changes and band interactions.
Indicator Table
|
Indicator Categories:
|
Signal & Forecast MT5 Indicators
Bands & Channels MT5 Indicators
Levels MT5 Indicators
|
|
Platforms:
|
MetaTrader 5 Indicators
|
|
Trading Skills:
|
Elementary
|
|
Indicator Types:
|
Breakout MT5 Indicators
Reversal MT5 Indicators
|
|
Timeframe:
|
Multi-Timeframe MT5 Indicators
|
|
Trading Style:
|
Swing Trading MT5 Indicators
Intraday MT5 Indicators
Scalper MT5 Indicators
Day Trading MT5 Indicators
|
|
Trading Instruments:
|
Forex MT5 Indicators
Crypto MT5 Indicators
Stock MT5 Indicators
Commodity MT5 Indicators
Indices MT5 Indicators
Share Stock MT5 Indicators
|
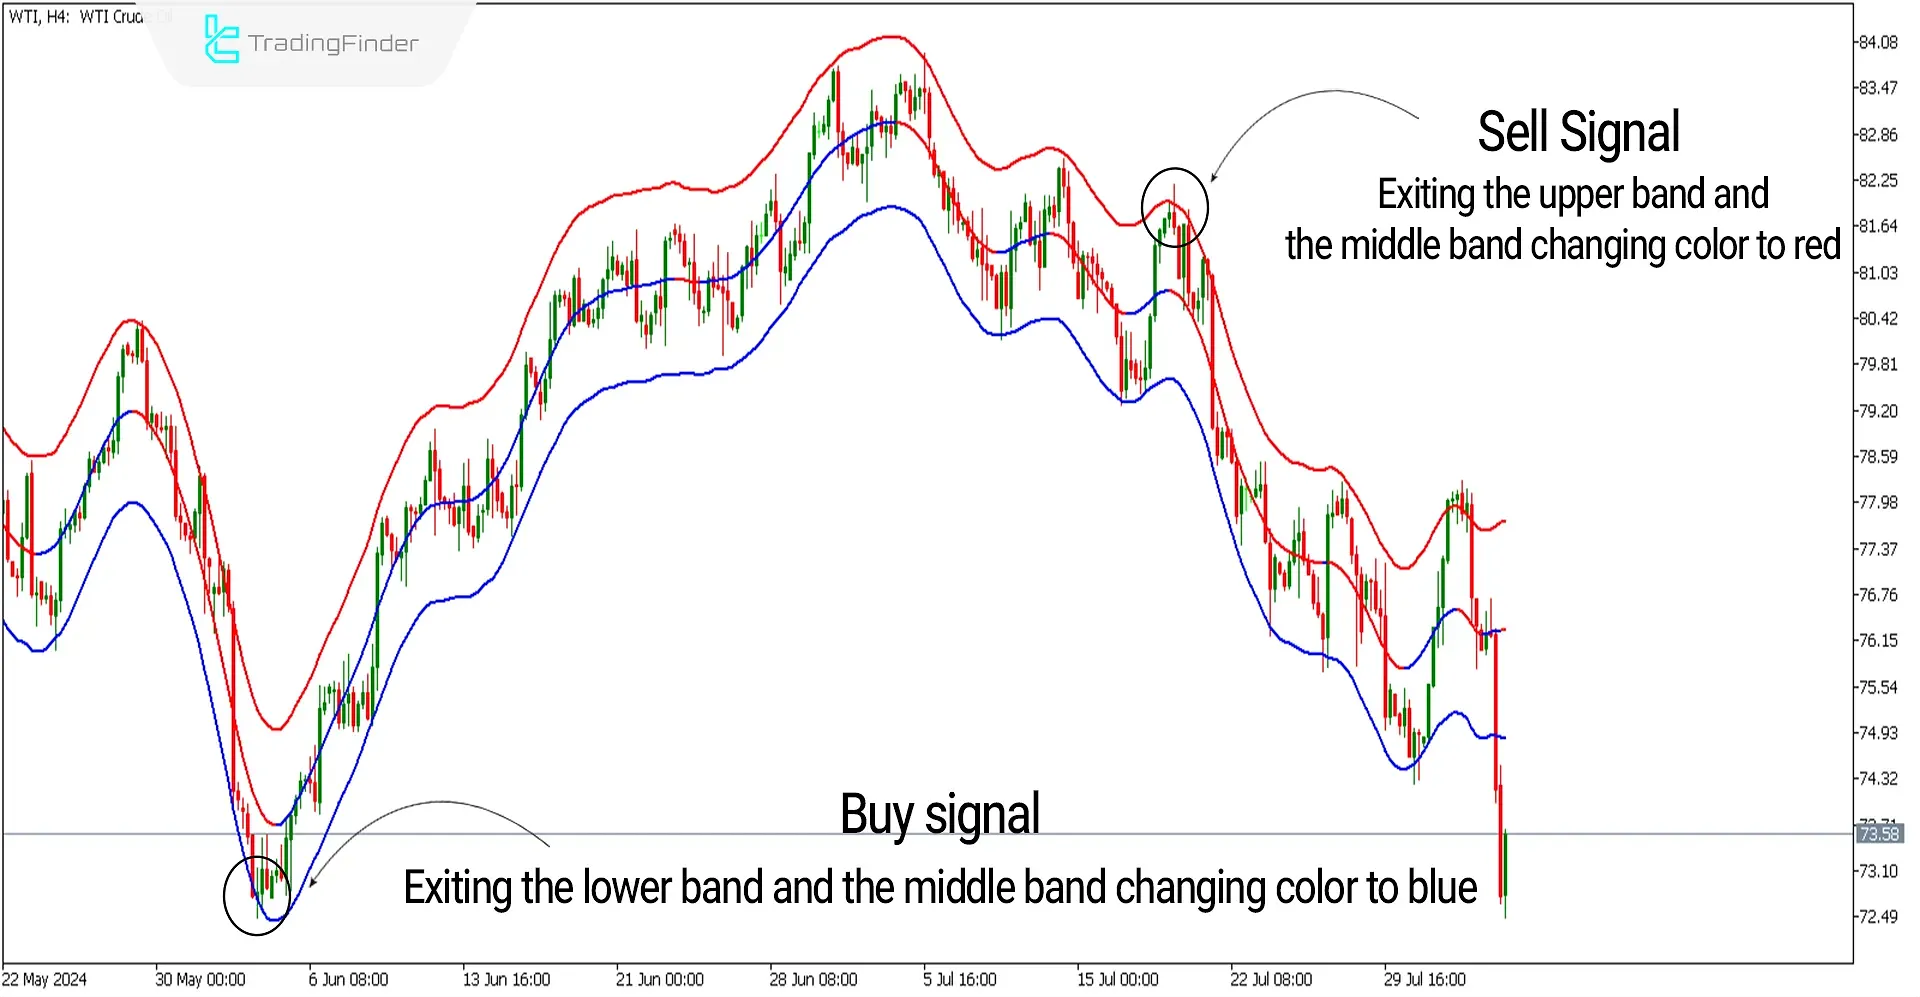
TheTexas oil price chart with the symbol [WTI] on a 4-hour timeframe is shown in the image below.
At the $73 price level, abreakout from the lower band, followed by a return inside the band and the middle band turning blue, indicates a trend reversal to an uptrend, prompting a buy signal.
Additionally, at the $82 price level, the pricebreaks the upper band of the indicator, and the middle band turns red, signaling a downtrend and a sell opportunity.
These movements provide critical indicators for traders to adjust their strategies according to these trend shifts and band interactions.

Overview
In all styles and methods of analytical trading, accurately identifying the direction of the trend is crucial.
TheTMA (Triangular Moving Average) indicator, by leveraging Moving Averages (MA), delineates a range that can indicate the prevailing and future direction of the trend.
This range strongly resembles theBollinger Bands indicator, where its bands can act as support and resistance levels against price movements.
Uptrend Signals (Buy Positions)
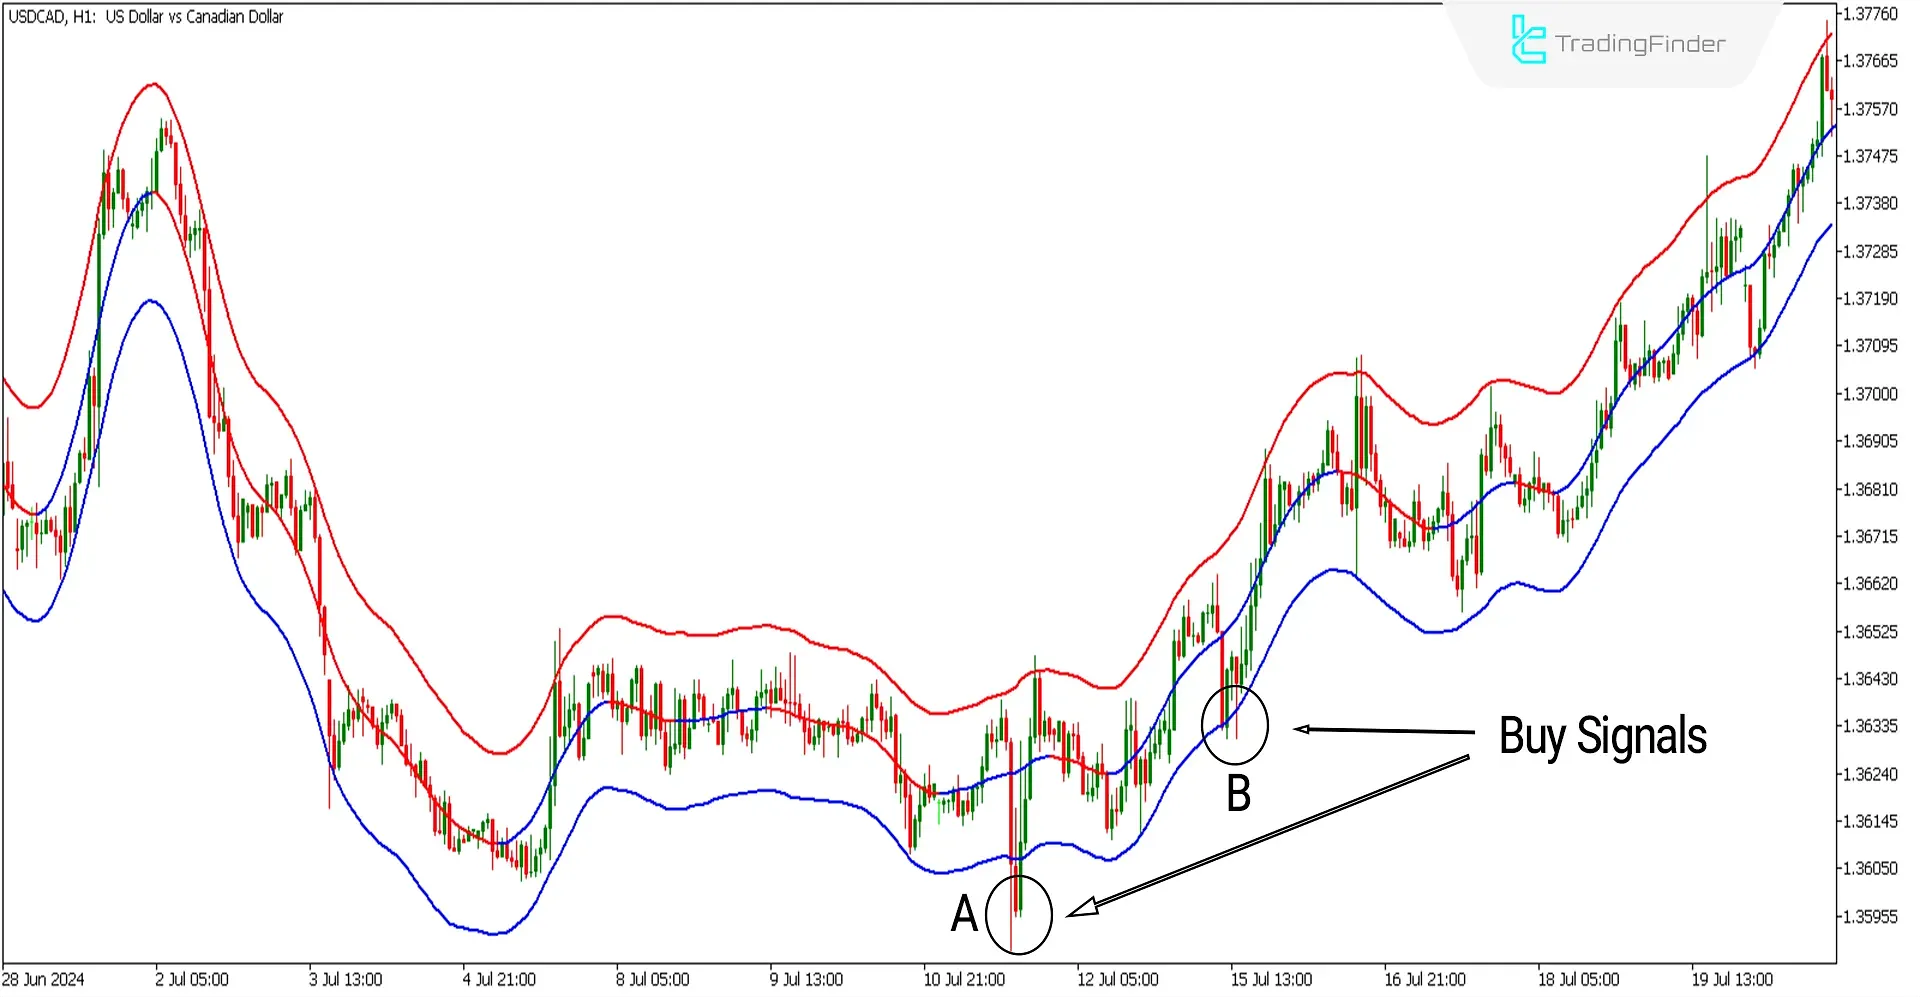
In the image below, the chart for the currency pair US Dollar to Canadian Dollar with the symbol (USDCAD) is displayed in a 1-hour timeframe.
At pointsA and B, the price has broken below the lower band and then reversed back inside the band, with the middle band of the indicator turning blue.
Under these conditions, abullish trend signal has been issued by the indicator, and one might consider looking for buy trades, especially with additional confirmations such as candlestick patterns.

Downtrend Signals (Sell Positions)
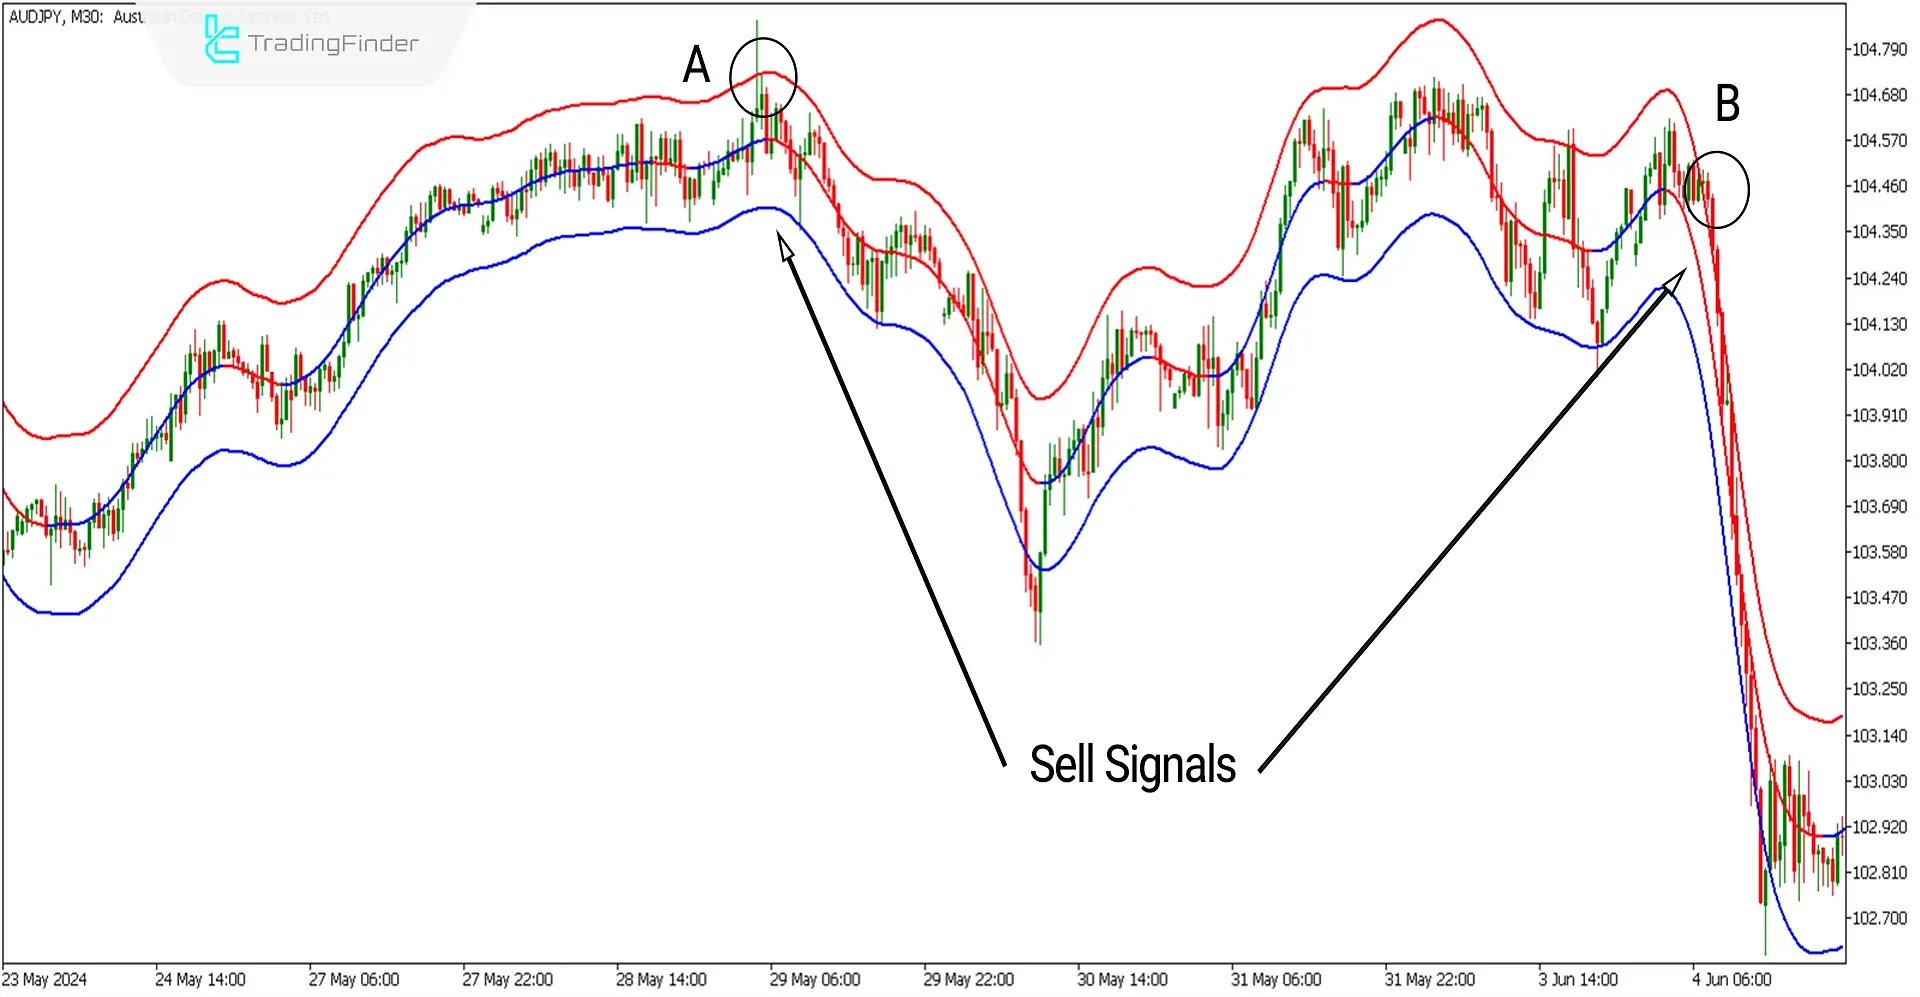
In the image below, the chart of the Australian Dollar to Japanese Yen currency pairing with the symbol (AUDJPY) is displayed in a 30-minute timeframe.
At pointsA and B, the price has broken above the upper band and then reversed back into the band, with the middle band of the indicator turning red.
In thesecircumstances, the indicator has issued a bearish trend signal. Consider looking for sell trades, especially with additional confirmations such as reversal patterns in shorter time frames.

Settings of the TMA Indicator

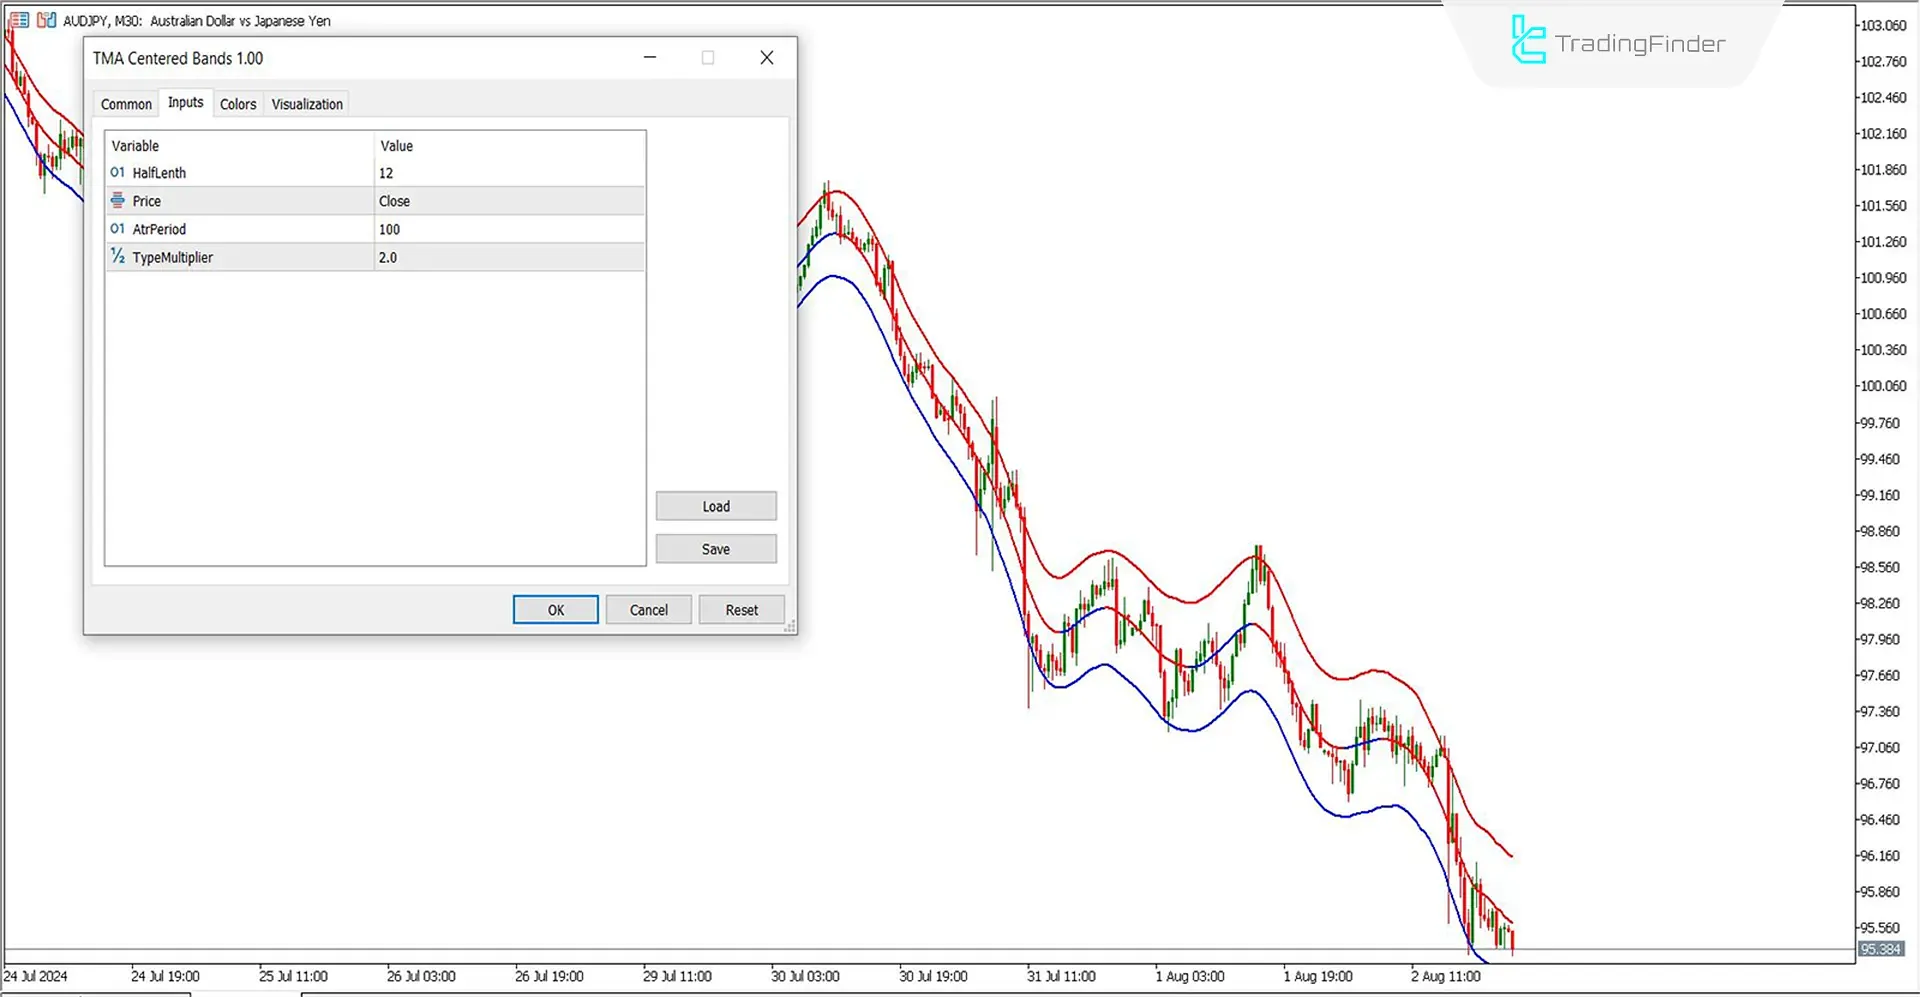
- HalfLength: The indicator considers 12 candles for averaging. This setting determines how sensitive it is to recent price changes.
- Price: This setting uses the closing price ('Close'), which indicates that the indicator should use the closing price of each candle to calculate the moving average.
- AtrPeriod: The period for the Average True Range (ATR) indicator is set to 100. This extended period can help smooth out the ATR calculation, making it less sensitive to minor price fluctuations and providing a better indication of market volatility over a broader time frame.
- TypeMultiplier: The bandwidth multiplier is set to 2. This multiplier affects the distance between the center and outer bands, determining how wide the bands are relative to the average true range. A higher multiplier makes the bands wider, potentially capturing more price action between them.
Conclusion
The TMA-centered bands indicator can be used in all trading strategies, especially for traders whose analytical style is based on market trends. The bands of this MT5 Bands and Channels indicator effectively indicate the direction of the trend.
Therefore, traders can use it to identifythe trend direction and look for confirmations in lower timeframes before entering trades.
This approach helps align trades with the broader market movement, potentially increasing the success rate of theimplemented strategies.
Can the TMA indicator alone provide valid buy and sell signals?
Yes, this indicator can generate trading signals. However, to enhance the accuracy of the signals, it is recommended to use other indicators, such as the RSI, for better trend detection.
Are the TMA Centered Bands applicable in range-bound markets?
No, this indicator is more effective in volatile markets where it can provide clear trading signals. In range-bound markets, it may not provide reliable entry signals as price movements are limited and less likely to generate distinct trends detected by this type of indicator.