![Xmaster (XHMaster) Formula Indicator for MT5 - [TradingFinder]](https://cdn.tradingfinder.com/image/190753/2-2-en-xmaster-formula-mt5-1.webp)
![Xmaster (XHMaster) Formula Indicator for MT5 - [TradingFinder] 0](https://cdn.tradingfinder.com/image/190753/2-2-en-xmaster-formula-mt5-1.webp)
![Xmaster (XHMaster) Formula Indicator for MT5 - [TradingFinder] 1](https://cdn.tradingfinder.com/image/190740/2-2-en-xmaster-formula-mt5-2.webp)
![Xmaster (XHMaster) Formula Indicator for MT5 - [TradingFinder] 2](https://cdn.tradingfinder.com/image/190752/2-2-en-xmaster-formula-mt5-3.webp)
![Xmaster (XHMaster) Formula Indicator for MT5 - [TradingFinder] 3](https://cdn.tradingfinder.com/image/190751/2-2-en-xmaster-formula-mt5-4.webp)
TheXmaster Formula Indicator combines Moving Average (MA) and MACD to identify trend strength and direction. Xmaster Formula Metatrader 5 Indicator provides Entry Signals for traders using green and red arrows.
A member of the TradingFinder development team said:
"Some users mistakenly search for XHmaster instead of Xmaster [which is designed for market trend identification]. This mistake has caused some individuals to become confused about its functionality and accessibility. The correct name of this tool is Xmaster."
Xmaster Formula Specifications Table
The specifications of the Xmaster Formula Indicator can be seen in the table below:
Indicator Categories: | Oscillators MT5 Indicators Volatility MT5 Indicators Bands & Channels MT5 Indicators |
Platforms: | MetaTrader 5 Indicators |
Trading Skills: | Elementary |
Indicator Types: | Reversal MT5 Indicators |
Timeframe: | Multi-Timeframe MT5 Indicators |
Trading Style: | Intraday MT5 Indicators |
Trading Instruments: | Forex MT5 Indicators Crypto MT5 Indicators Stock MT5 Indicators Commodity MT5 Indicators Indices MT5 Indicators Forward MT5 Indicators Share Stock MT5 Indicators |
Xmaster Formula Code
Here is a part of Xmaster (XHMaster) formula code for MT5:
The provided code is intended for educational purposes to demonstrate concepts and logic, and is not a final or ready-to-use version.
//+------------------------------------------------------------------+
//| XMaster Formula |
//| Copyright © tradingfinder.com 2023 -2025 |
//+------------------------------------------------------------------+
#property indicator_separate_window
#property indicator_buffers 6
#property indicator_plots 4
#property indicator_color1 clrLime
#property indicator_color2 clrRed
#property indicator_color3 clrYellow
#property indicator_color4 clrYellow

#include <MovingAverages.mqh>

// === Inputs ===
input bool alert_on     = true;
input bool alert_sound  = false;
input bool alert_email  = false;

// === Buffers ===
double tmp[], line[], green_line[], red_line[], up_arrow[], down_arrow[];

// === Global Vars ===
int period1 = 40;
int period2, period3, ma1_handle, ma2_handle, digs;
ENUM_MA_METHOD ma_method = MODE_SMMA;
ENUM_APPLIED_PRICE applied_price = PRICE_LOW;
datetime last_alert = 0;
int stoploss_points = 200;

//+------------------------------------------------------------------+
//| Initialization                                                   |
//+------------------------------------------------------------------+
int OnInit() {
   IndicatorSetString(INDICATOR_SHORTNAME, "Xmaster Formula");
   SetIndexBuffer(0, green_line, INDICATOR_DATA); PlotIndexSetInteger(0, PLOT_DRAW_TYPE, DRAW_ARROW); PlotIndexSetInteger(0, PLOT_ARROW, 108);
   SetIndexBuffer(1, red_line, INDICATOR_DATA);   PlotIndexSetInteger(1, PLOT_DRAW_TYPE, DRAW_ARROW); PlotIndexSetInteger(1, PLOT_ARROW, 108);
   SetIndexBuffer(2, up_arrow, INDICATOR_DATA);   PlotIndexSetInteger(2, PLOT_DRAW_TYPE, DRAW_ARROW); PlotIndexSetInteger(2, PLOT_ARROW, 225); PlotIndexSetInteger(2, PLOT_LINE_WIDTH, 5);
   SetIndexBuffer(3, down_arrow, INDICATOR_DATA); PlotIndexSetInteger(3, PLOT_DRAW_TYPE, DRAW_ARROW); PlotIndexSetInteger(3, PLOT_ARROW, 226); PlotIndexSetInteger(3, PLOT_LINE_WIDTH, 5);
   SetIndexBuffer(4, line, INDICATOR_CALCULATIONS);
   SetIndexBuffer(5, tmp, INDICATOR_CALCULATIONS);
   for(int i=0; i<6; i++) PlotIndexSetInteger(i, PLOT_DRAW_BEGIN, period1+1);

   period2 = MathFloor(period1 / 1.9);
   period3 = (int)MathFloor(MathSqrt(period1));
   digs = Digits();
   ma1_handle = iMA(_Symbol, _Period, period1, 0, ma_method, applied_price);
   ma2_handle = iMA(_Symbol, _Period, period2, 0, ma_method, applied_price);
   return INIT_SUCCEEDED;
}

//+------------------------------------------------------------------+
//| Main Calculation Loop                                            |
//+------------------------------------------------------------------+
int OnCalculate(const int rates_total, const int prev_calculated,
                const datetime time[], const double open[],
                const double high[], const double low[], const double close[],
                const long tick_volume[], const long volume[], const int spread[]) {

   int st = prev_calculated > 0 ? prev_calculated - 1 : 1;
   for(int i = st; i < rates_total; i++) {
      green_line[i] = red_line[i] = up_arrow[i] = down_arrow[i] = EMPTY_VALUE;
      double ma1[], ma2[];
      if(CopyBuffer(ma1_handle, 0, rates_total-1-i, 1, ma1) < 1 || CopyBuffer(ma2_handle, 0, rates_total-1-i, 1, ma2) < 1) continue;

      tmp[i] = 2 * ma2[0] - ma1[0]; // Custom MA logic
      line[i] = i > 50 ? SmoothedMA(i, period3, line[i-1], tmp) : tmp[i];

      if(line[i] > line[i-1]) green_line[i] = line[i];
      if(line[i] < line[i-1]) red_line[i] = line[i];

      // Signal Detection  Alert Logic
      if(green_line[i] != EMPTY_VALUE  green_line[i-1] == EMPTY_VALUE) {
         up_arrow[i] = line[i];
         if(iTime(_Symbol, _Period, 0) != last_alert) {
            last_alert = iTime(_Symbol, _Period, 0);
            double entry = SymbolInfoDouble(_Symbol, SYMBOL_ASK);
            string msg = "Xmaster BUY: " + _Symbol + " @ " + DoubleToString(entry, digs);
            if(alert_on) Alert(msg); if(alert_email) SendMail("Xmaster", msg); if(alert_sound) PlaySound("alert.wav");
         }
      }

      if(red_line[i] != EMPTY_VALUE  red_line[i-1] == EMPTY_VALUE) {
         down_arrow[i] = line[i];
         if(iTime(_Symbol, _Period, 0) != last_alert) {
            last_alert = iTime(_Symbol, _Period, 0);
            double entry = SymbolInfoDouble(_Symbol, SYMBOL_BID);
            string msg = "Xmaster SELL: " + _Symbol + " @ " + DoubleToString(entry, digs);
            if(alert_on) Alert(msg); if(alert_email) SendMail("Xmaster", msg); if(alert_sound) PlaySound("alert.wav");
         }
      }
   }
   return rates_total;
}Uptrend Conditions
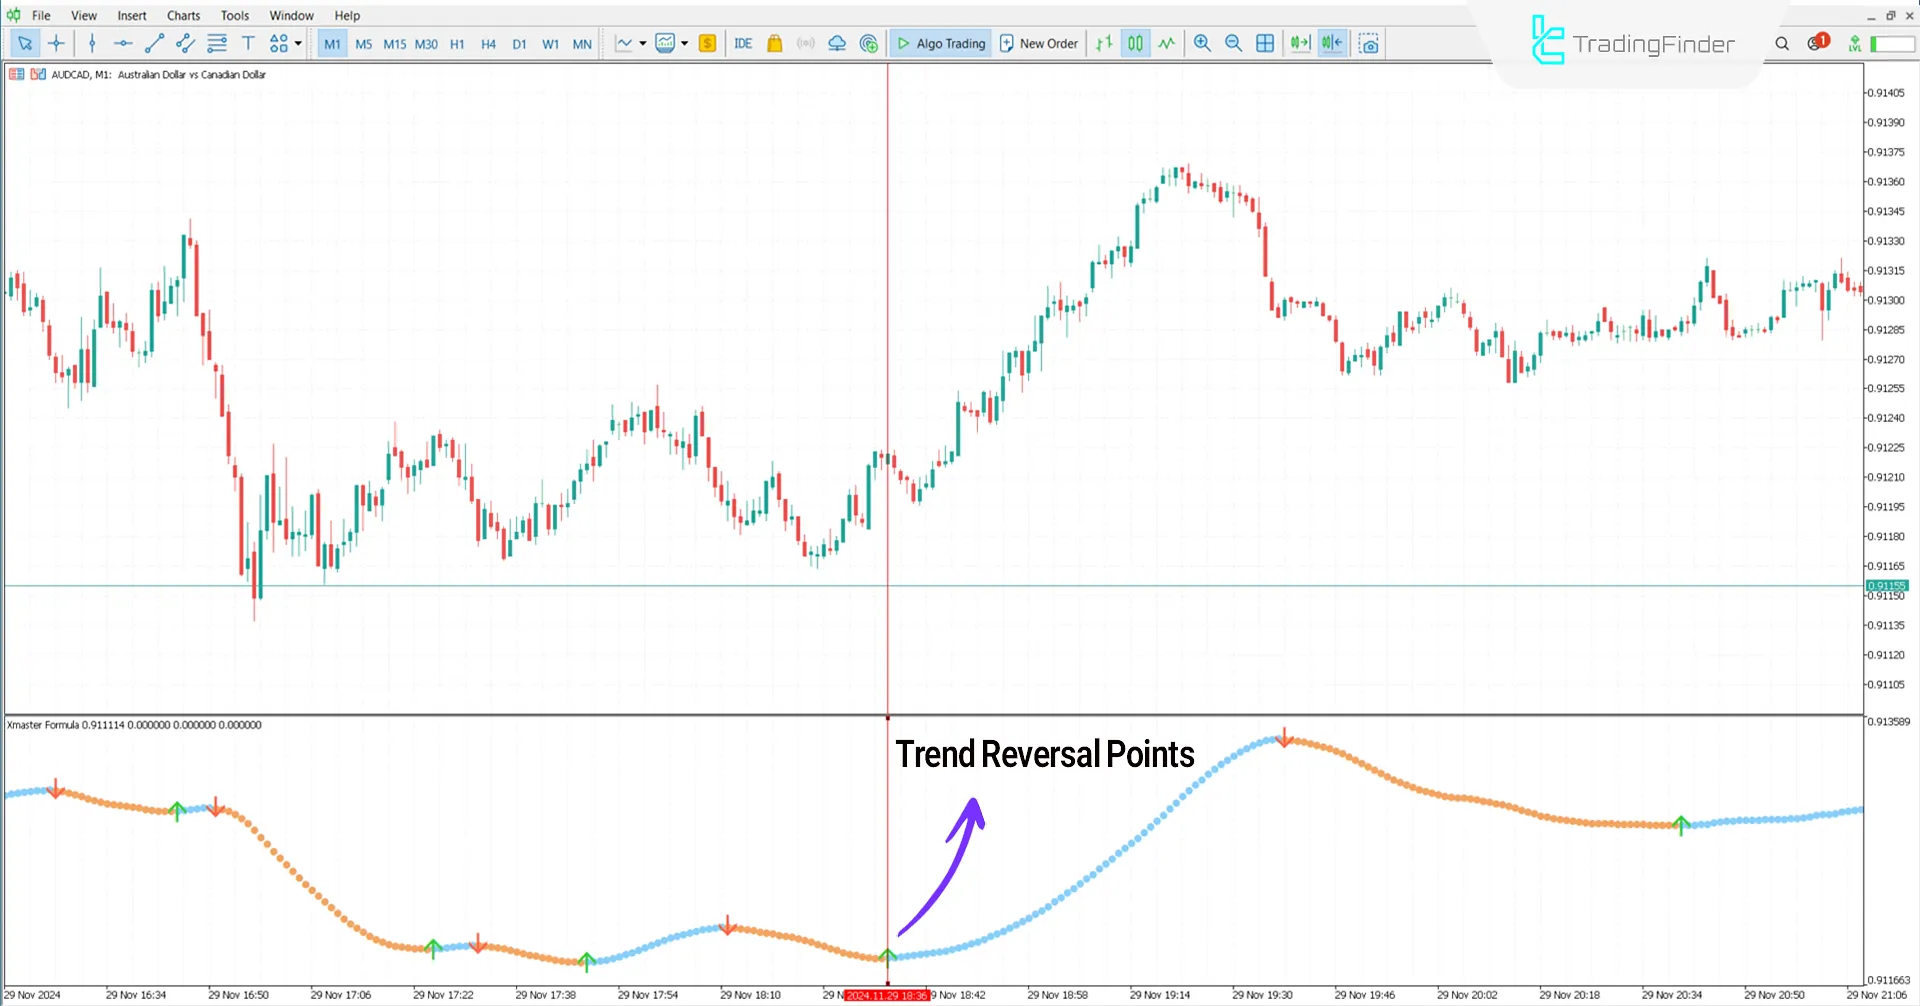
The price chart of AUD/USD on the 1-minute timeframe is shown below. Thegreen arrow signals a short-term trend reversal and indicates a bullish signal.
In this case, traders can use the green arrow as an Entry Signal to open a Buy position.

Downtrend Conditions
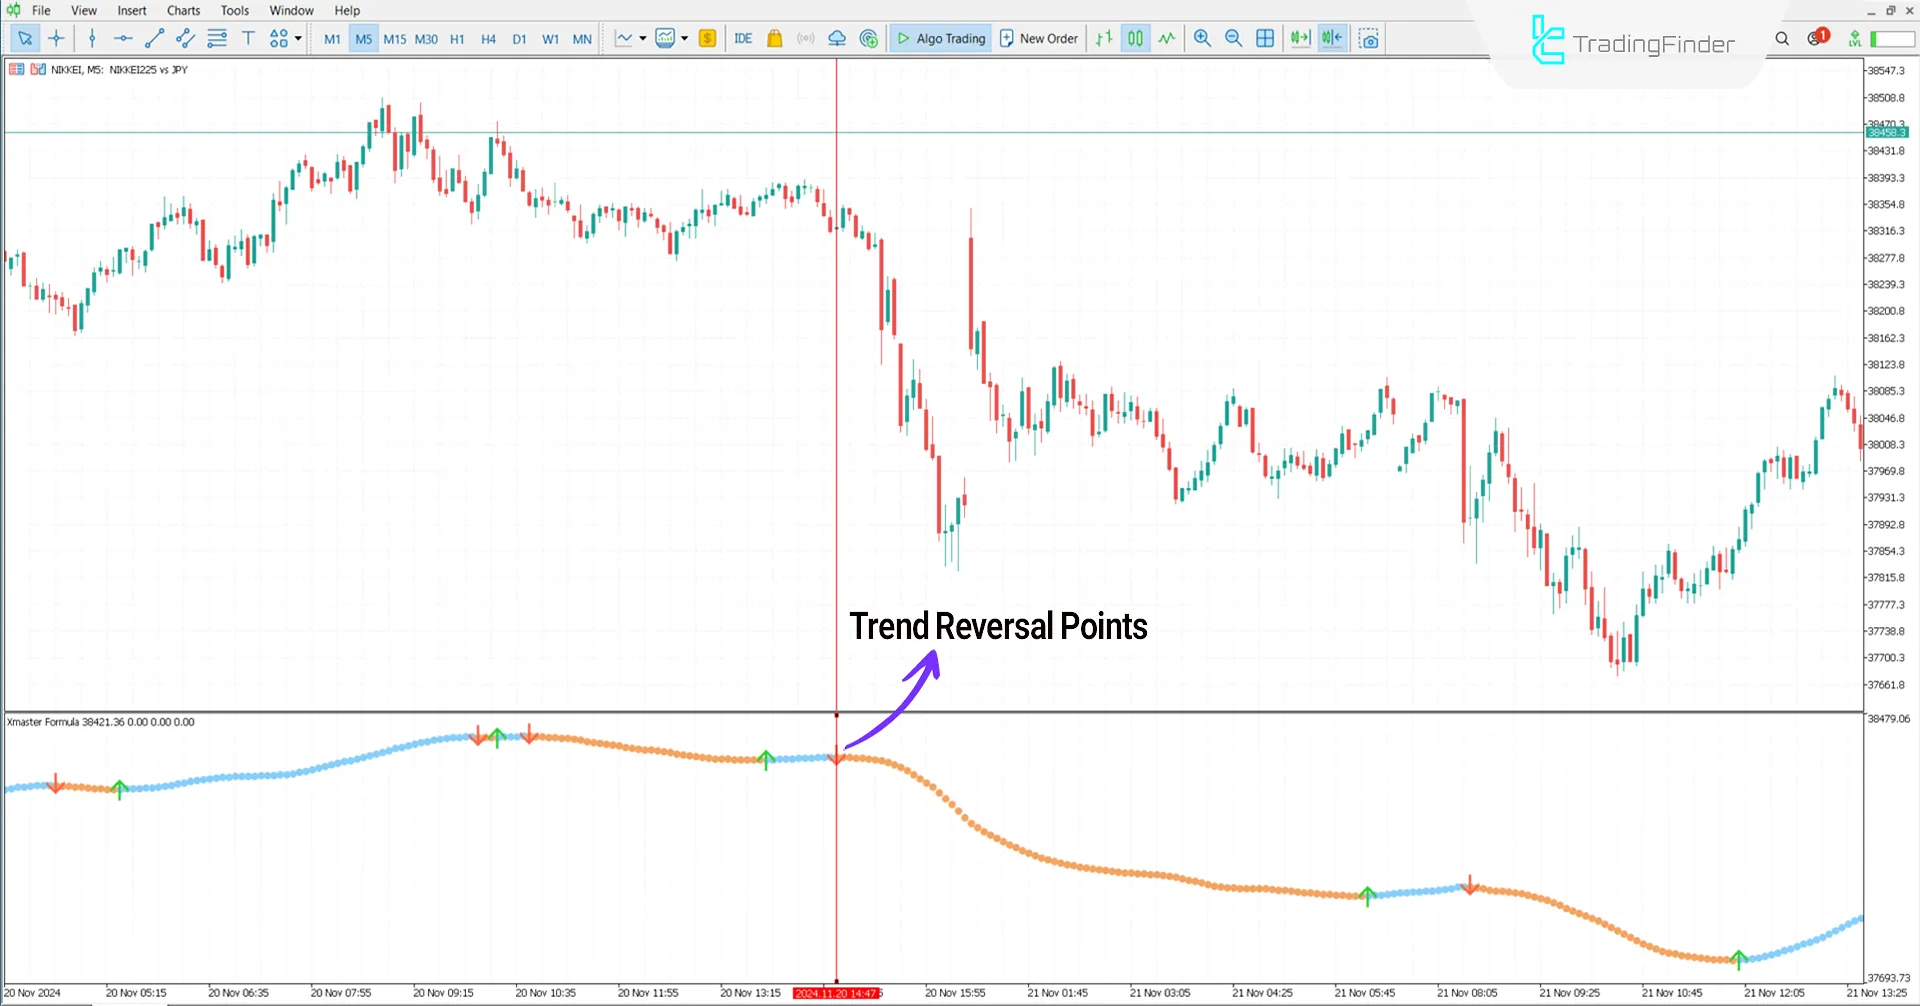
The price chart below shows the Nikkei 225 Index (NIKKEI) on the 5-minute timeframe.
The red arrow indicates a trend reversal and a bearish signal, allowing traders to enter a Sell position.

Indicator Settings
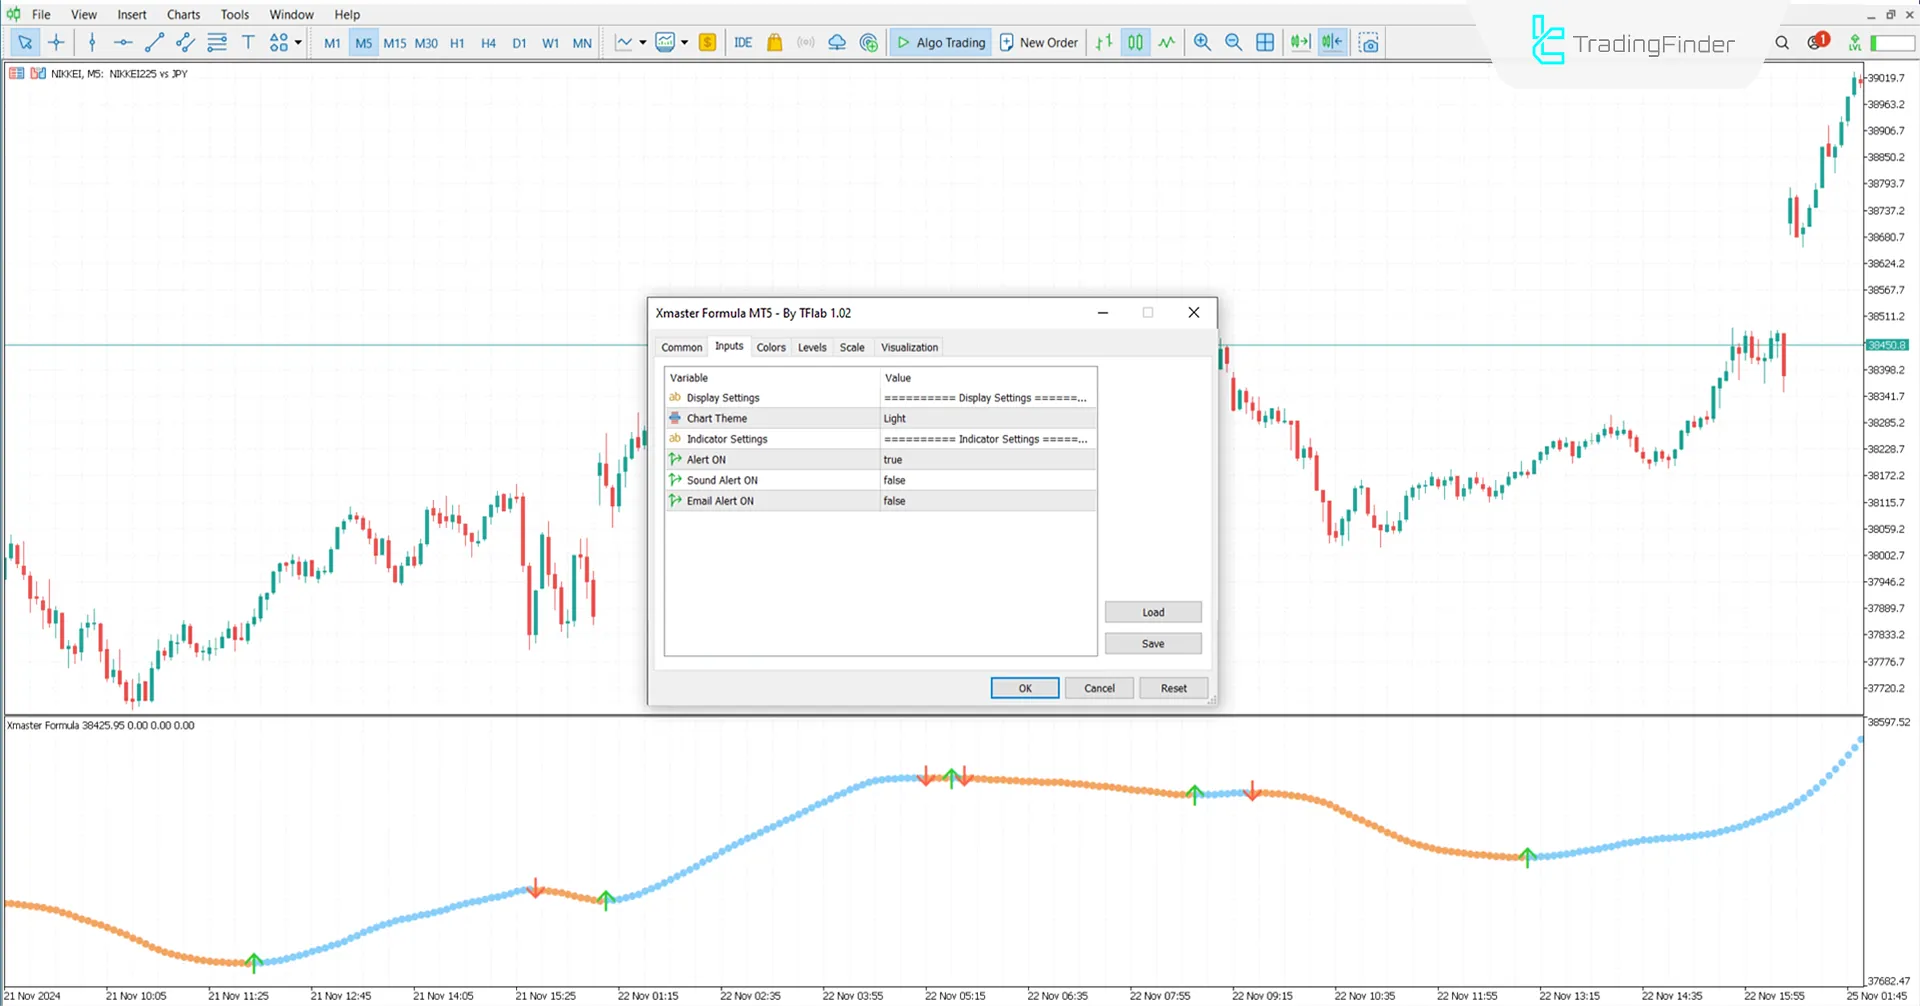
Image below shows the modifications and settings of the Formula Xmaster Indicator:

- Chart theme: Chart theme
- Alert on: Enable alerts
- Alert sound: Sound alert
- Alert email: Email alert
Conclusion
The Xmaster (XHMaster) Formula Indicator combines two powerful tools (MA and MACD) to identify trends and locate entry points for trades.
This tool performs well in volatile markets and provides traders with reliable signals. It is worth mentioning that the XMaster formula indicator MetaTrader 4 can be used effectively in trading.
Xmaster Formula MT5 PDF
Xmaster Formula MT5 PDF
Click to download Xmaster Formula MT5 PDFHow does Xmaster (XHMaster) Formula Indicator generate bullish and bearish signals?
The tool displays a green arrow to signal a bullish trend reversal and provide a buy signal. Similarly, it shows a red arrow to indicate a bearish trend reversal and provide a sell signal.
Which markets is Xmaster Formula Indicator suitable for?
The Xmaster Formula Indicator can be used in all financial markets without any limitations.


