


TradingView
MetaTrader4
MetaTrader5
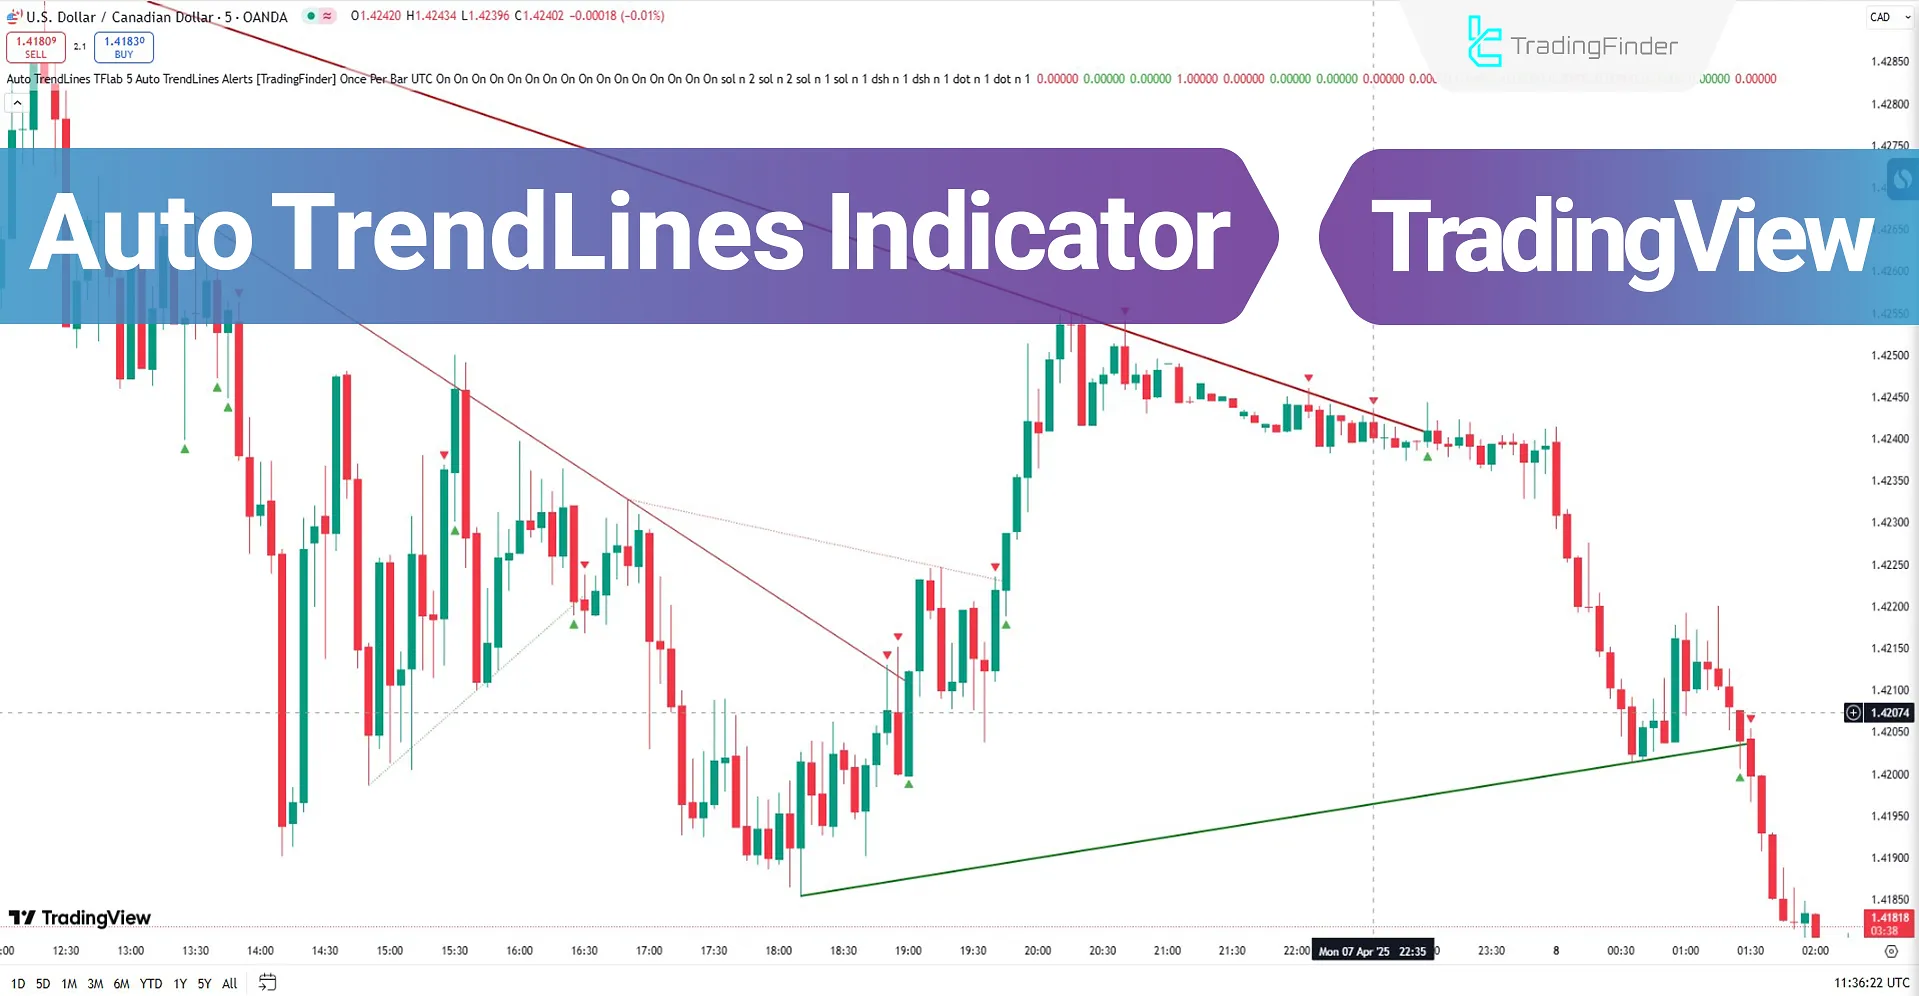
The Auto TrendLines Indicator is a technical analysis tool designed to automatically draw trendlines based on actual price behavior on the chart.
These lines are categorized into Major, Minor, Internal, and External trendlines. Traders use trendlines to identify market structure, gauge buying and selling strength, locate dynamic support and resistance zones, and pinpoint entry and exit points.
 How to use the Auto TrendLines Indicator in TradingView
In this indicator, major and minor trendlines are displayed in different colors to improve clarity and market direction detection:
- Uptrend Line: Green
- Downtrend Line: Red
- Minor Uptrend Line: Dashed Green
- Minor Downtrend Line: Dashed Red
Auto TrendLines Indicator Specifications
The table below provides a summary of the features of the Auto TrendLines.
Indicator Categories: | Support & Resistance Tradingview Indicators Signal & Forecast Tradingview Indicators Levels Tradingview Indicators |
Platforms: | Trading View Indicators |
Trading Skills: | Intermediate |
Indicator Types: | Reversal Tradingview Indicators Breakout Tradingview Indicators |
Timeframe: | Multi-Timeframe Tradingview Indicators |
Trading Style: | Day Trading Tradingview Indicators |
Trading Instruments: | TradingView Indicators in the Forex Market Cryptocurrency Tradingview Indicators Share Stocks Tradingview Indicators Binary Option Tradingview Indicators |
Overview of the Indicator
The Auto TrendLines Indicator helps identify trend reversal zones, breakout points, and dynamic support/resistance levels to determine the market’s direction.
When a price touches or breaks a trendline, it triggers real-time trade alerts to enable faster decision-making in volatile markets.
Signal arrows appear when the price reacts to a trendline:
- Green Arrow: Bullish signal
- Red Arrow: Bearish signal
These signals are generated based on price reactions to the trendlines and can greatly assist in quick analysis and timely trade entries.
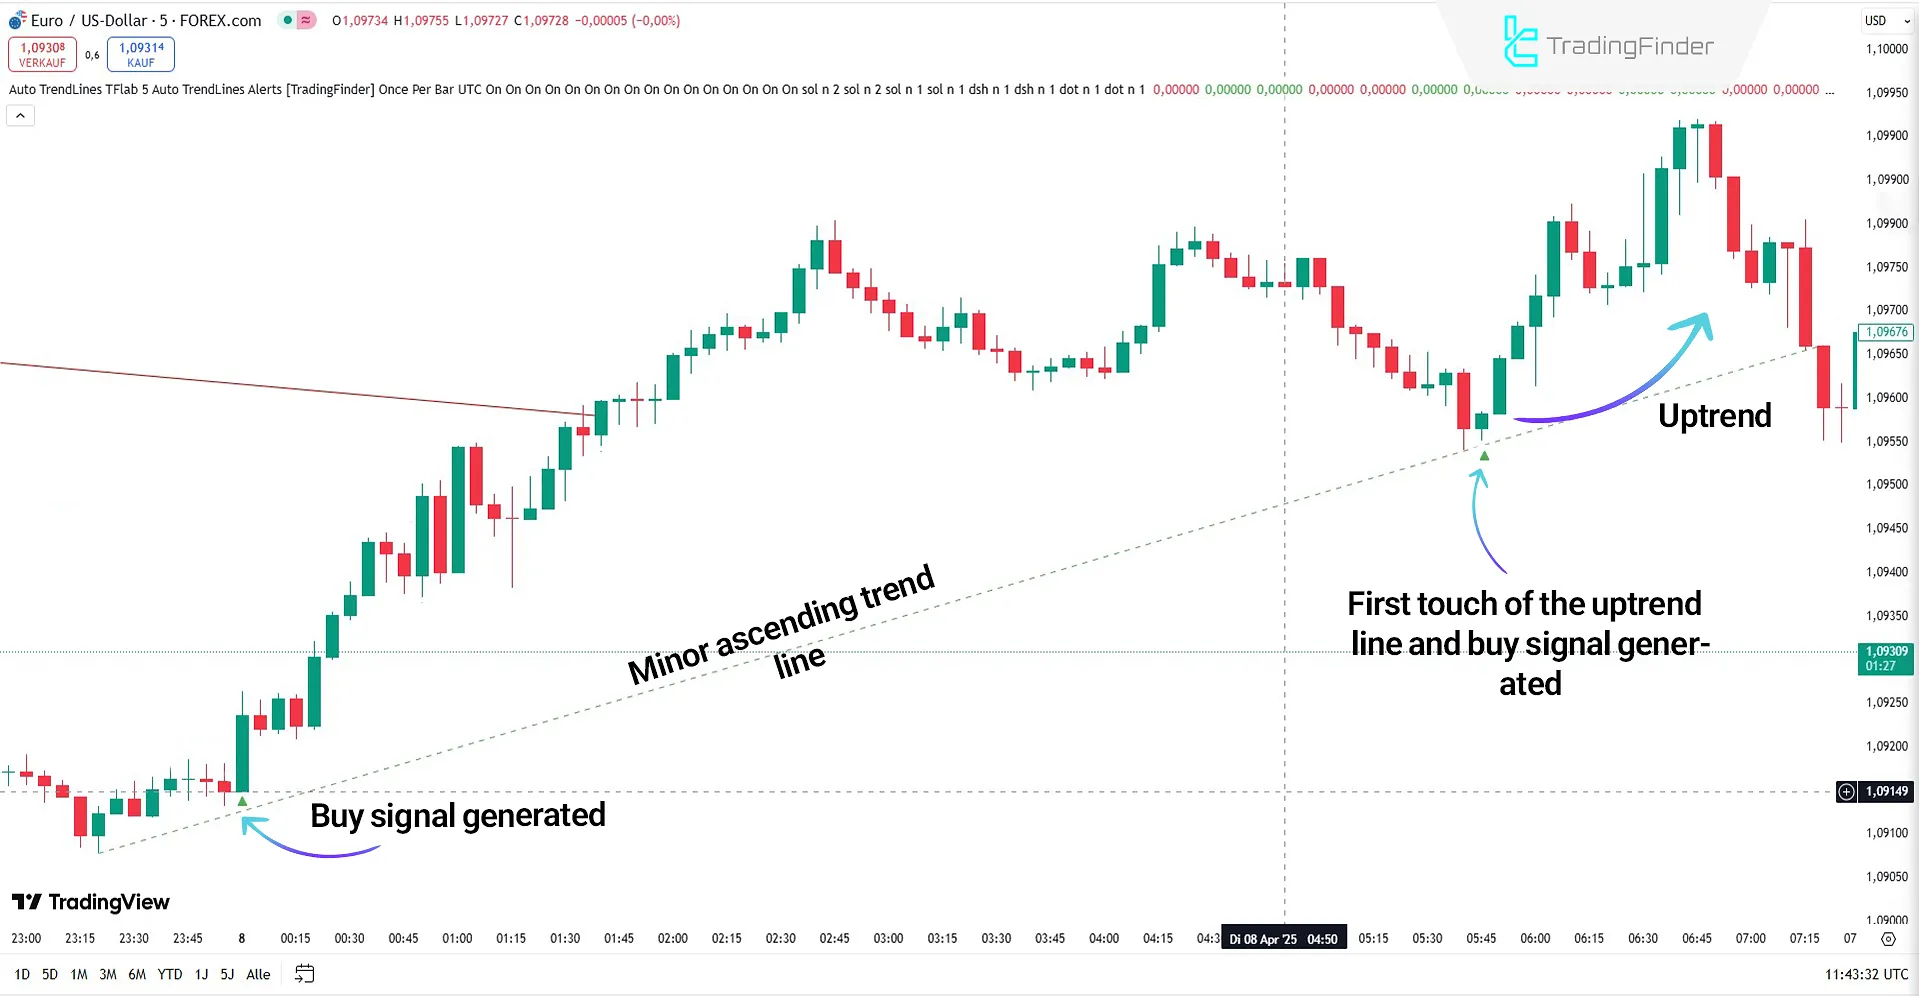
Bullish Trend Example
On the 5-minute EUR/USD chart, the price touches a minor trendline (dashed) and triggers a green arrow buy signal. After revisiting the line and receiving support, the price strongly moves upward.
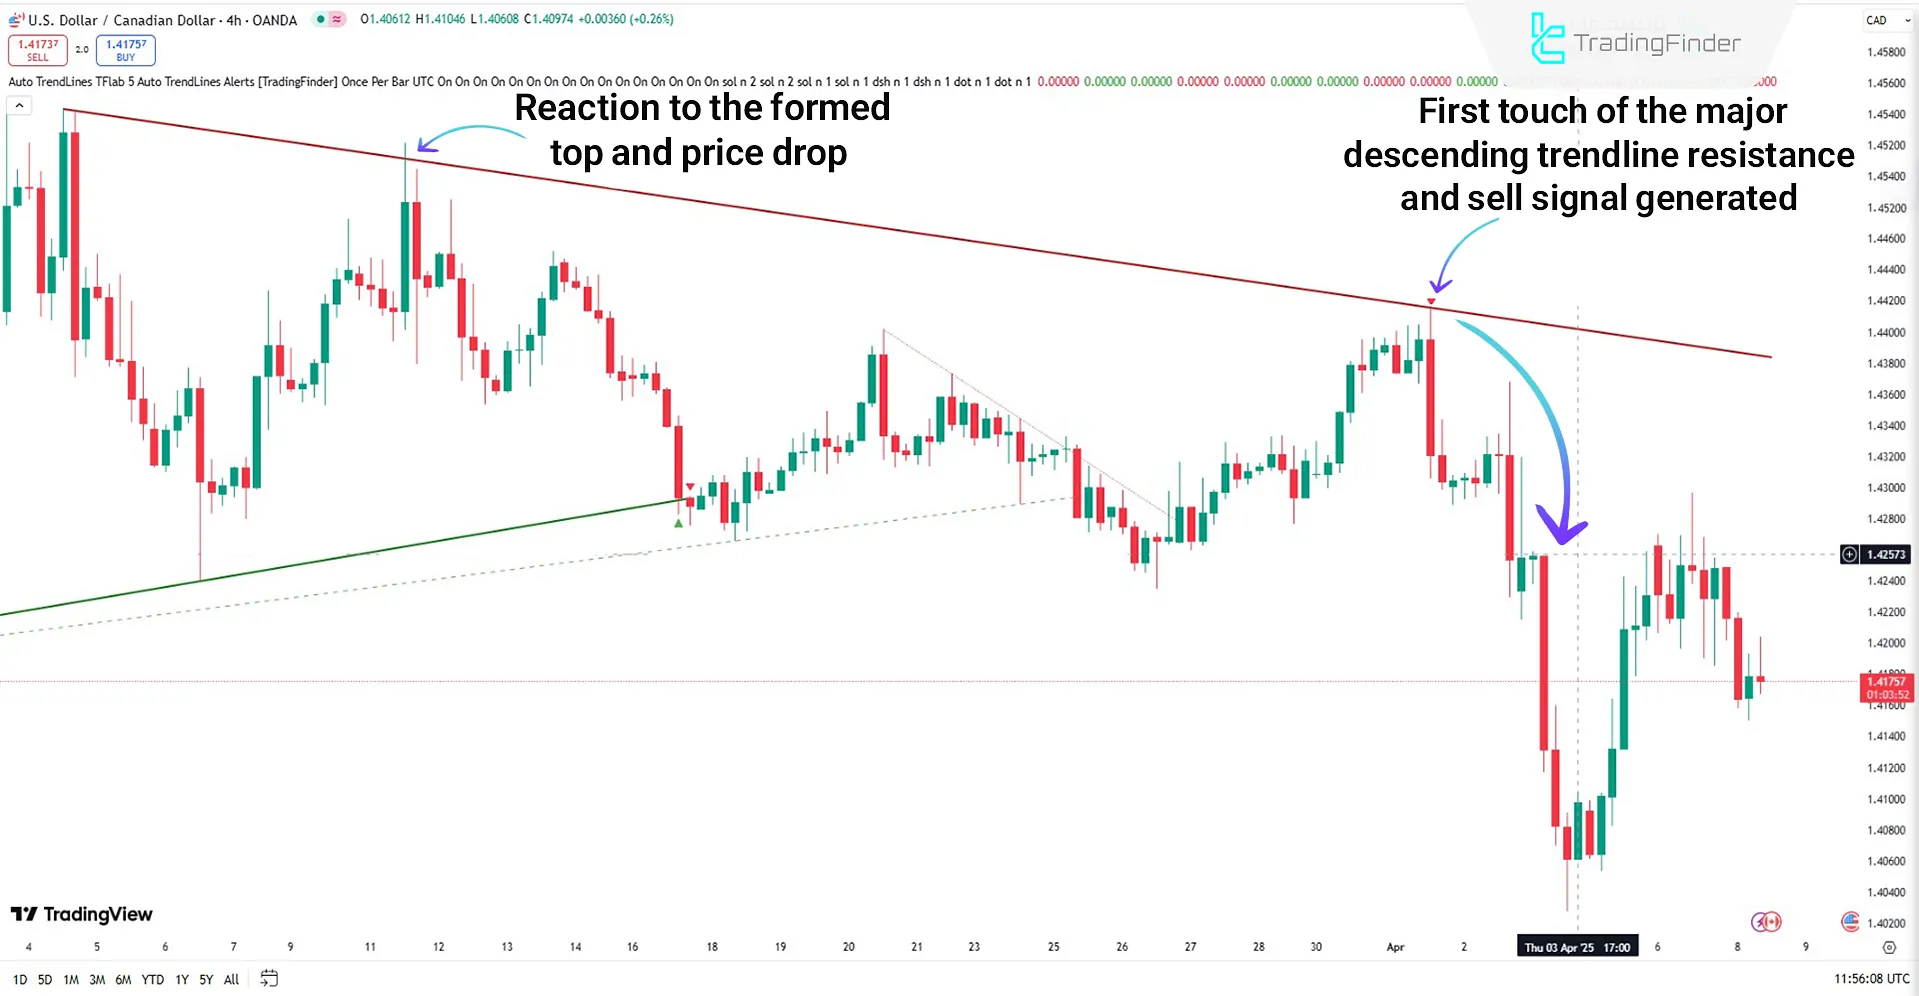
Bearish Trend Example
On the 4-hour USD/CAD chart, the Auto TrendLines Indicator detects a valid trendline and shows prices reacting to this zone. Upon failing to break the level, the indicator displays a red arrow sell signal, signaling the continuation of the downtrend.
Traders can confirm this signal using complementary trading strategies like candlestick analysis or key levels and enter short positions accordingly.
Auto TrendLines Indicator Settings
The full settings section of the Auto TrendLines Indicator is shown in the image below:
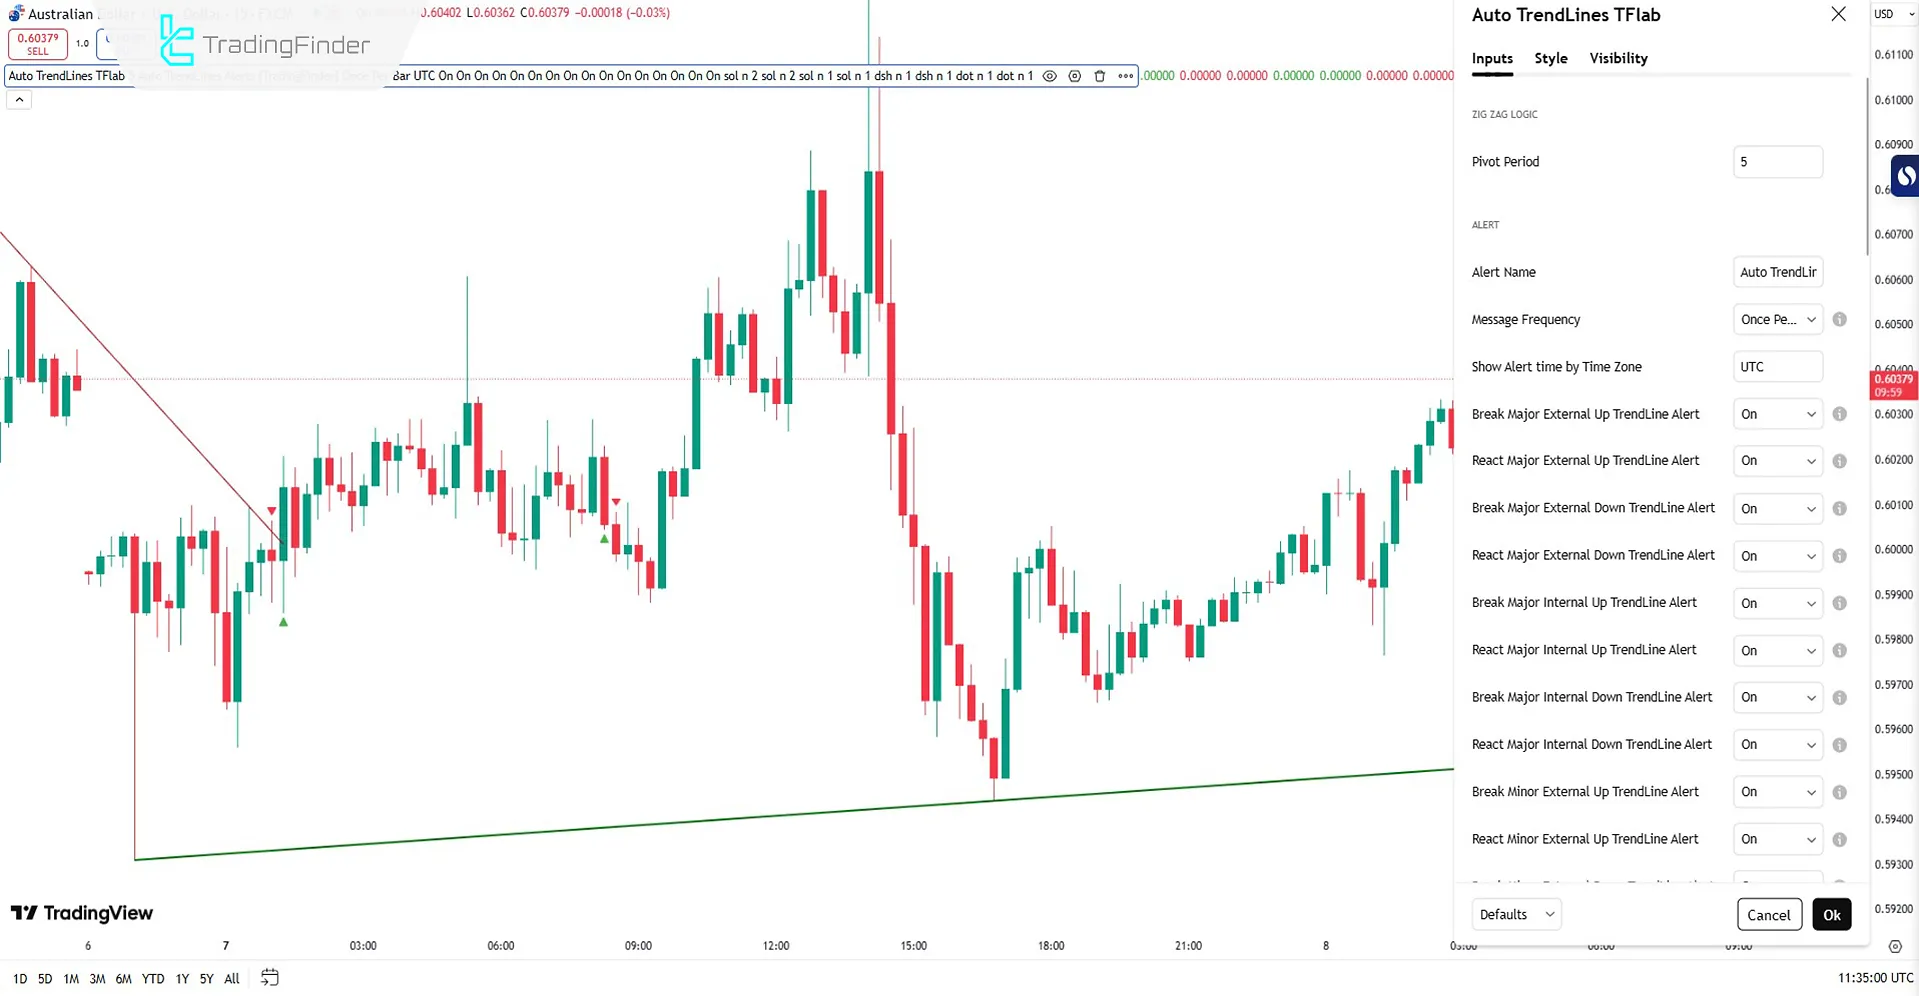
Zig Zag Logic
- Pivot Period: The pivot calculation period in the Zig Zag logic
Alert
- Alert Name: Name of the alert
- Message Frequency: Frequency of alert messages
- Show Alert Time by Time Zone: Display alert time based on your time zone
- Break Major External Up TrendLine Alert: Alert for breaking the major external upward trendline
- React Major External Up TrendLine Alert: Alert for reacting to the major external upward trendline
- Break Major External Down TrendLine Alert: Alert for breaking the major external downward trendline
- React Major External Down TrendLine Alert: Alert for reacting to the major external downward trendline
- Break Major Internal Up TrendLine Alert: Alert for breaking the major internal upward trendline
- React Major Internal Up TrendLine Alert: Alert for reacting to the major internal upward trendline
- Break Major Internal Down TrendLine Alert: Alert for breaking the major internal downward trendline
- React Major Internal Down TrendLine Alert: Alert for reacting to the major internal downward trendline
- Break Minor External Up TrendLine Alert: Alert for breaking the minor external upward trendline
- React Minor External Up TrendLine Alert: Alert for reacting to the minor external upward trendline
- Break Minor External Down TrendLine Alert: Alert for breaking the minor external downward trendline
- React Minor External Down TrendLine Alert: Alert for reacting to the minor external downward trendline
- Break Minor Internal Up TrendLine Alert: Alert for breaking the minor internal upward trendline
- React Minor Internal Up TrendLine Alert: Alert for reacting to the minor internal upward trendline
- Break Minor Internal Down TrendLine Alert: Alert for breaking the minor internal downward trendline
- React Minor Internal Down TrendLine Alert: Alert for reacting to the minor internal downward trendline
Major External Up TrendLine
- Show Major External Up TrendLine: Display the major external upward trendline
- Delete Previous Major External Up TrendLine: Delete the previous major external upward trendline
- Color: Color of the major external upward trendline
- Style: Line style
- Extend: Extend the trendline
- Width: Thickness of the trendline
Major External Down TrendLine
- Show Major External Down TrendLine: Display the major external downward trendline
- Delete Previous Major External Down TrendLine: Delete the previous major external downward trendline
- Color: Color of the major external downward trendline
- Style: Line style
- Extend: Extend the trendline
- Width: Thickness of the trendline
Major Internal Up TrendLine
- Show Major Internal Up TrendLine: Display the major internal upward trendline
- Delete Previous Major Internal Up TrendLine: Delete the previous major internal upward trendline
- Color: Color of the major internal upward trendline
- Style: Line style
- Extend: Extend the trendline
- Width: Thickness of the trendline
Major Internal Down TrendLine
- Show Major Internal Down TrendLine: Display the major internal downward trendline
- Delete Previous Major Internal Down TrendLine: Delete the previous major internal downward trendline
- Color: Color of the major internal downward trendline
- Style: Line style
- Extend: Extend the trendline
Minor External Up TrendLine
- Show Minor External Up TrendLine: Display the minor external upward trendline
- Delete Previous Minor External Up TrendLine: Delete the previous minor external upward trendline
- Color: Color of the minor external upward trendline
- Style: Line style
- Extend: Extend the trendline
- Width: Thickness of the trendline
Minor External Down TrendLine
- Show Minor External Down TrendLine: Display the minor external downward trendline
- Delete Previous Minor External Down TrendLine: Delete the previous minor external downward trendline
- Color: Color of the minor external downward trendline
- Style: Line style
- Extend: Extend the trendline
Minor Internal Up TrendLine
- Show Minor Internal Up TrendLine: Display the minor internal upward trendline
- Delete Previous Minor Internal Up TrendLine: Delete the previous minor internal upward trendline
- Color: Color of the minor internal upward trendline
- Style: Line style
- Extend: Extend the trendline
- Width: Thickness of the trendline
Minor Internal Down TrendLine
- Show Minor Internal Down TrendLine: Display the minor internal downward trendline
- Delete Previous Minor Internal Down TrendLine: Delete the previous minor internal downward trendline
- Color: Color of the minor internal downward trendline
- Style: Line style
- Extend: Extend the trendline
Conclusion
The Auto TrendLines Indicator is a powerful analytical tool that automatically draws trendlines based on price behavior. It classifies trendlines into major, minor, internal, and external categories, using distinct colors to indicate market direction.
Its standout feature is real-time alerting when the price breaks or reacts to these lines, shown via colored arrows (green for bullish, red for bearish). Additionally, the indicator is fully customizable in the settings section.
Auto TrendLines To TradingView PDF
Auto TrendLines To TradingView PDF
Click to download Auto TrendLines To TradingView PDFHow does the Auto TrendLines Indicator draw trendlines?
Trendlines in the Auto TrendLines Indicator are automatically drawn based on ZigZag logic and valid price pivots.
What’s the difference between major and minor trendlines in this indicator?
Major trendlines represent the macro market structure, while minor trendlines reflect shorter-term or internal price structures.


