


Butterfly Harmonic Pattern Indicator is one of the TradingView Harmonic Pattern Indicators that uses Fibonacci ratios to identify price reversal points.
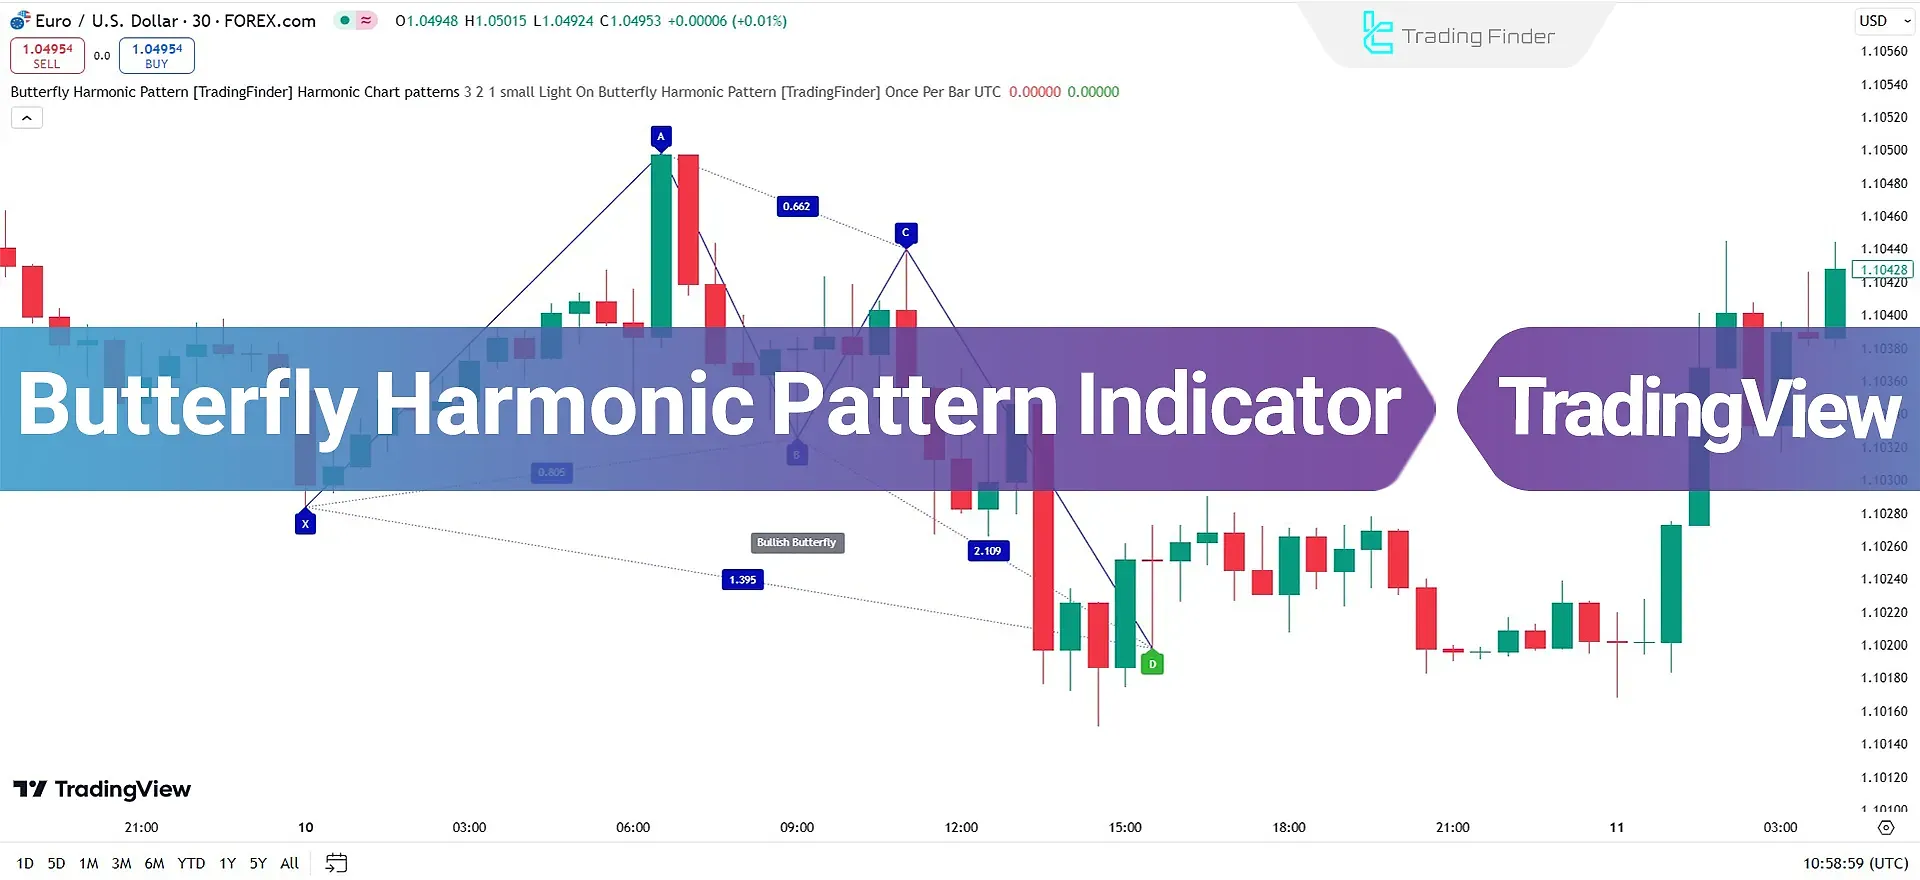
This pattern consists offive key points: A, B, C, X, and D. Indicator highlights the D Point as the most critical part of this pattern as it typically has the highest potential for price reversal (PRZ).
Specification Table for the Butterfly Pattern Indicator
The specifications of the indicator are briefly outlined in the table below:
Indicator Categories: | Signal & Forecast Tradingview Indicators Harmonic Tradingview Indicators Chart & Classic Tradingview indicators |
Platforms: | Trading View Indicators |
Trading Skills: | Intermediate |
Indicator Types: | Reversal Tradingview Indicators |
Timeframe: | Multi-Timeframe Tradingview Indicators |
Trading Style: | Day Trading Tradingview Indicators |
Trading Instruments: | TradingView Indicators in the Forex Market Cryptocurrency Tradingview Indicators Stock Tradingview Indicators Forward Tradingview Indicators Share Stocks Tradingview Indicators |
Overview of the Indicator
Each point in the Butterfly Harmonic Pattern plays a specific role in analyzing its structure. Point X serves as the starting point of the pattern and acts as the base for Fibonacci ratio calculations.
The movement from X to A represents an initial price move, usually identifiable as a trend. Point B reflects a partial correction of the XA move, typically falling within the 0.618 Fibonacci range.
Following this, Point C illustrates the continuation of the price movement. Finally, Point D stands out as the most critical point of the pattern, marking the Potential Reversal Zone (PRZ).
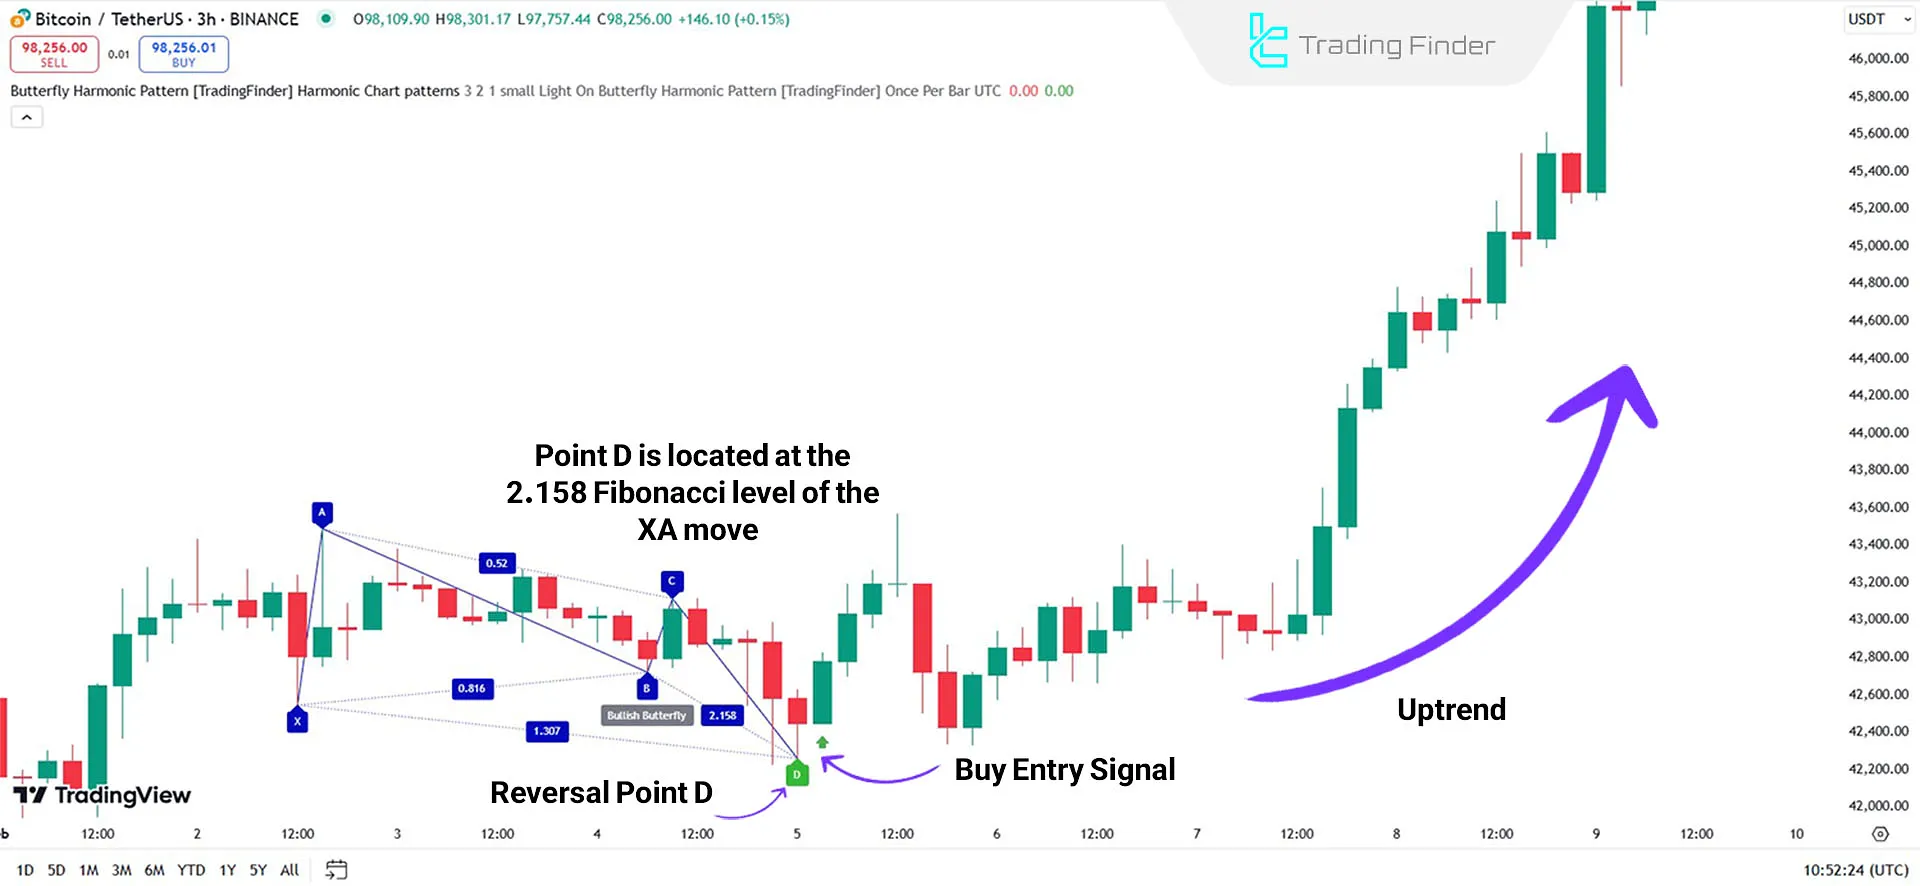
Indicators in Bullish Trends
In Bitcoin's (BTC) 3-hour chart, the bullish Butterfly Harmonic Pattern completes when the price reaches Point D in the Potential Reversal Zone (PRZ).
The price enters an uptrend at this point, forming consecutive higher highs and higher lows. The indicator also issues a buy signal.
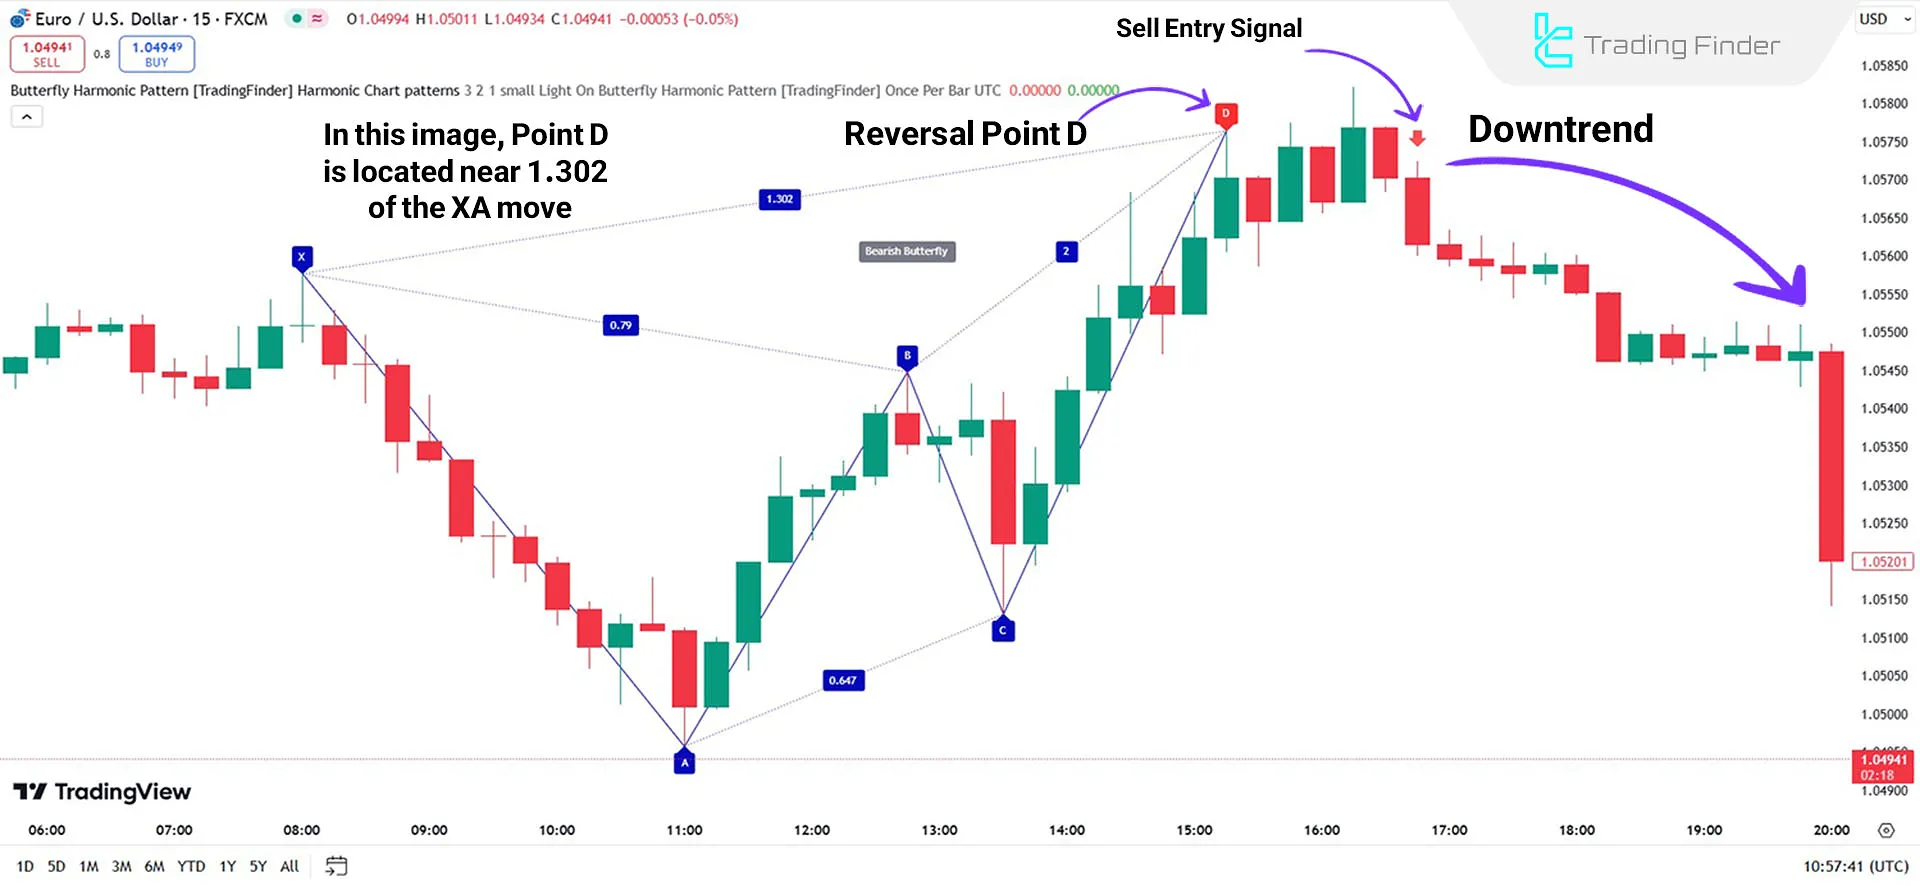
Indicators in Bearish Trends
In the EUR/USD pair's downtrend, the key points X, A, B, C, and D are identified. After the price reaches Point D, recognized as the Potential Reversal Zone (PRZ), Point BC corrects approximately 0.647 of the AB move.
The price enters a downtrend upon forming Point D, consistently creating lower and lower highs. At this stage, the indicator displays a sell signal.
Indicator Settings
In the image below, the comprehensive settings of the Butterfly Harmonic Indicator are shown, which include [Logical Setting, Display Setting, and Alert]:
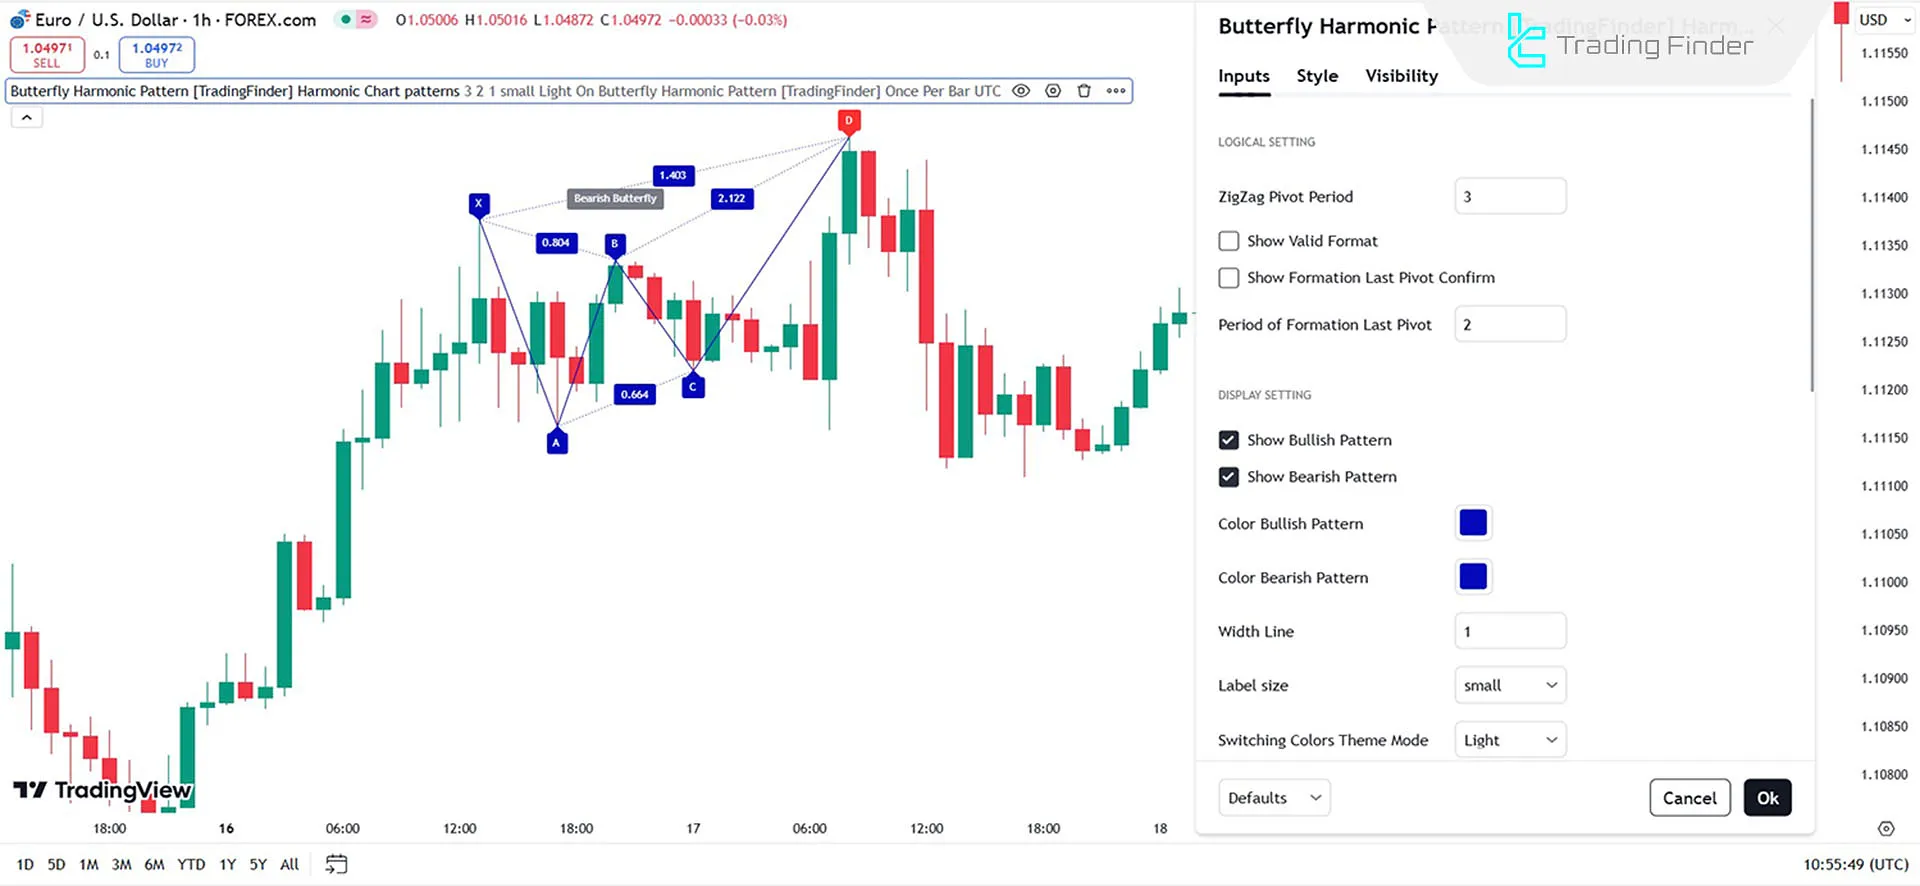
Logical Setting
- ZigZag Pivot Period: Default value is 3
- Show Valid Format: Display only valid patterns
- Show Formation Last Pivot Confirm: Show confirmation for the last pivot
- Period of Formation Pivot: Default value is 2
Display Setting
- Show Bullish Pattern: Display bullish patterns
- Show Bearish Pattern: Display bearish patterns
- Color Bullish Pattern: The default color is blue
- Color Bearish Pattern: The default color is blue
- Width Line: Default line thickness is 1
- Label Size: Adjustable label text size
- Switching Colors Theme Mode: Adjust the chart background theme
Alert
- Alert: Notifications when a pattern is detected
- Alert Name: Customizable alert name
- Message Frequency: Content of the alert message
- Show Alert Time by Time Zone: Displays alert time based on the selected time zone
Conclusion
With the formation of Point D as the Potential Reversal Zone (PRZ), the price enters a new trend, which can continue either upward or downward.
This Chart & Classic indicators is specifically designed for traders who want to identify price reversal zones and enter trades with minimal risk.
The Fibonacci points in this pattern are precisely calibrated to intelligently detect price movements and reversal points.
Butterfly Harmonic Pattern TradingView PDF
Butterfly Harmonic Pattern TradingView PDF
Click to download Butterfly Harmonic Pattern TradingView PDFWhat is the Butterfly Harmonic Pattern Indicator?
It is an analytical tool that identifies Potential Reversal Zones (PRZ) using Fibonacci ratios.
How do I use this indicator?
Once the price reaches Point D, you can enter buy or sell trades.


