TradingView
MetaTrader4
MetaTrader5
The Candlestick Patterns indicator in Trading View indicator is a technical analysis tool used in various strategies to identify Pin Bar candlesticks, including Hammer, Shooting Star, Hanging Man, and Inverted Hammer patterns.
Traders can use Pin Bars as confirmation signals for entry points. This indicator detects all four patterns and highlights them as colored candlesticks, utilizing triangles and circles to identify key reversal or continuation points in the trend.
Indicator Table
|
Indicator Categories:
|
Candle Sticks Tradingview Indicators
Educational Tradingview Indicators
Chart & Classic Tradingview indicators
|
|
Platforms:
|
Trading View Indicators
|
|
Trading Skills:
|
Elementary
|
|
Indicator Types:
|
Trend Tradingview Indicators
Reversal Tradingview Indicators
|
|
Timeframe:
|
Multi-Timeframe Tradingview Indicators
|
|
Trading Style:
|
Fast Scalper Tradingview Indicators
Day Trading Tradingview Indicators
Scalper Tradingview Indicators
Swing Trading Tradingview Indicators
|
|
Trading Instruments:
|
TradingView Indicators in the Forex Market
Cryptocurrency Tradingview Indicators
Stock Tradingview Indicators
Commodity Tradingview Indicators
Indices Tradingview Indicators
Share Stocks Tradingview Indicators
|
Overview
One indicator for identifying trend reversals or continuations is candlestick patterns, which can be used alongside many trading strategies.
The Candlestick Patterns indicator in Trading View marks bullish Pin Bars in an uptrend with a blue circle, bearish Pin Bars in a downtrend with a red circle, bearish Pin Bars in an uptrend with a black triangle, and bullish Pin Bars in a downtrend with a blue triangle.
Hammer candlestick pattern
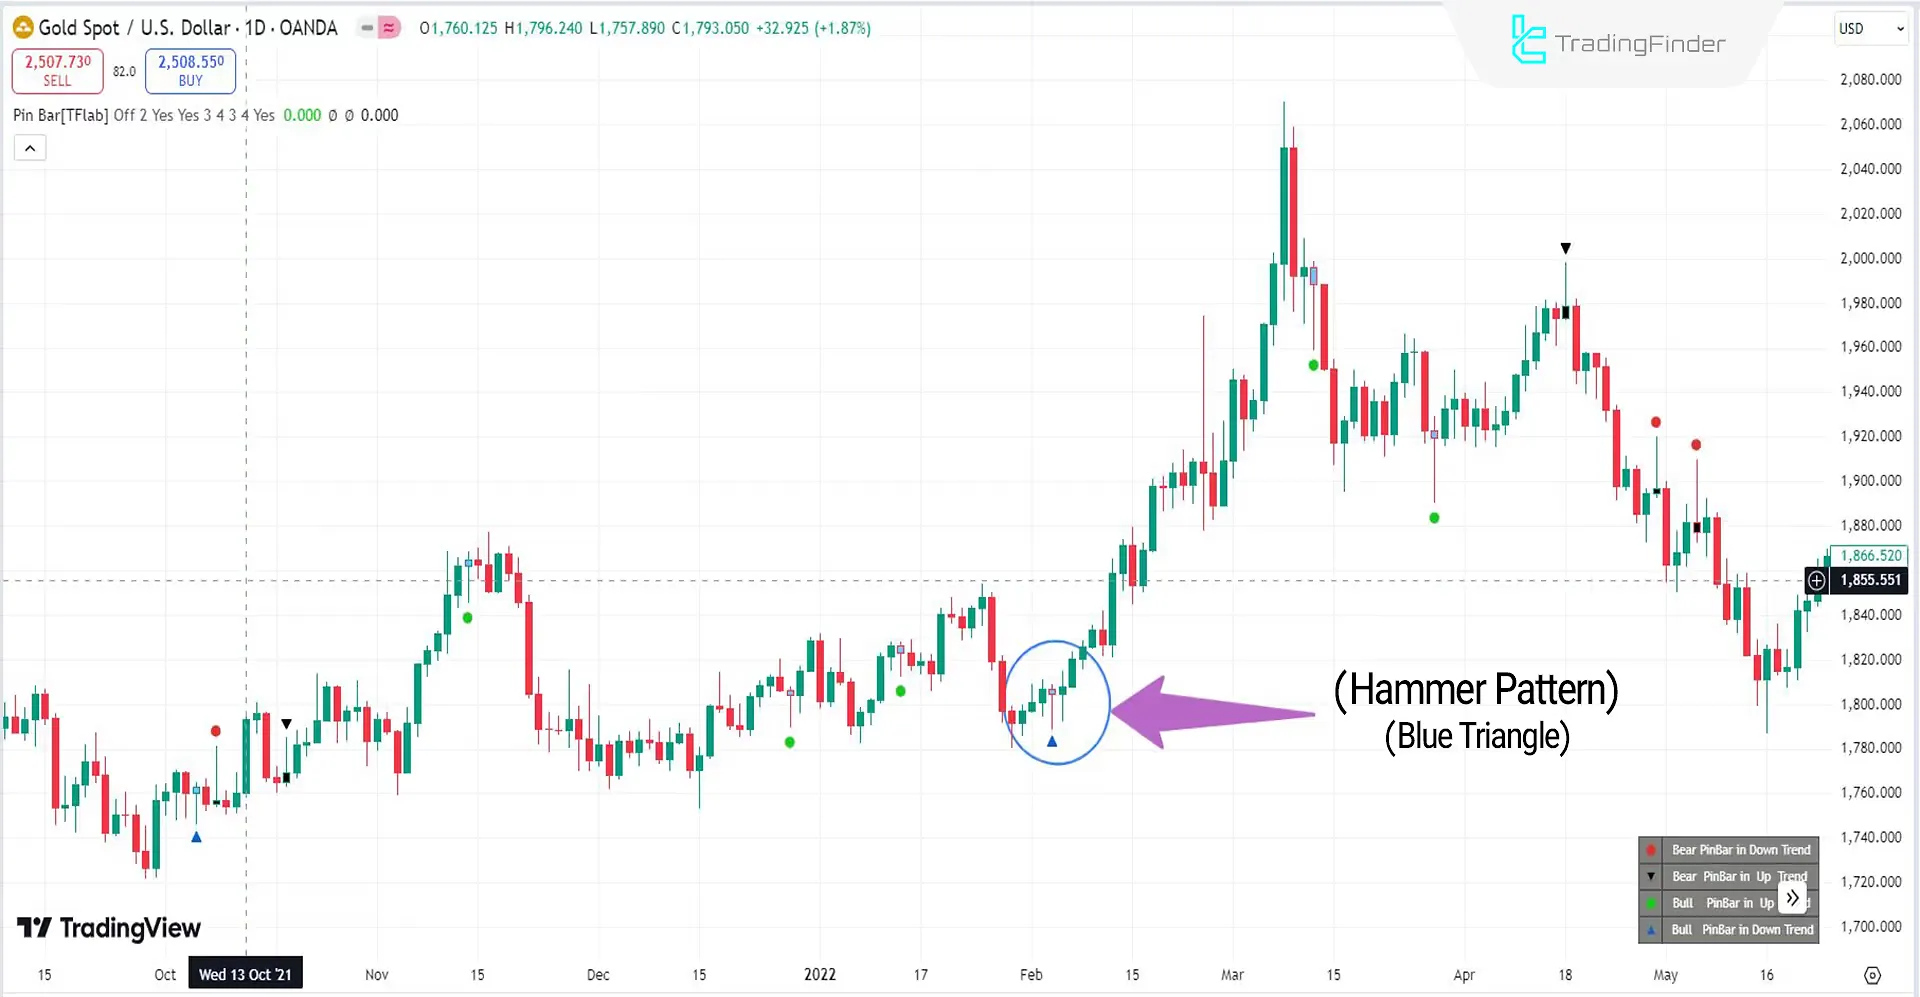
In the image below, the price chart of Gold against the US dollar (Gold Spot/U.S. Dollar) is shown in a daily timeframe. At the end of a downward correction, the indicator identifies a turquoise-blue candlestick, and a blue triangle is marked on the chart.
A trend reversal has occurred in this scenario, turning the downward trend to upward.Top of Form
Inverted Hammer candlestick pattern
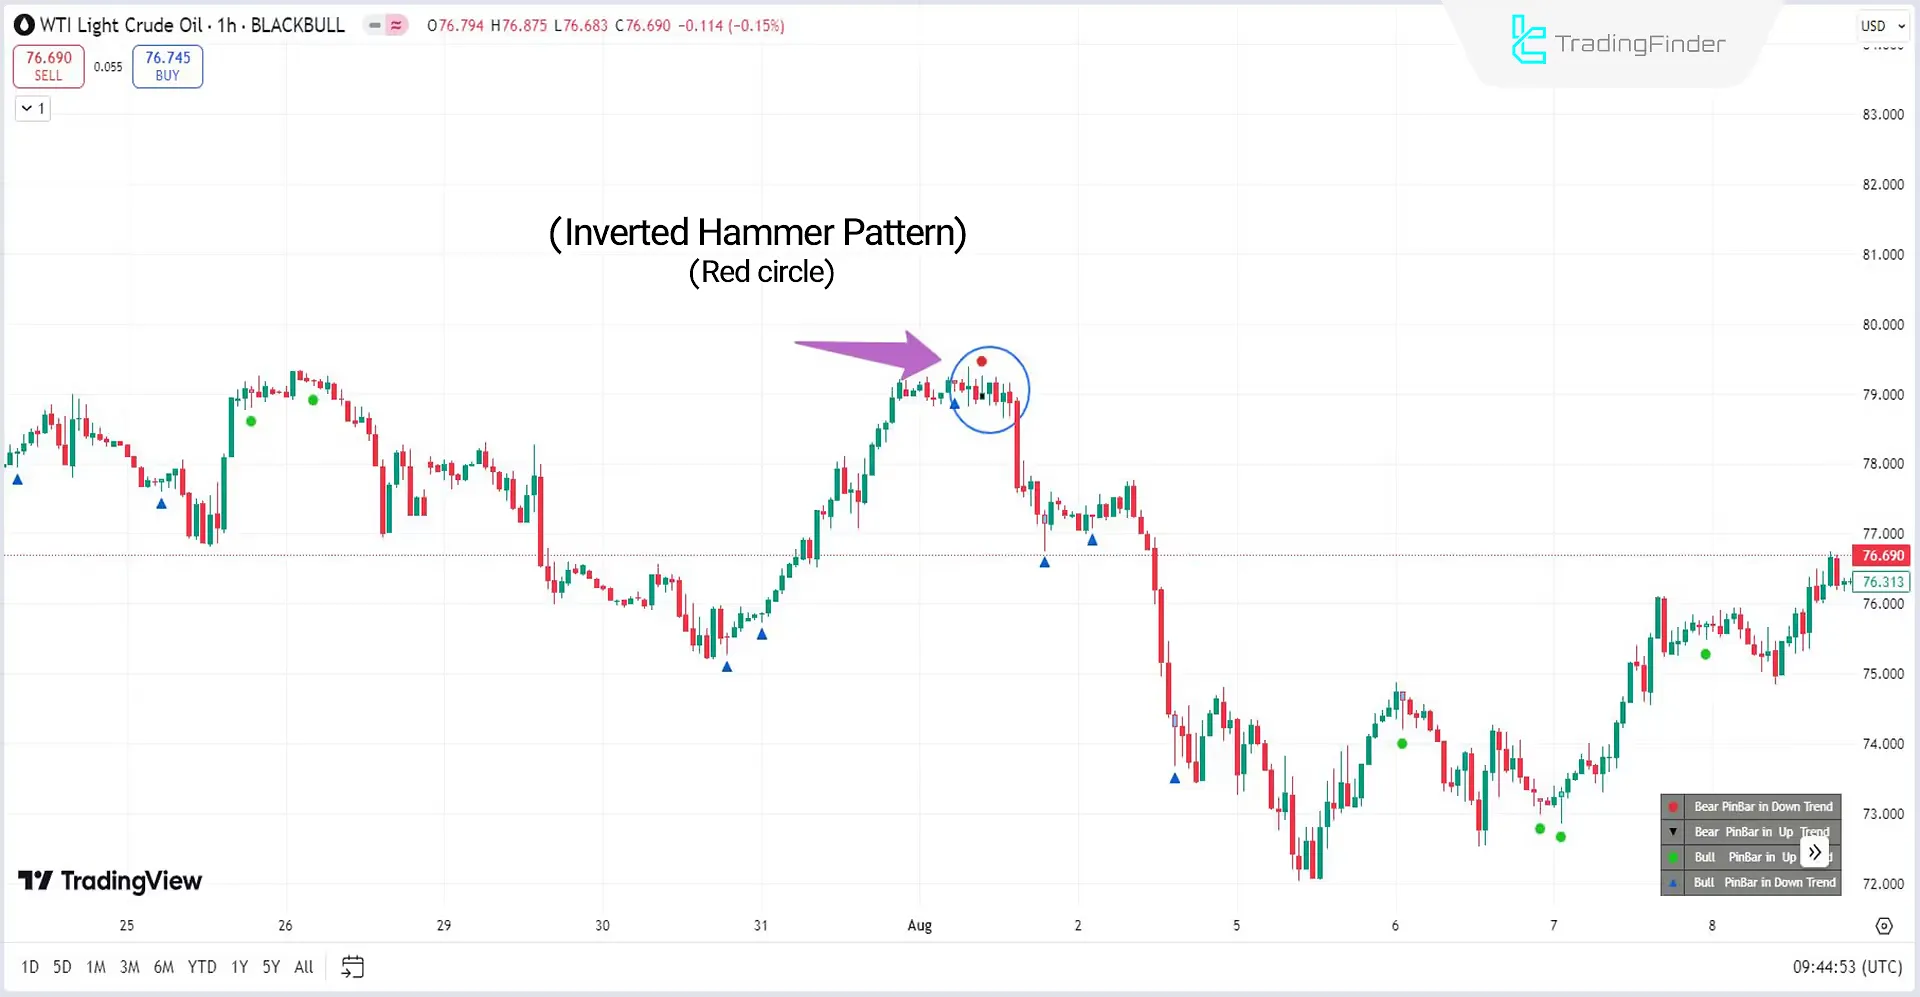
In the image below, the price chart of Texas Oil (WTI) in a one-hour timeframe is displayed, showing an Inverted Hammer candlestick at the end of an uptrend.
The indicator has identified this pattern and marked it with a red circle on the chart. In this scenario, a trend reversal has occurred, changing the upward trend to a downward one.
Hanging Man Candlestick Pattern
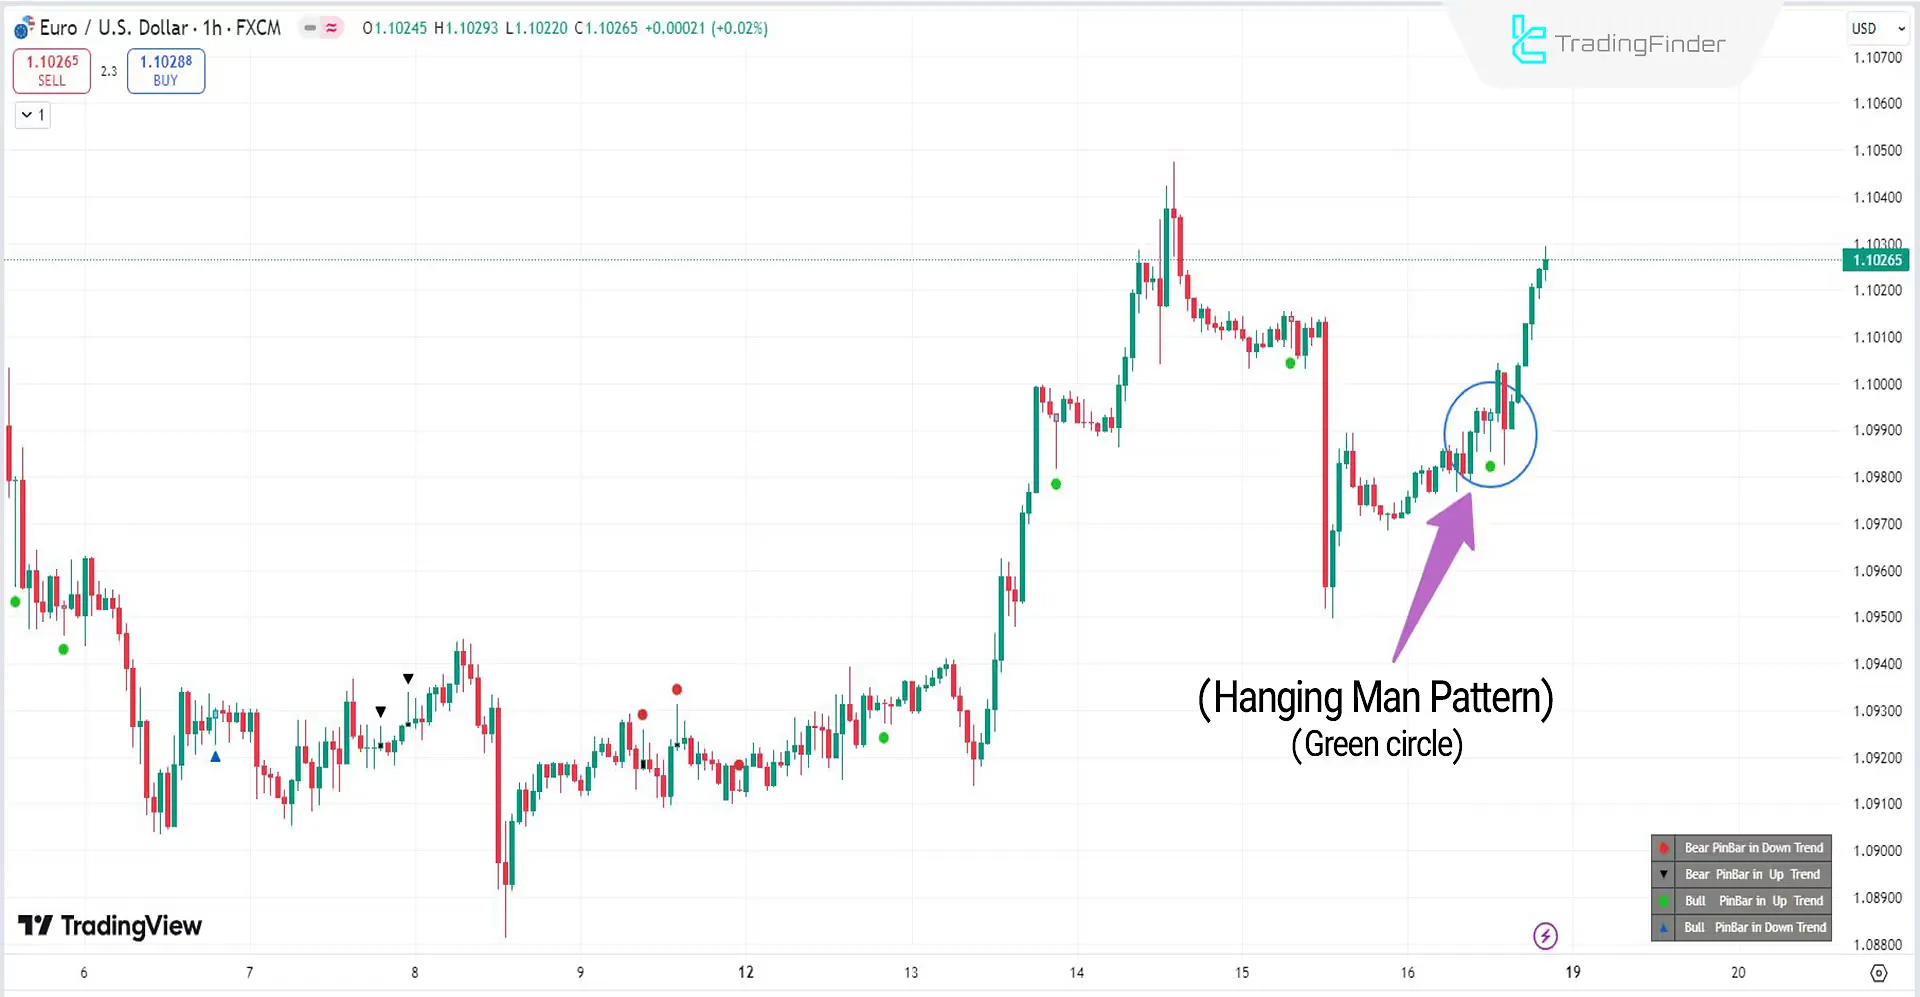
In the image below, the price chart of the Euro to US Dollar (EURUSD) in a one-hour timeframe is displayed. A Hanging Man candlestick pattern is identified in an uptrend and marked with a green circle on the chart.
This candlestick pattern indicates the continuation of the prevailing trend, and the uptrend has continued.
Shooting Star Candlestick Pattern
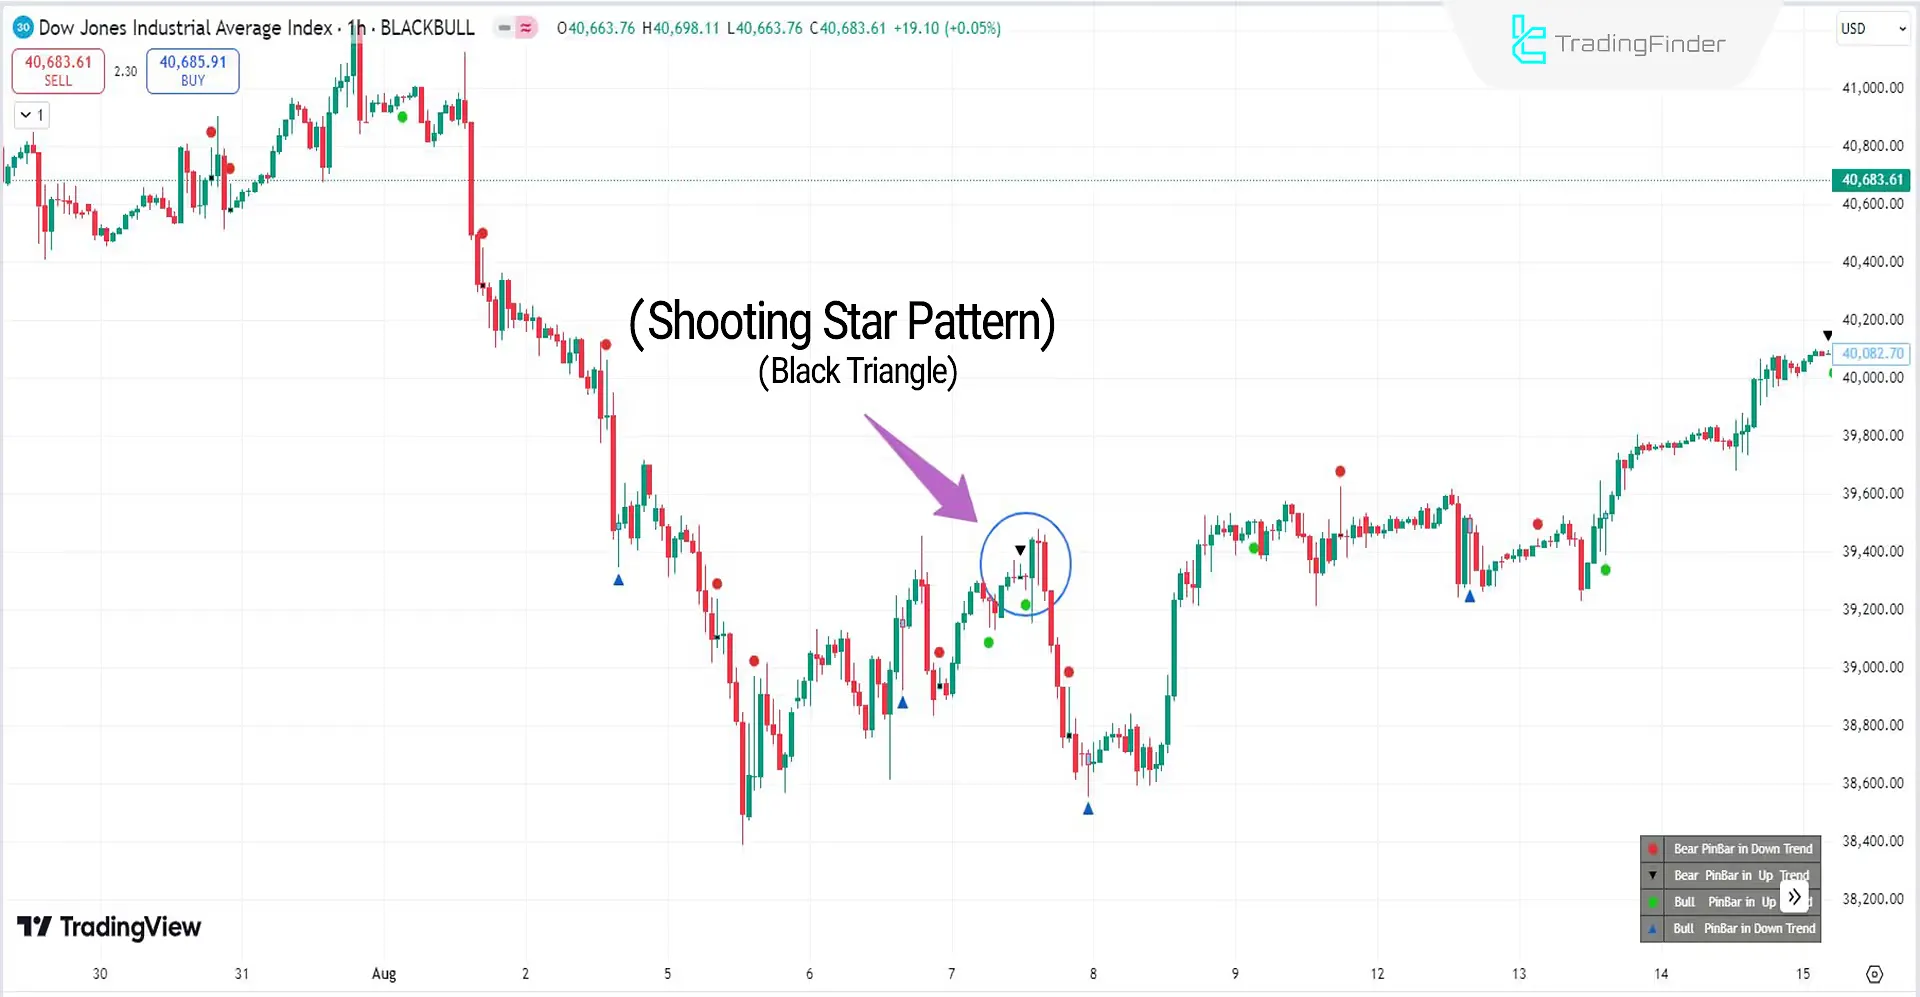
The image below shows the price chart of the Dow Jones Index in a one-hour timeframe. The indicator at the end of an upward correction, marked with a black triangle on the chart, is a Shooting Star candlestick.
In this scenario, a signal for a trend reversal has appeared, resulting in a downward movement in the price.
Settings of the Candlesticks Patterns Indicator
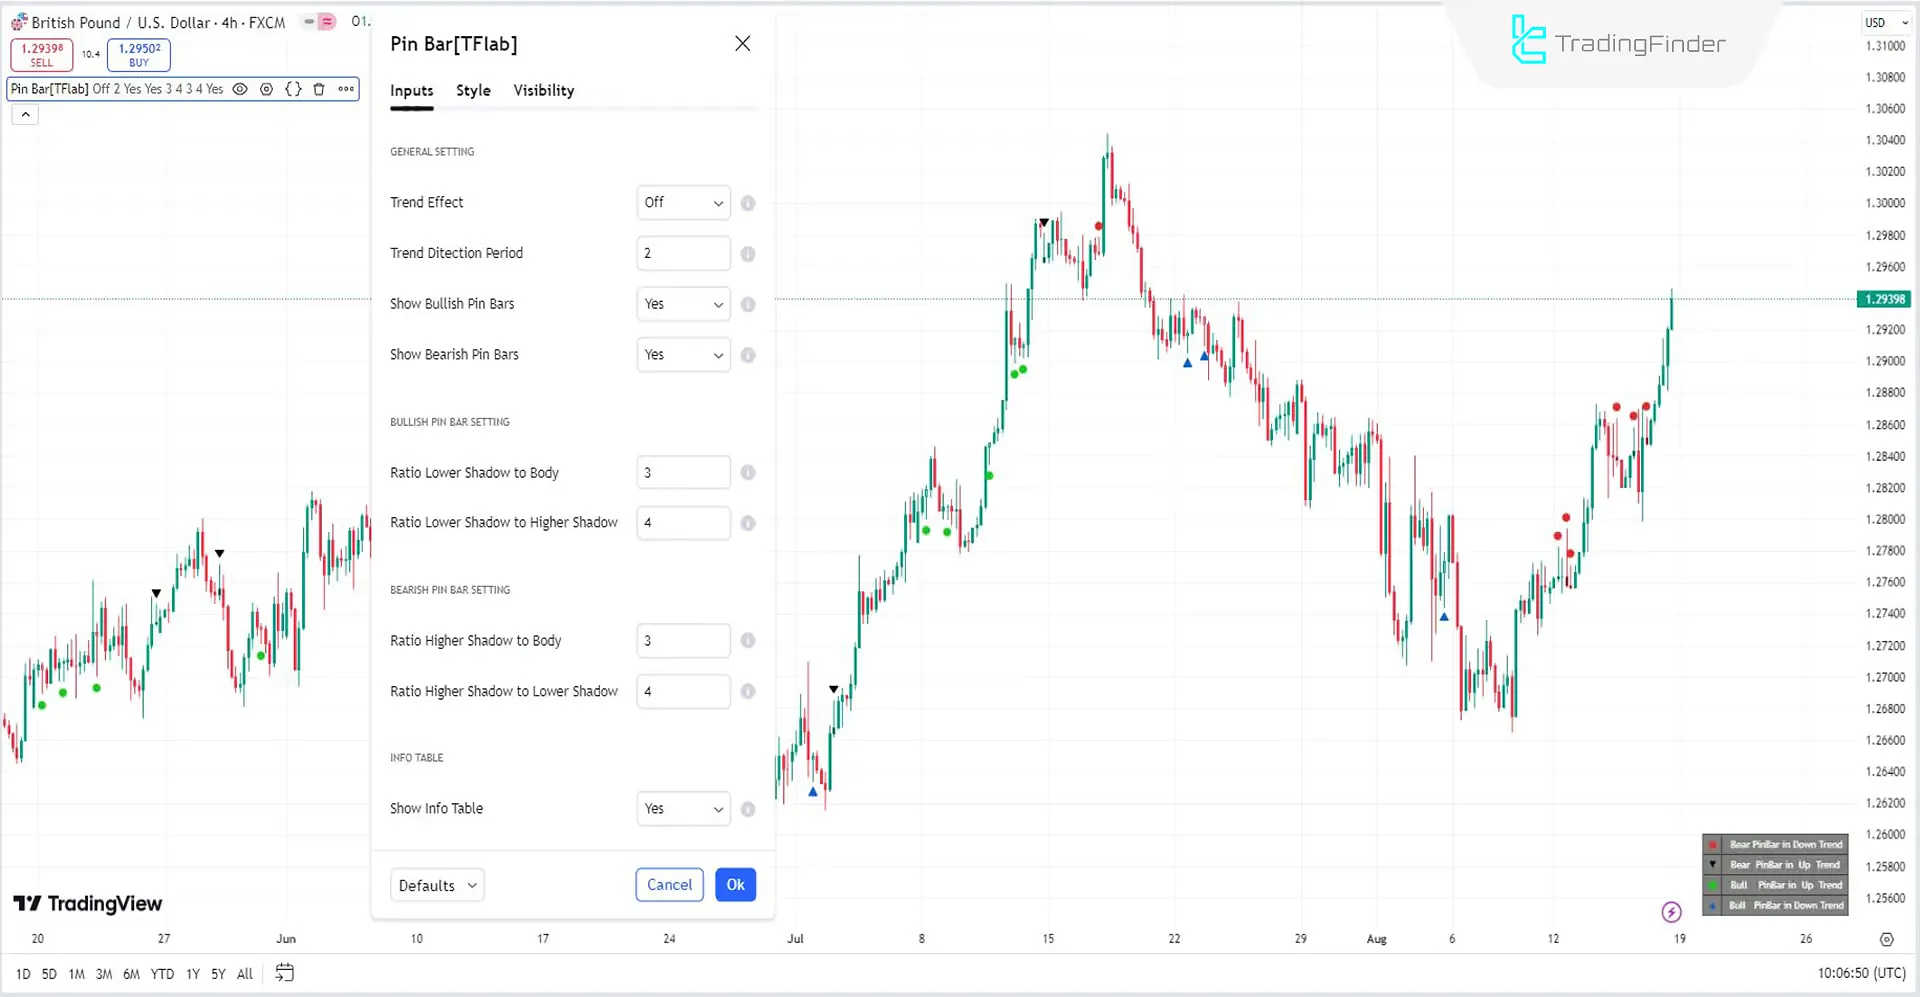
- Trend Effect: Set it to (Off) to detect all pin bars in both uptrends and downtrends;
- Trend Detection Period: Set the trend detection period to 2;
- Show Bullish Pin Bars: Set it to (Yes) to display bullish pin bars;
- Show Bearish Pin Bars: Set it to (Yes) to display bearish pin bars;
- Ratio Lower Shadow to Body: The ratio of the lower shadow to the body is set at 3;
- Ratio Lower Shadow to Higher Shadow: The ratio of the lower shadow to the higher shadow is set at 4;
- Ratio Higher Shadow to Body: The ratio of the higher shadow to the body is set at 3;
- Ratio Higher Shadow to Lower Shadow: The ratio of the higher shadow to the lower shadow is set at 4;
- Show Info Table: The indicator's information table should be placed in the bottom right corner of the chart.
Summary
The Candlestick Patterns indicator can serve as an additional verification and confirmation alongside various trading strategies such as Price Action, Smart Money, and classic methods.
It is not recommended to use this indicator alone. These patterns are applicable across all financial markets and various timeframes.
What is the Candlesticks Pattern indicator, and how does it work?
This indicator is a technical analysis tool that automatically identifies candlestick patterns such as the Pin Bar, Hammer, Inverted Hammer, Hanging Man, and Shooting Star.
In which markets can the Candlesticks Pattern indicator be used?
Candlestick patterns can be used in all markets, including Forex, cryptocurrencies, stocks, etc., and across various timeframes.