TradingView
MetaTrader4
MetaTrader5
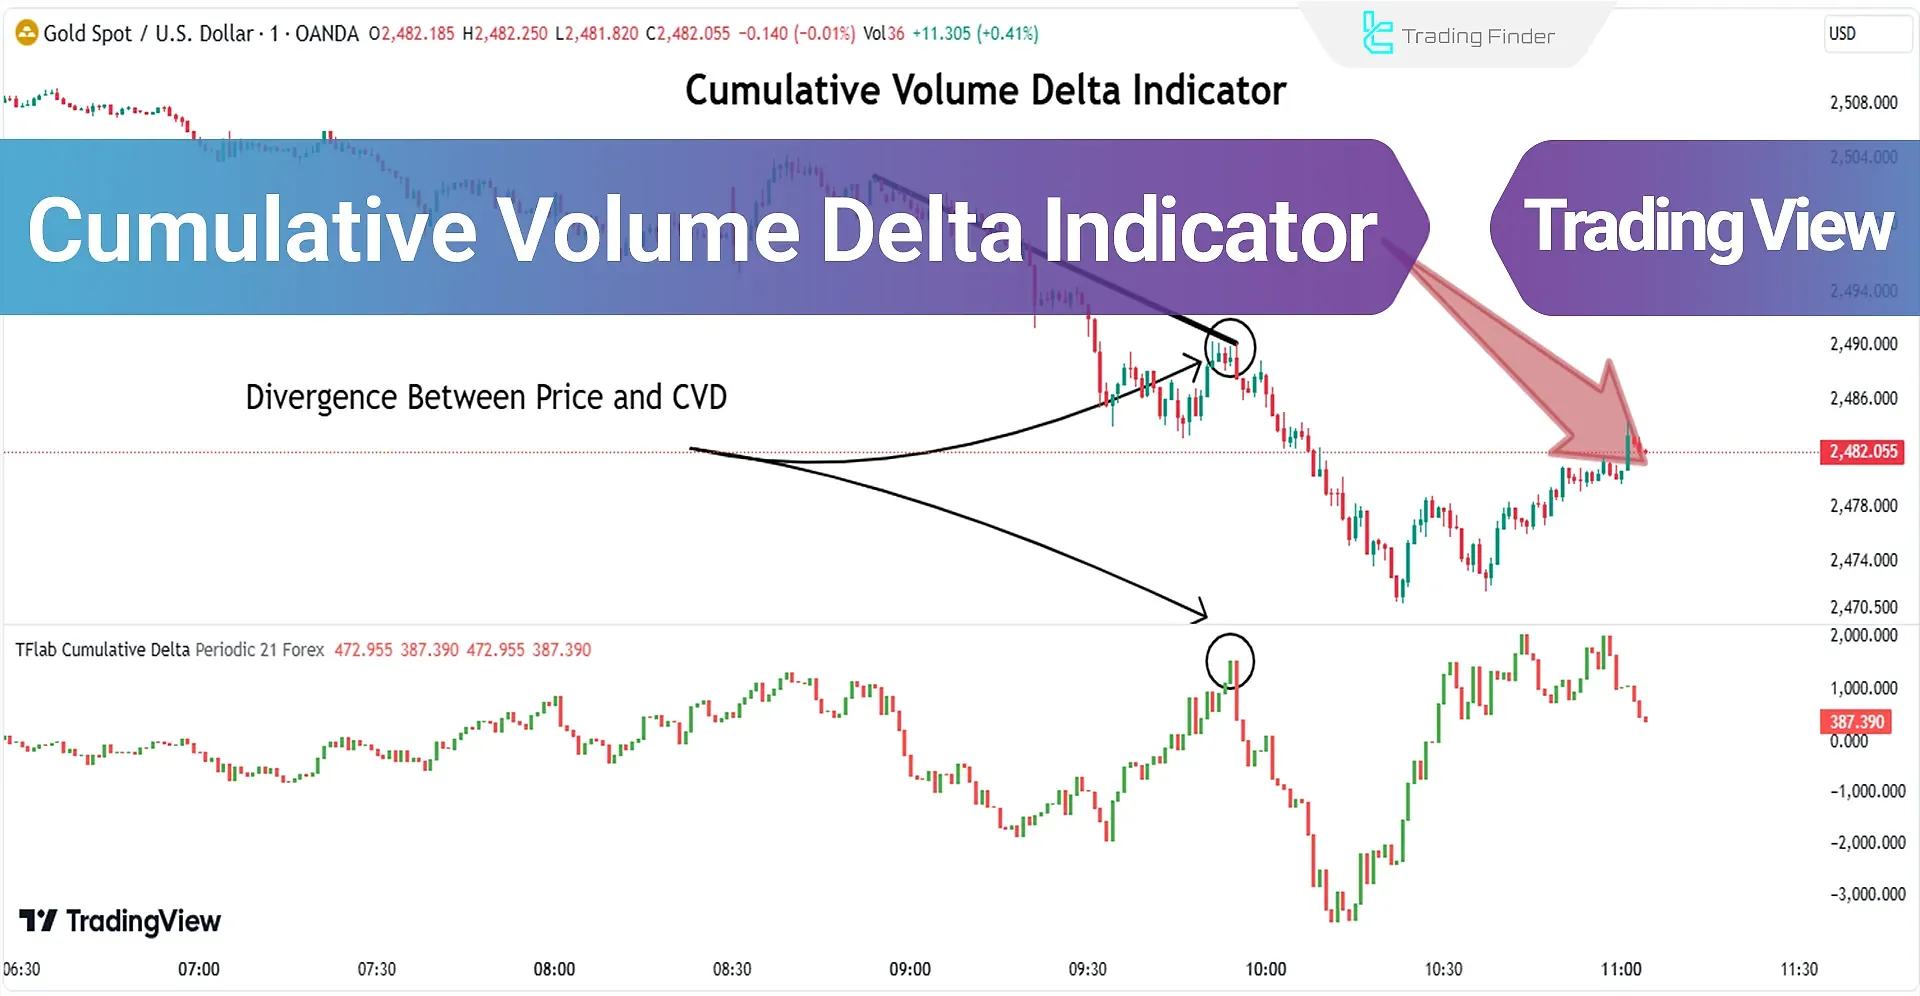
The Cumulative Volume Delta (CVD) Indicator is one of the TradingView indicators that represents the difference between buying and selling pressure calculated over different timeframes.
A positive delta indicates higher buying volume than selling, while a negative delta indicates higher selling volume than buying.
The CVD indicator shows an uptrend with an increasing value and positive slope and a downtrend with a decreasing value and negative slope.

Additionally, divergences between the price and the indicator can be used to identify the future trend direction accurately.
Indicator Table
Indicator Categories: | Volume Tradingview Indicators Oscillators Tradingview Indicators Volatility Tradingview Indicators |
Platforms: | Trading View Indicators |
Trading Skills: | Intermediate |
Indicator Types: | Reversal Tradingview Indicators |
Timeframe: | Multi-Timeframe Tradingview Indicators |
Trading Style: | Intraday Tradingview Indicators |
Trading Instruments: | TradingView Indicators in the Forex Market Cryptocurrency Tradingview Indicators Stock Tradingview Indicators |
Overview
The CVD Indicator is essential for traders who trade toward the market's main trend. The divergence between CVD and the trend price chart can be a strong signal for potential market reversals.
This Trading tool calculates the ongoing buy and sell volume, can estimate the increase or decrease in volume in the prevailing trend, and can predict future price trends.
Uptrend Conditions
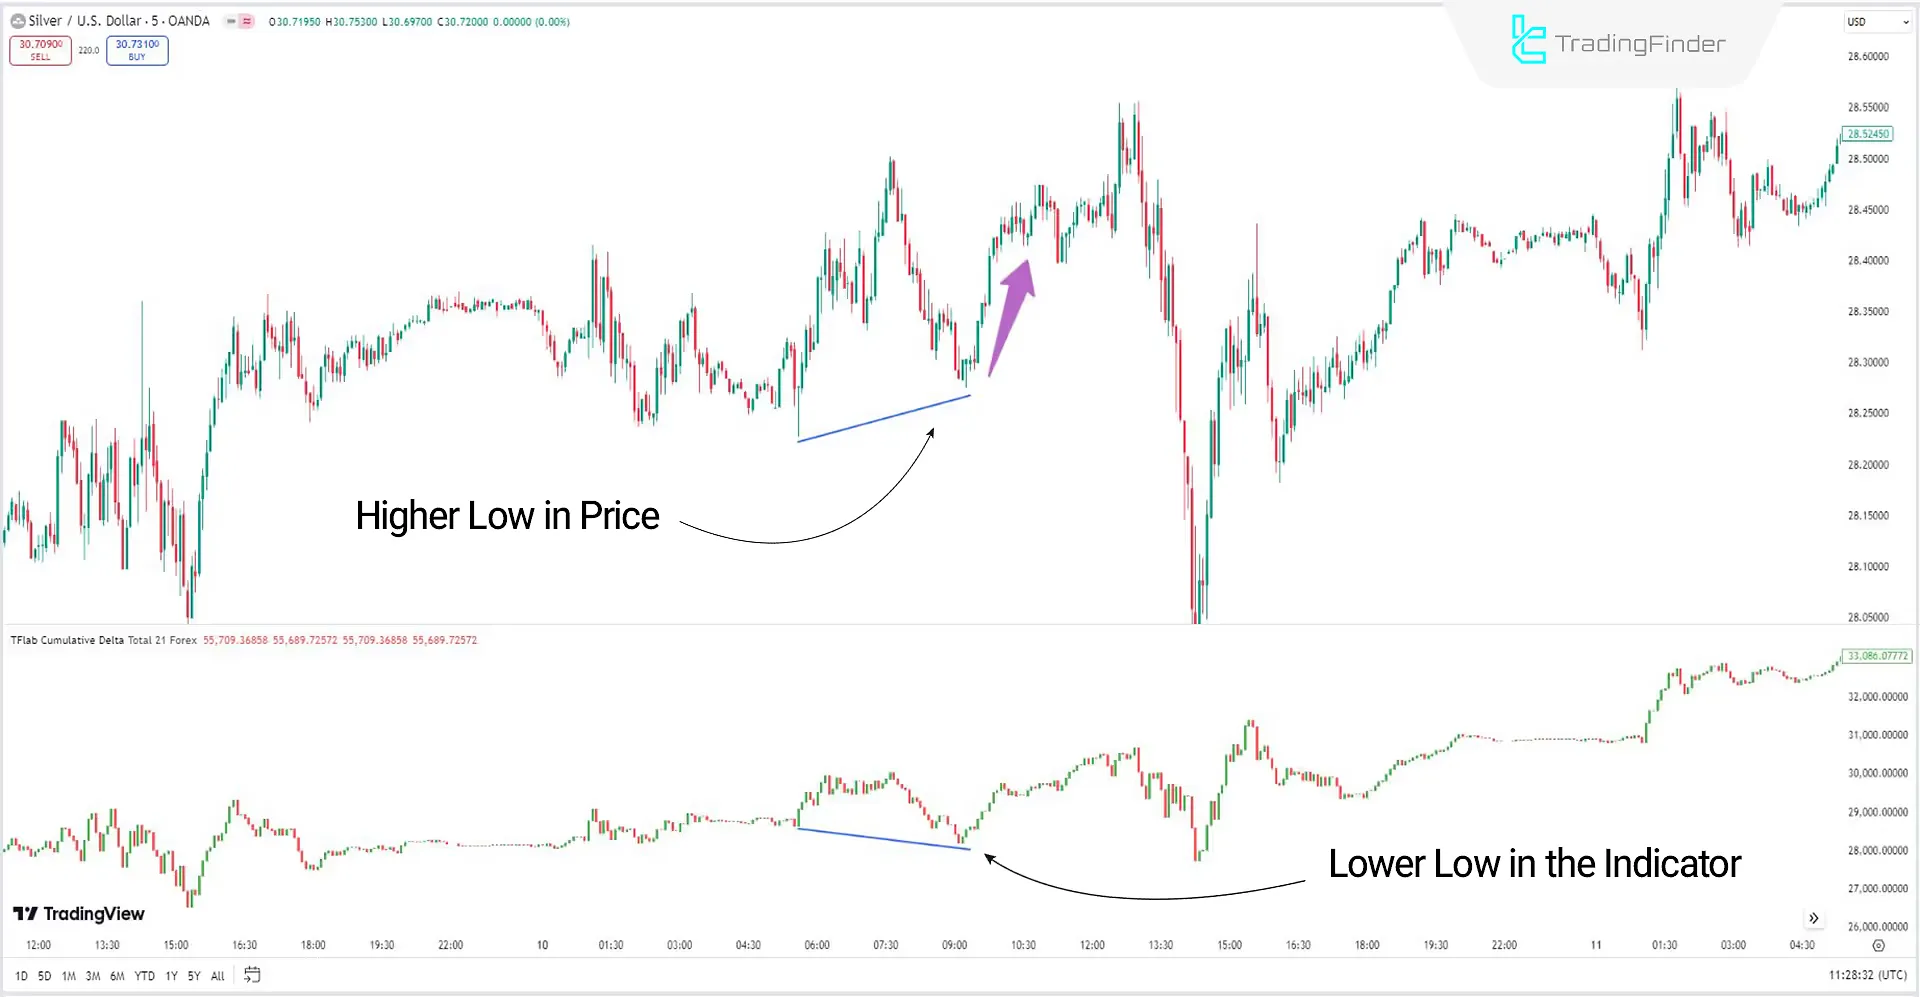
The image below shows the silver price chart in a 5-minute timeframe. The price has created a higher low compared to its previous low, while the indicator has registered a lower valley or low than its previous low.
In this condition, a Bullish Divergence between the price and the Cumulative Volume Delta indicator is created, which could signal a return to an uptrend.

Downtrend Conditions
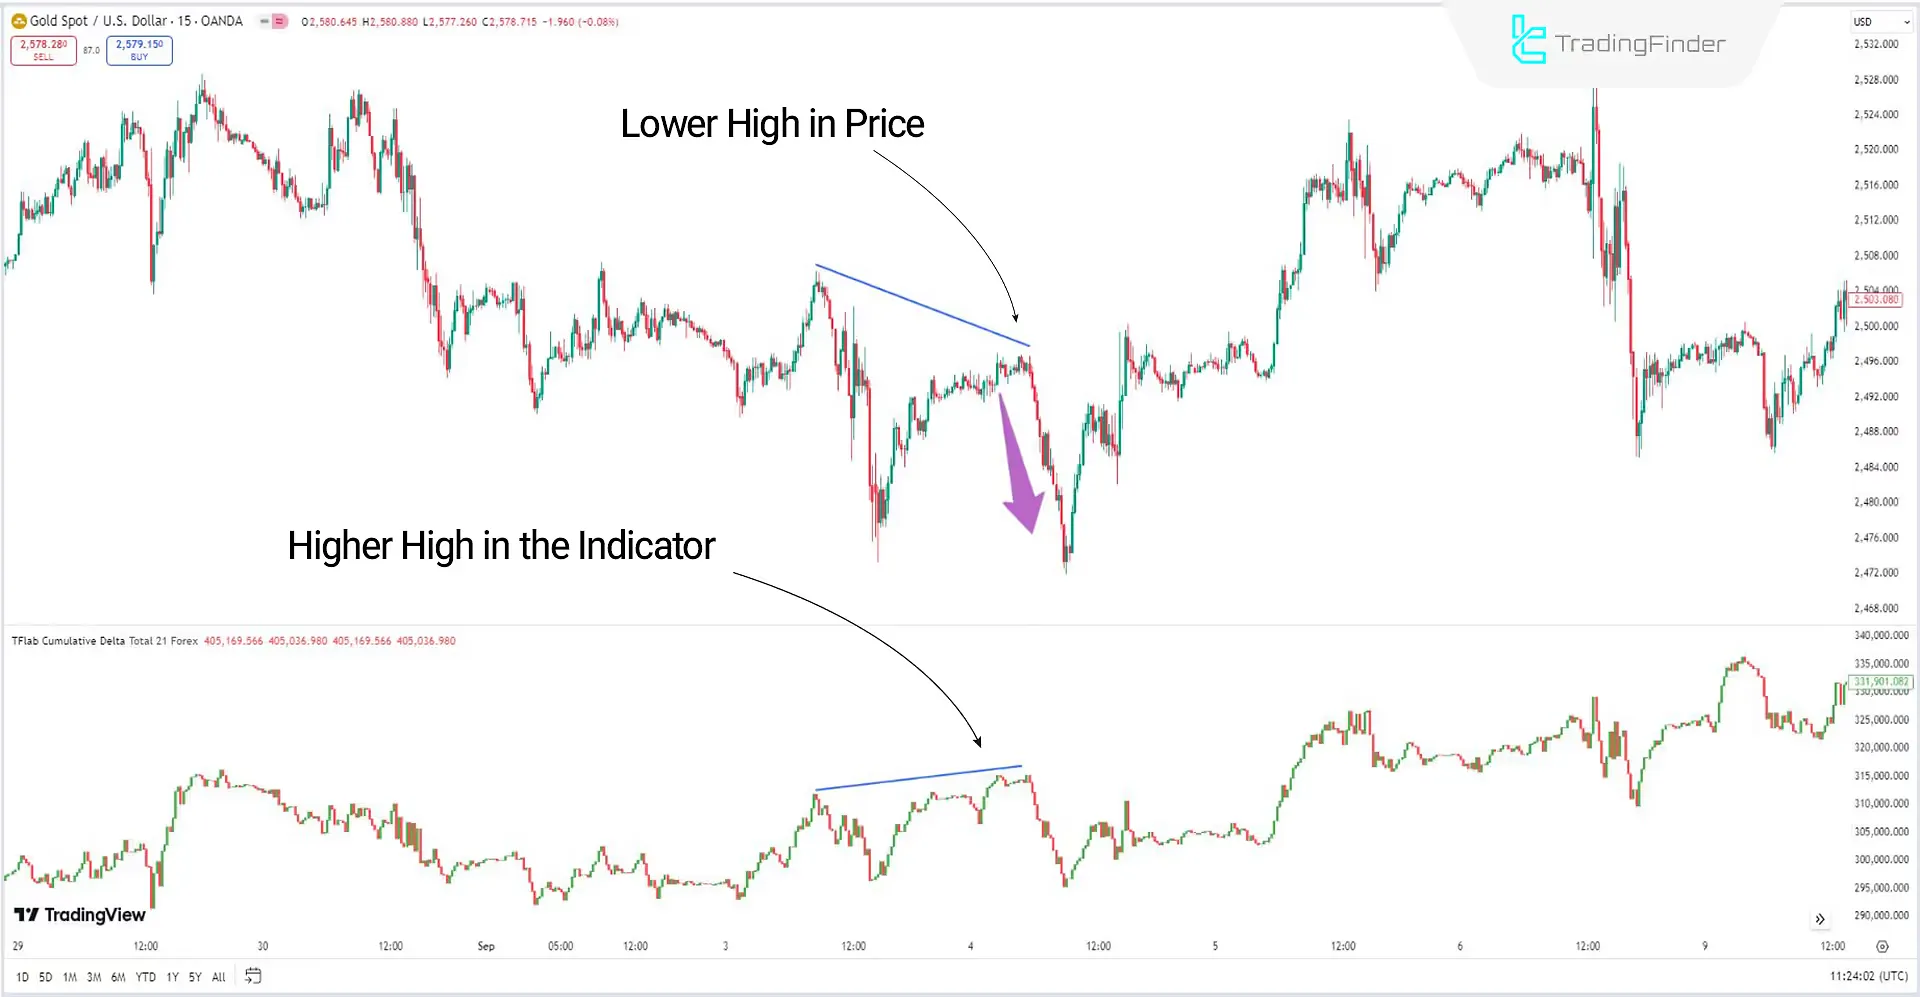
The image below shows the gold price chart in a 15-minute timeframe. The price has created a lower high compared to its previous high, while the indicator has registered a higher peak or high than its previous high.
In this condition, a Bearish Divergence between the price and the Cumulative Volume Delta indicator is created, which could signal a return to a downtrend.

Indicator Settings

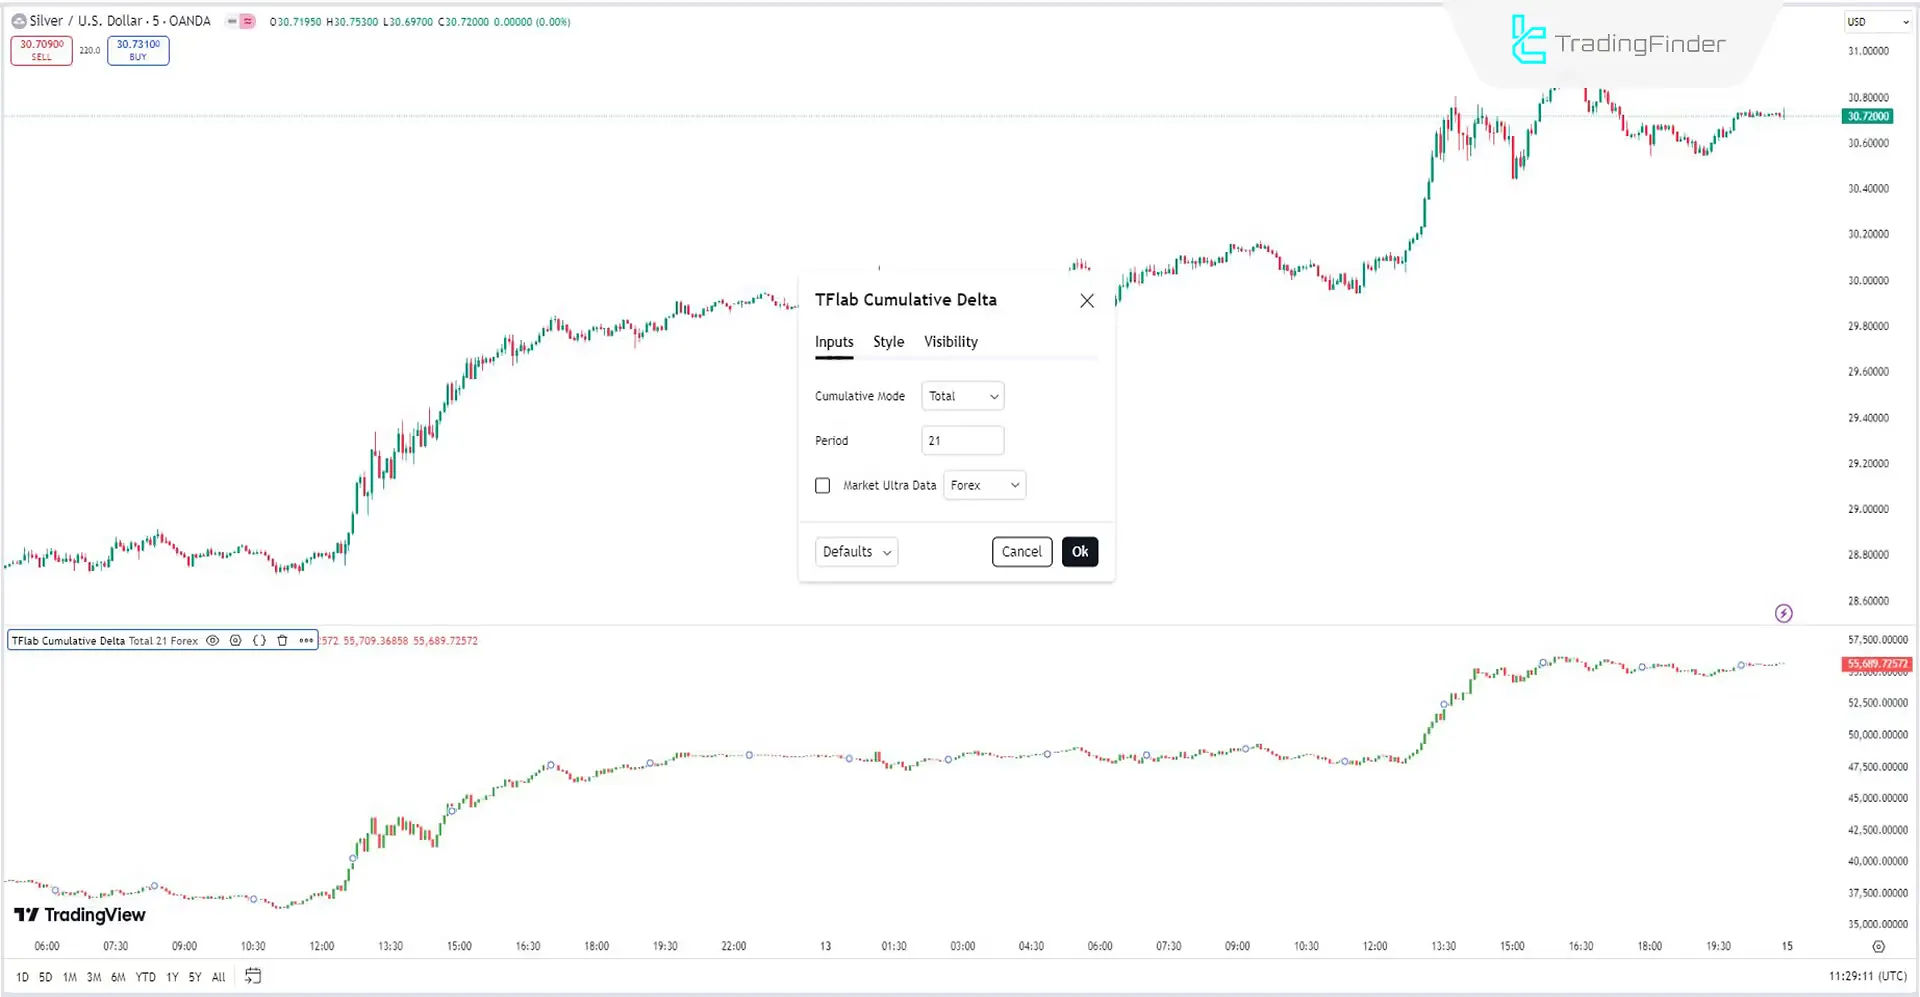
- Cumulative Mode: This indicator has three modes, with the default being Total, which accumulates volume from the start to the end;
- Period: The default period of the indicator is 21.
Description: In Periodic mode, the indicator accumulates volume periodically, while in EMA mode, it calculates the moving average of the volume.
Conclusion
This Trading View Volatility indicator is a powerful analytical tool in technical analysis. By accumulating and combining the volume delta for each candlestick, it can calculate the buying and selling pressure, as well as the ongoing volume, to predict the future trend.
When the CVD Indicator moves upward with a positive slope, it indicates buying pressure; when it moves downward with a negative slope, it indicates selling pressure. This indicator is more useful in highly volatile markets.
Cumulative Volume Delta CVD TradingView PDF
Cumulative Volume Delta CVD TradingView PDF
Click to download Cumulative Volume Delta CVD TradingView PDFHow does the CVD Indicator work?
The CVD Indicator's predictive power is rooted in its calculation of ongoing buying and selling volumes. By analyzing these volumes, it can forecast the strength and direction of future trends and trend reversals.
In which markets is the Cumulative Volume Delta Indicator applicable?
This indicator applies to all markets, particularly in highly volatile markets with high buying and selling volumes.
hi can you do it on metatrader 5 thank you very much
Hi. we have it on MT4/5


