


TradingView
MetaTrader4
MetaTrader5
The Liquidity Finder Indicator highlights zones where Stop Losses are likely concentrated within specific areas.Based on ICT strategy andSMC (Smart Money Concepts) trading strategies, traders place stop loss levels to provide the liquidity needed to execute the orders of institutional and large scale traders.
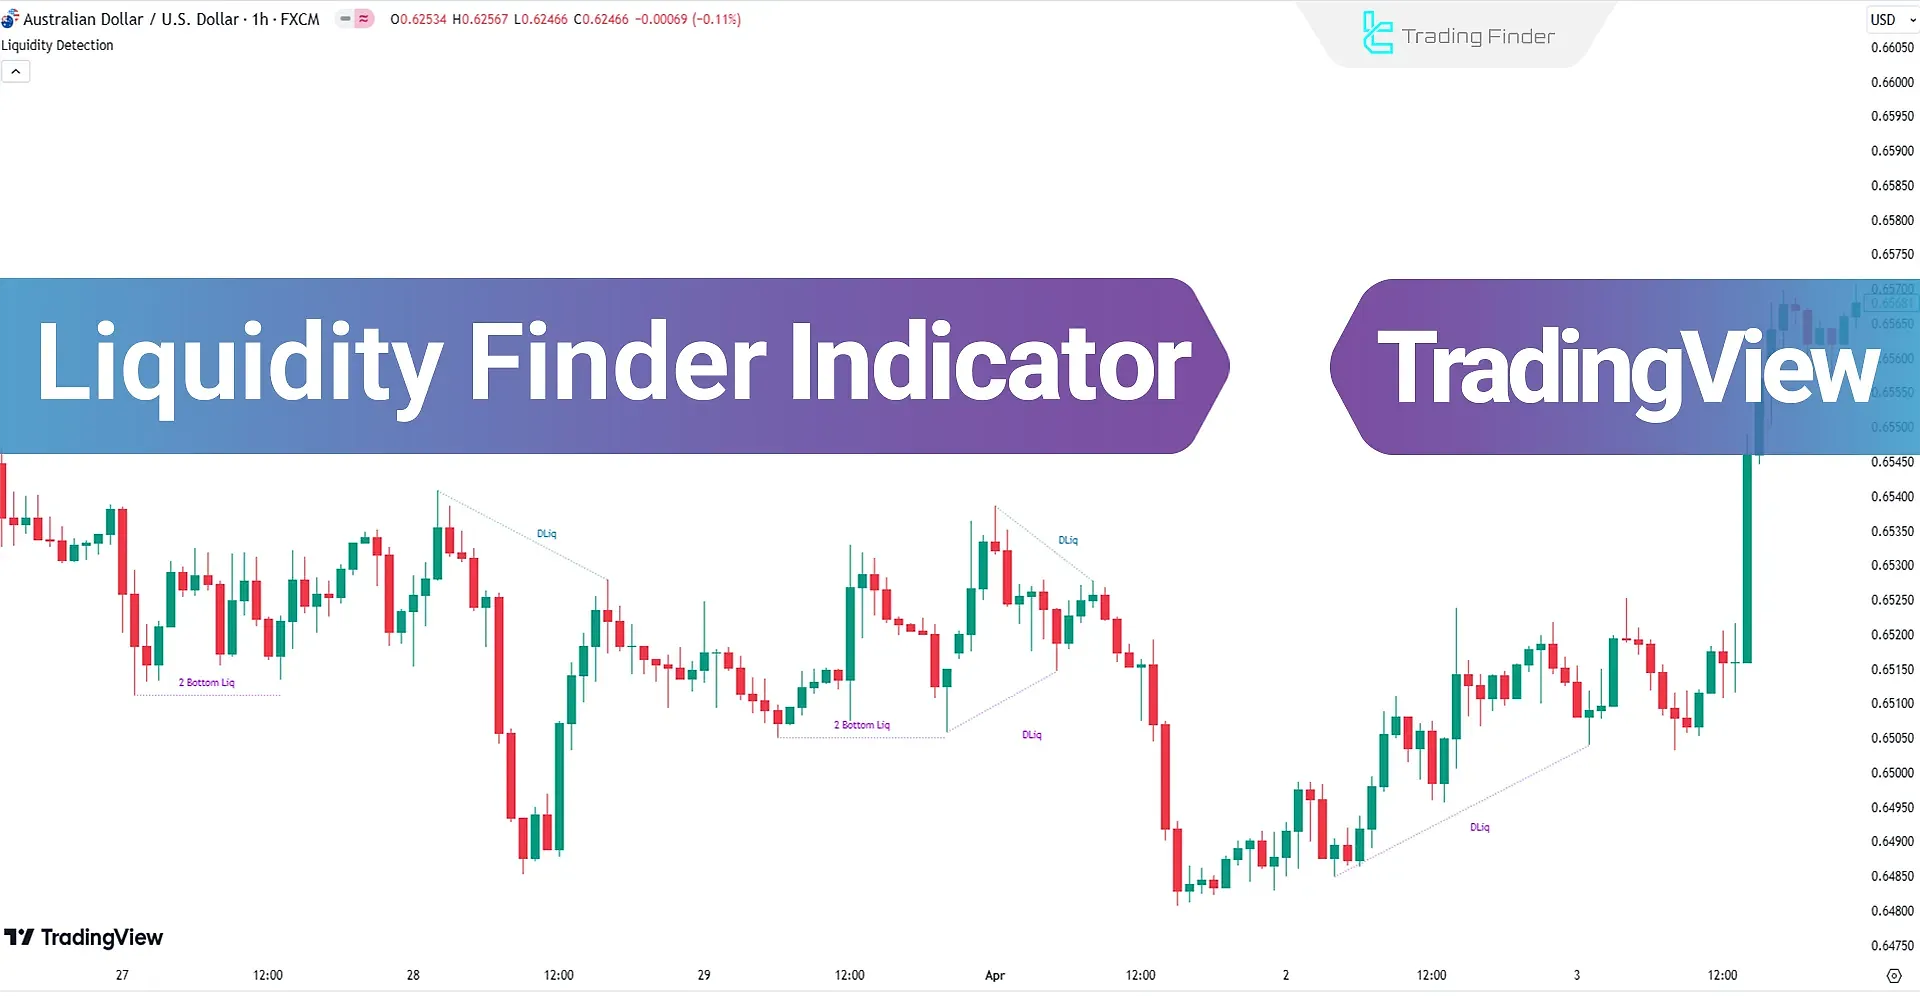
This TradingView liquidity indicator represents such zones using dashed lines on the chart.
Specification Table of Liquidity Finder Indicator
Key features of the indicator for quick understanding are presented in the table below:
Indicator Categories: | ICT Tradingview Indicators Smart Money Tradingview Indicators Liquidity Tradingview Indicators |
Platforms: | Trading View Indicators |
Trading Skills: | Advanced |
Indicator Types: | Reversal Tradingview Indicators |
Timeframe: | Multi-Timeframe Tradingview Indicators |
Trading Style: | Intraday Tradingview Indicators |
Trading Instruments: | TradingView Indicators in the Forex Market Cryptocurrency Tradingview Indicators Stock Tradingview Indicators Commodity Tradingview Indicators Forward Tradingview Indicators Share Stocks Tradingview Indicators |
Liquidity Finder Indicator at a Glance
Liquidity accumulation zones are usually found below Swing Lows and above Swing Highs, as detailed below:
- Above double top or triple top patterns
- Below double bottom or triple bottom patterns
- Above bearish trend lines
- Below are bullish trend lines
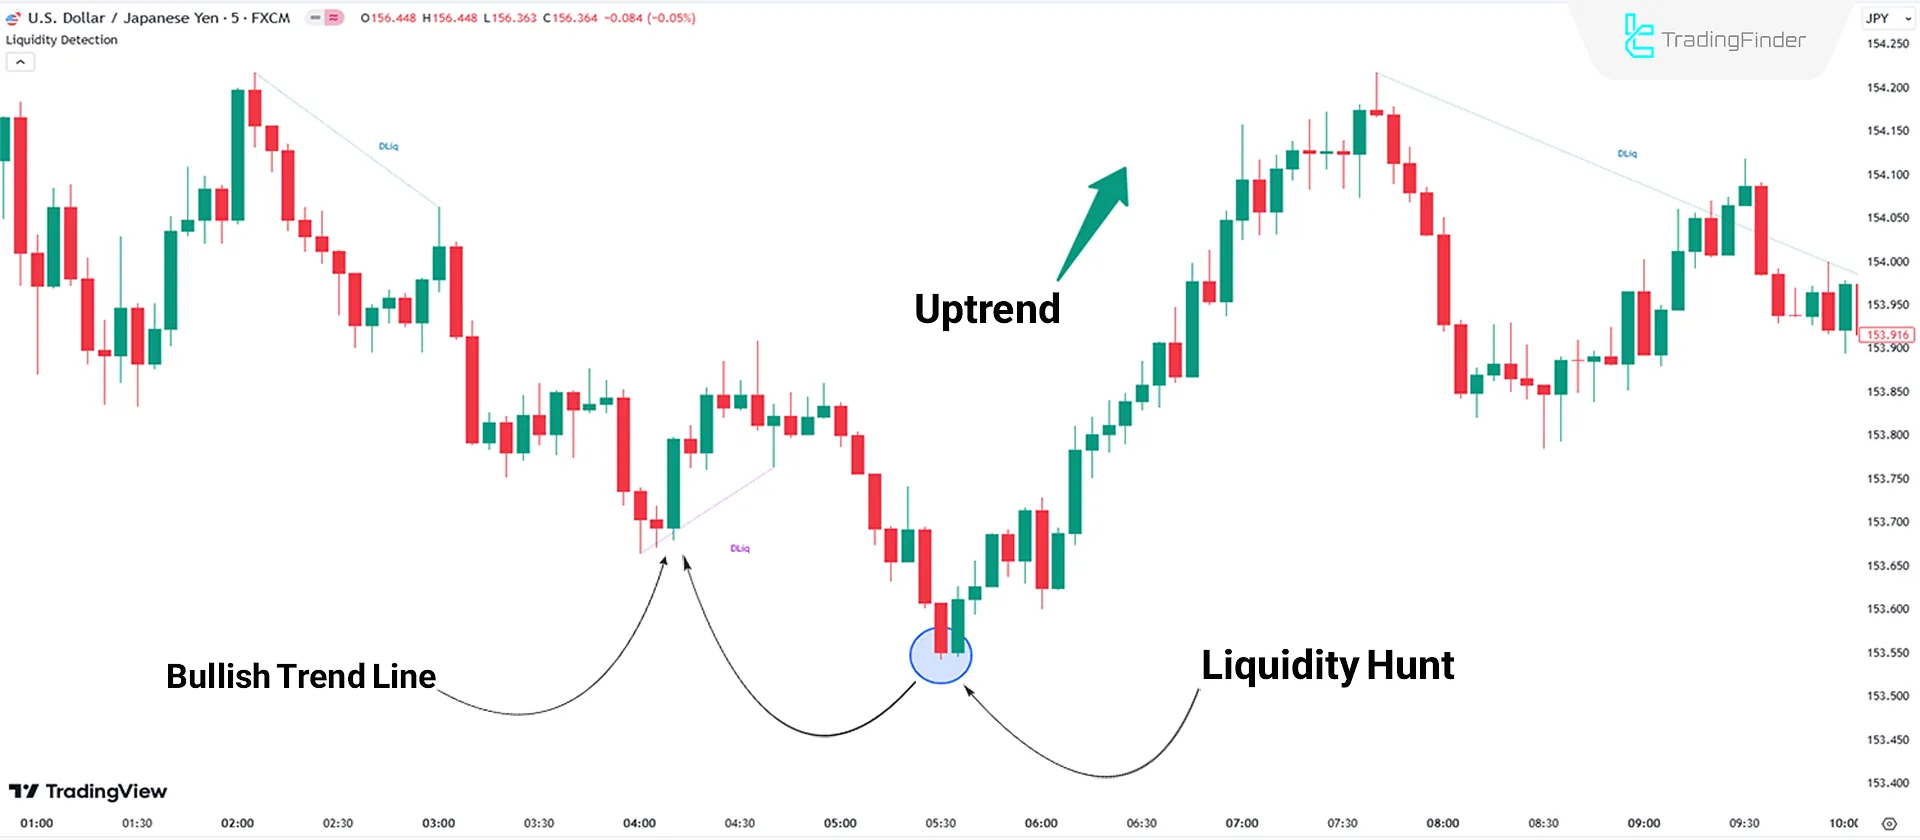
Liquidity Zones in an Uptrend
The chart below (USD/JPY pair) shows that the liquidity zone is drawn based on the bullish trend lines. After price breaches and hunts liquidity, it moves upward, altering the price direction.
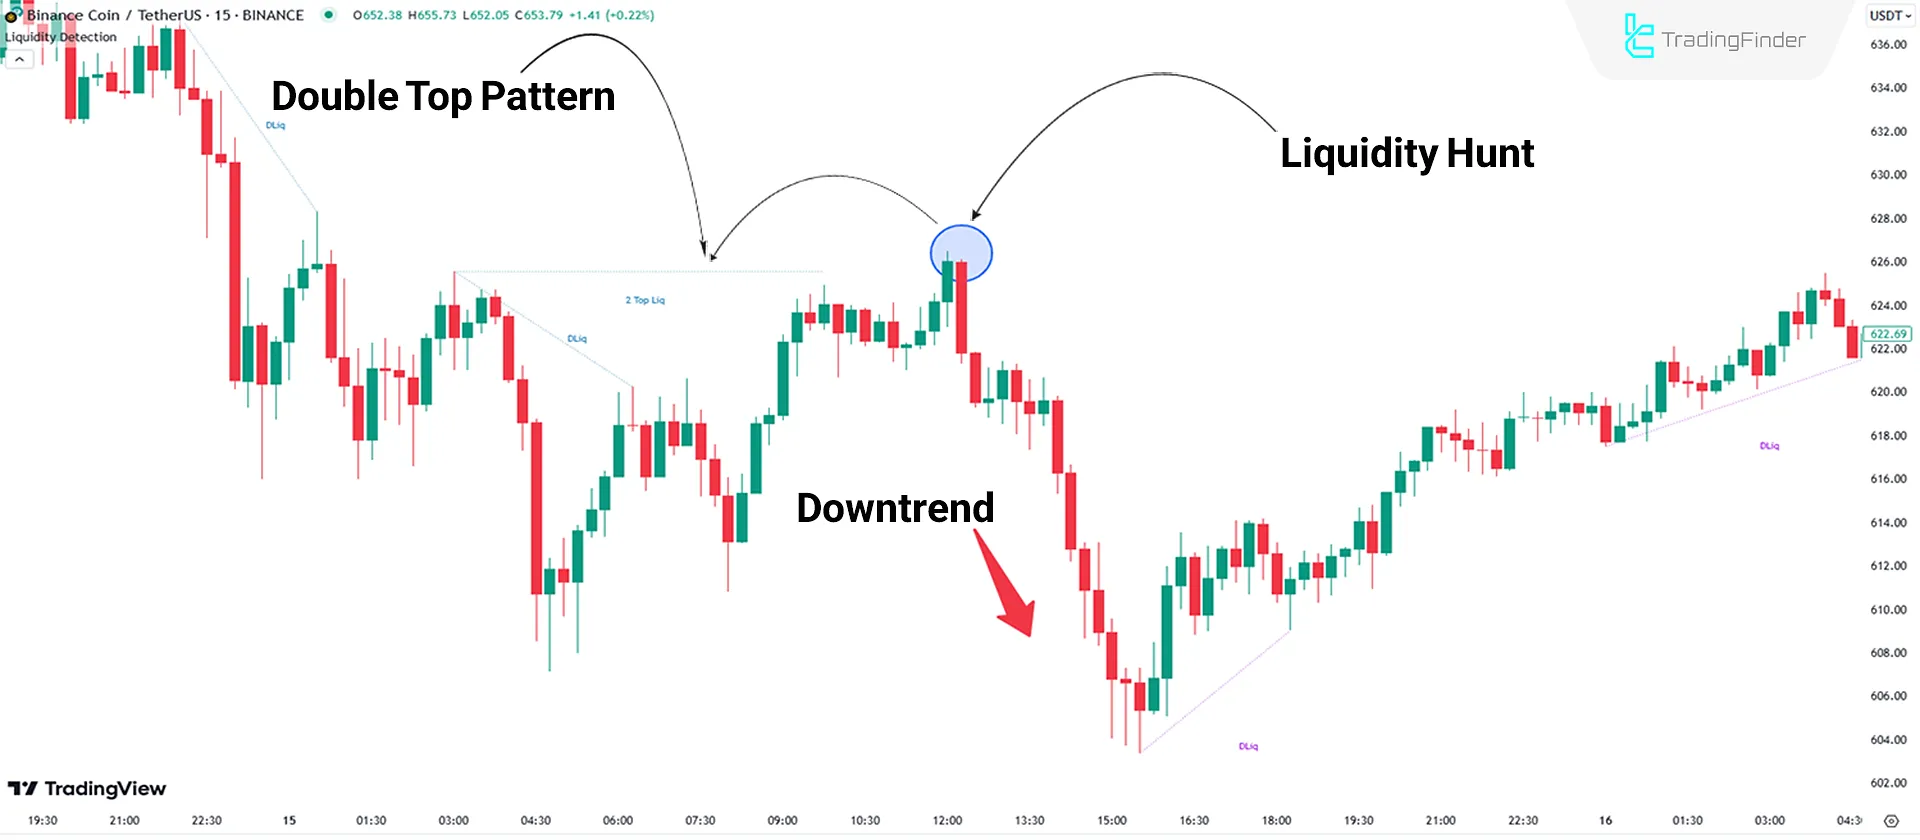
Liquidity Zones in a Downtrend
In Binance Coin's (BNB) 15-minute chart, the indicator highlights a double top liquidity zone using blue dashed lines.
When the price breaches and hunts liquidity(or a Stop Hunt) above the double top pattern, the trend direction changes to bearish.
Indicator Settings
The recommended default settings of the indicator are as shown in the image below:
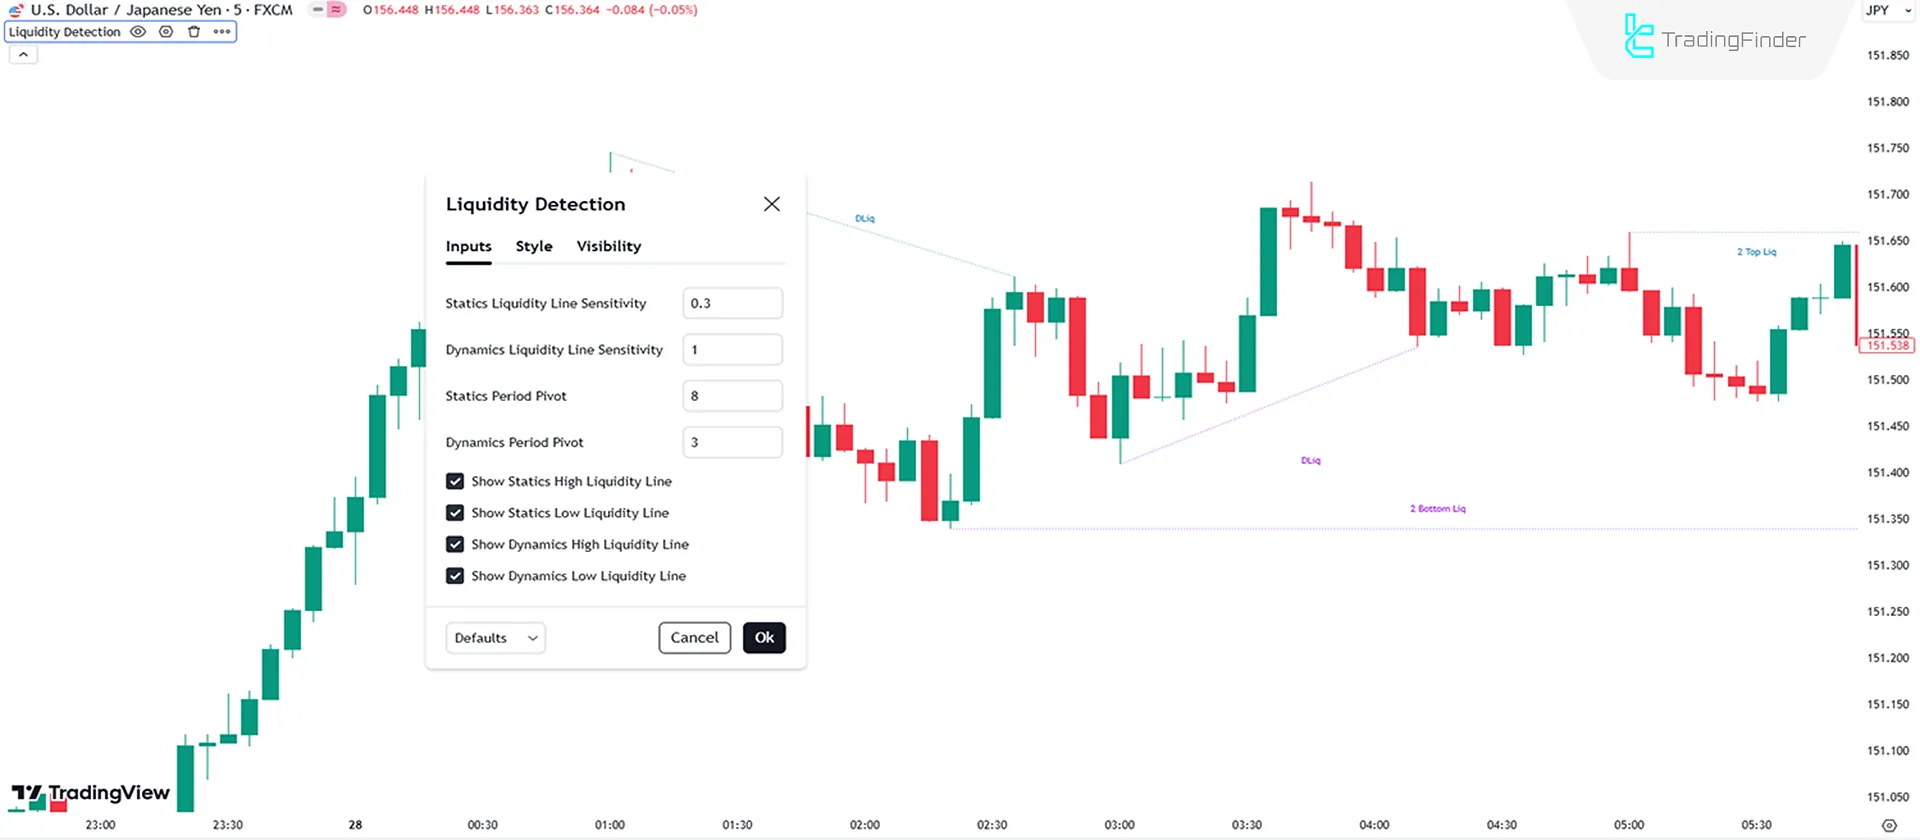
- Statics Liquidity Line Sensitivity: Sensitivity for identifying static liquidity lines set to 0.3;
- Dynamics Liquidity Line Sensitivity: Sensitivity for identifying dynamic liquidity lines set to 1;
- Statics Period Pivot: Pivot period for static lines set to 8;
- Dynamics Period Pivot: Pivot period for dynamic lines set to 3;
- Show Statics High Liquidity Line: Display static high liquidity lines;
- Show Statics Low Liquidity Line: Display static low liquidity lines;
- Show Dynamics High Liquidity Line: Display dynamic high liquidity lines;
- Show Dynamics Low Liquidity Line: Display dynamic low liquidity lines.
Conclusion
The Liquidity Finder Indicator identifies key liquidity zones on the chart. These zones include double top patterns, double bottom patterns, bearish trend lines, and bullish trend lines, represented with colored dashed lines on the chart.
Thus, these zones' price breaches andstop loss hunts can trigger trend reversals. This trading tool is also categorized under TradingView ICT indicators, making it a part of this analysis system.
Liquidity Finder TradingView PDF
Liquidity Finder TradingView PDF
Click to download Liquidity Finder TradingView PDFDoes this indicator work on daily timeframes?
Yes, the Liquidity Finder Indicator supports multi-timeframe functionality and works on weekly and monthly timeframes.
Does this indicator detect liquidity hunts?
No, this indicator only highlights liquidity zones on the chart.


