TradingView
MetaTrader4
MetaTrader5
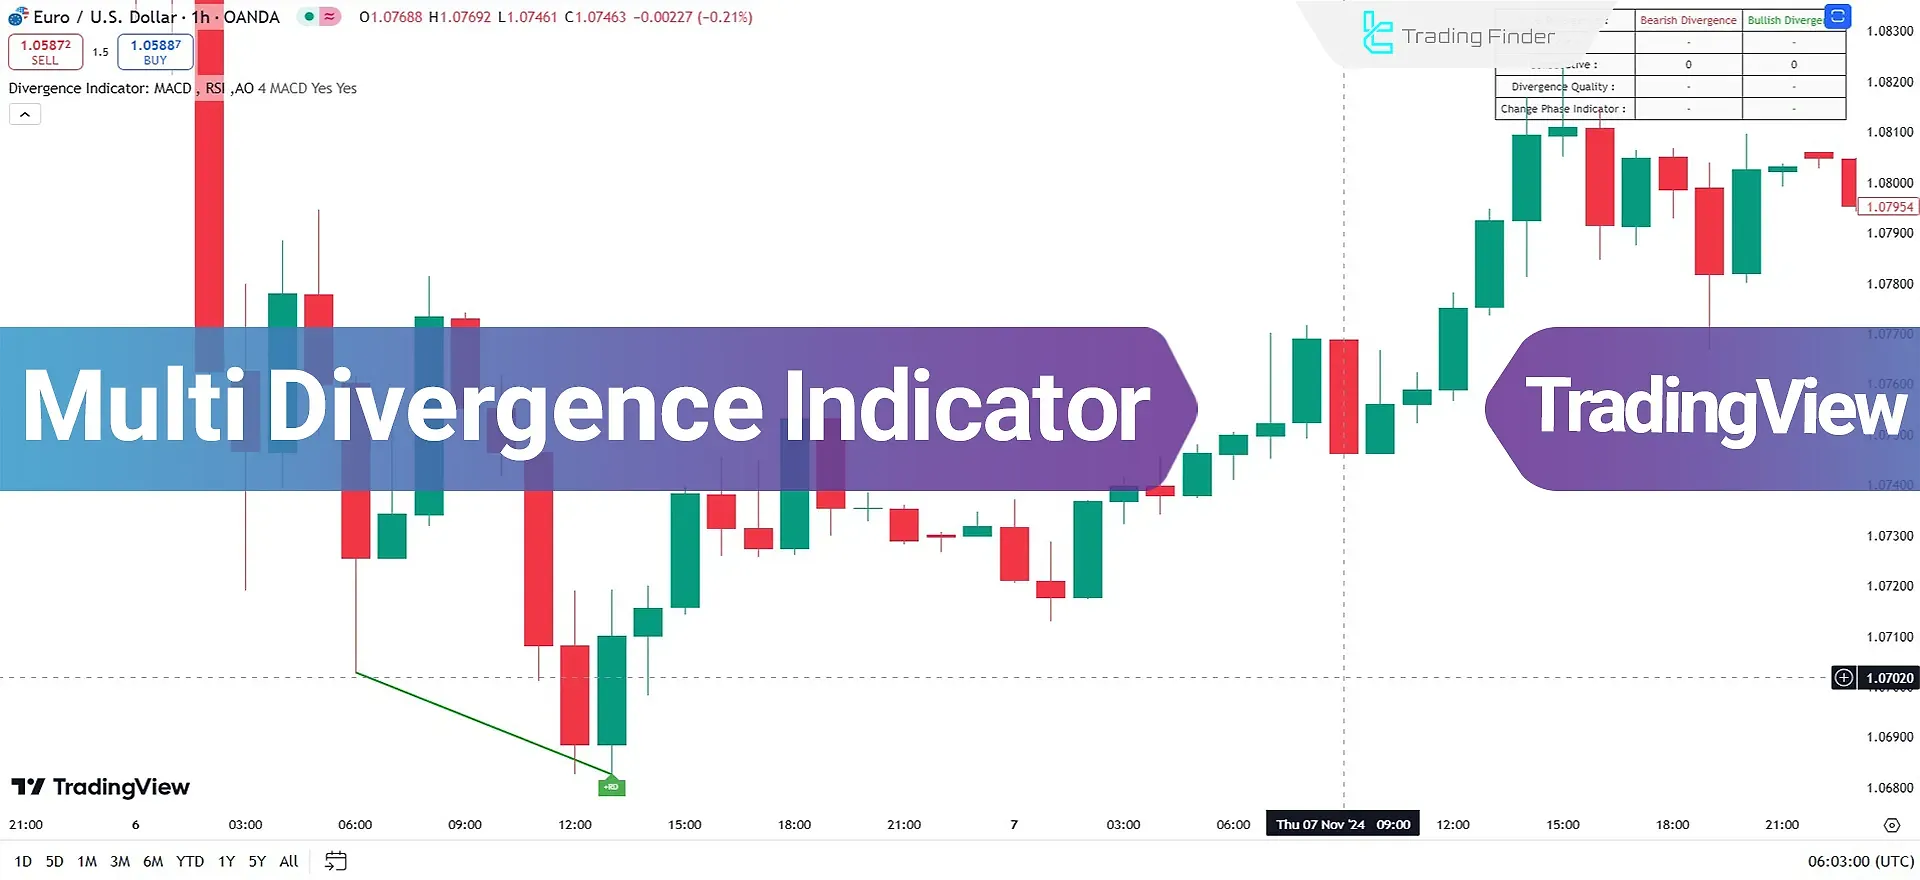
Divergence Multi Indicator is a TradingView trading tool that helps identify divergences between price and various indicators such as AO, MACD, and RSI.
This phenomenon may indicate potential trend reversals in price movements.

The Multi Divergence Indicator (Divergence Indicator Multi) is a practical tool for identifying divergences between price and various indicators such as AO, MACD, and RSI.
Specifications of the Multi Divergence Indicator
Indicator Categories: | Volatility Tradingview Indicators Currency Strength Tradingview Indicators Trading Assist Tradingview Indicators |
Platforms: | Trading View Indicators |
Trading Skills: | Elementary |
Indicator Types: | Leading Tradingview Indicators |
Timeframe: | Multi-Timeframe Tradingview Indicators |
Trading Style: | Intraday Tradingview Indicators |
Trading Instruments: | TradingView Indicators in the Forex Market Cryptocurrency Tradingview Indicators Stock Tradingview Indicators Share Stocks Tradingview Indicators |
Indicator Overview
This indicator allows the identification of divergences using popular tools like AO, MACD, and RSI. By adjusting the fractal period and selecting the divergence detection method, traders can identify and analyze various patterns. Positive divergences are marked in green, and negative divergences are marked in red.
Indicator in an Uptrend
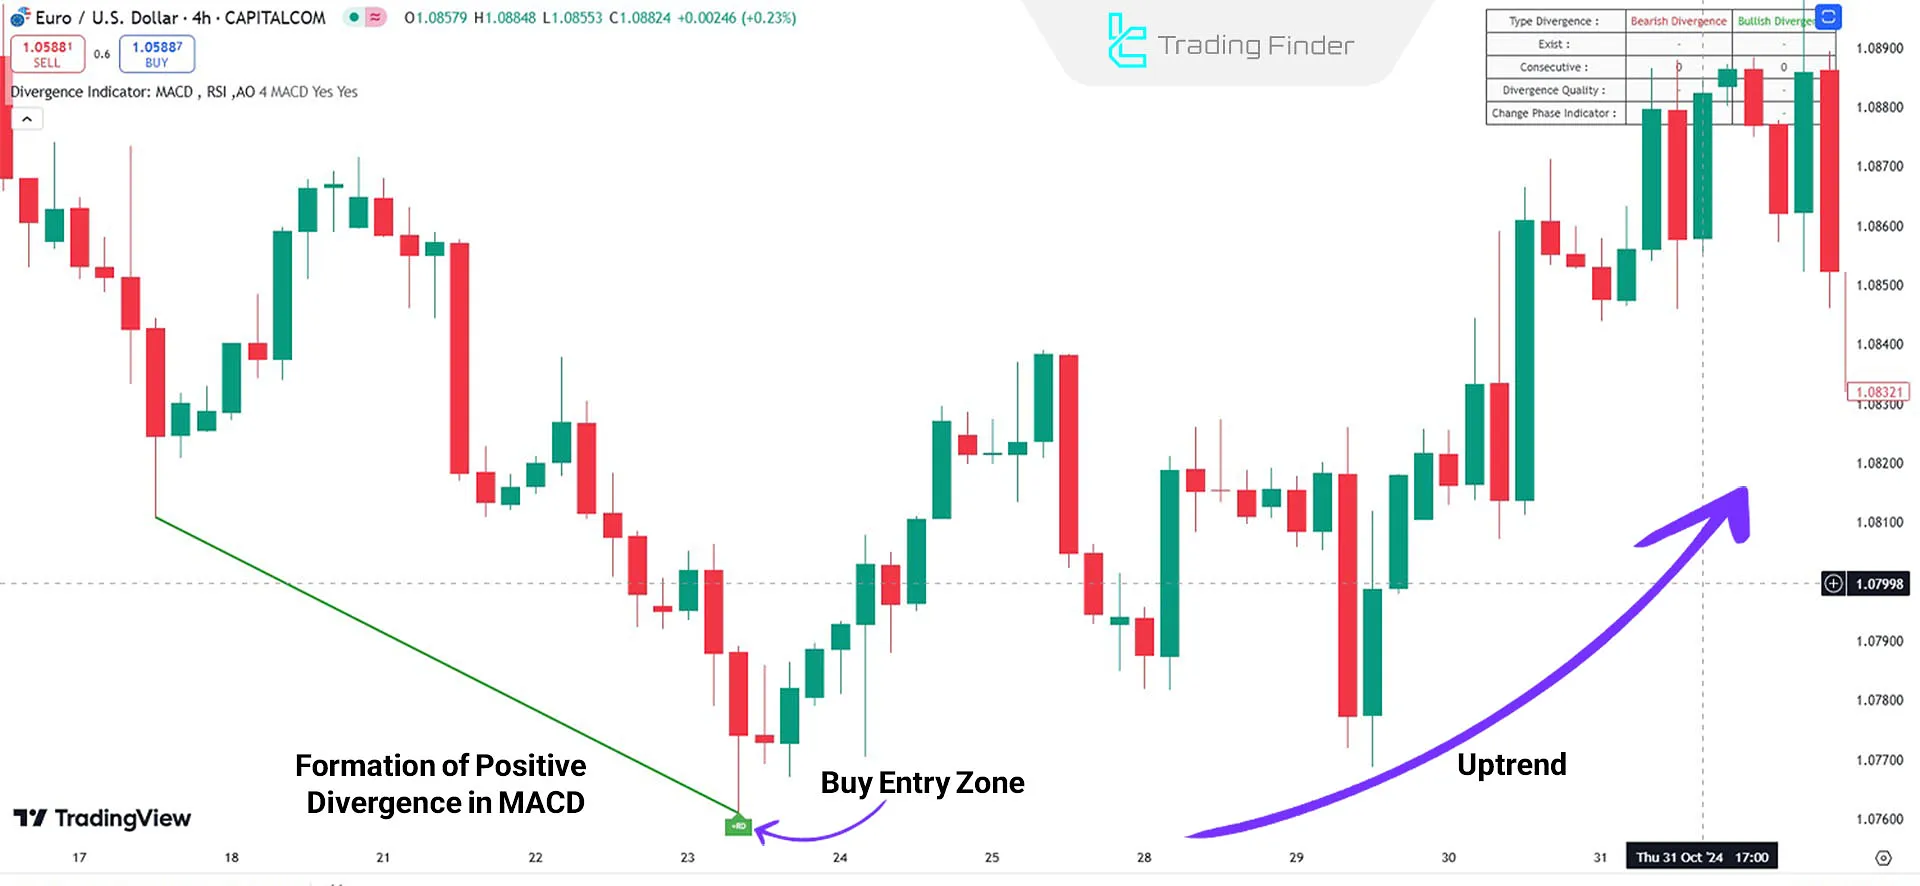
The price forms a new low on the EUR/USD chart in the 4-hour timeframe, while the selected indicator (default MACD) shows a higher low.
This divergence indicates reduced selling pressure and increased buying pressure, potentially reversing the trend and pushing the price upward.

Indicator in a Downtrend
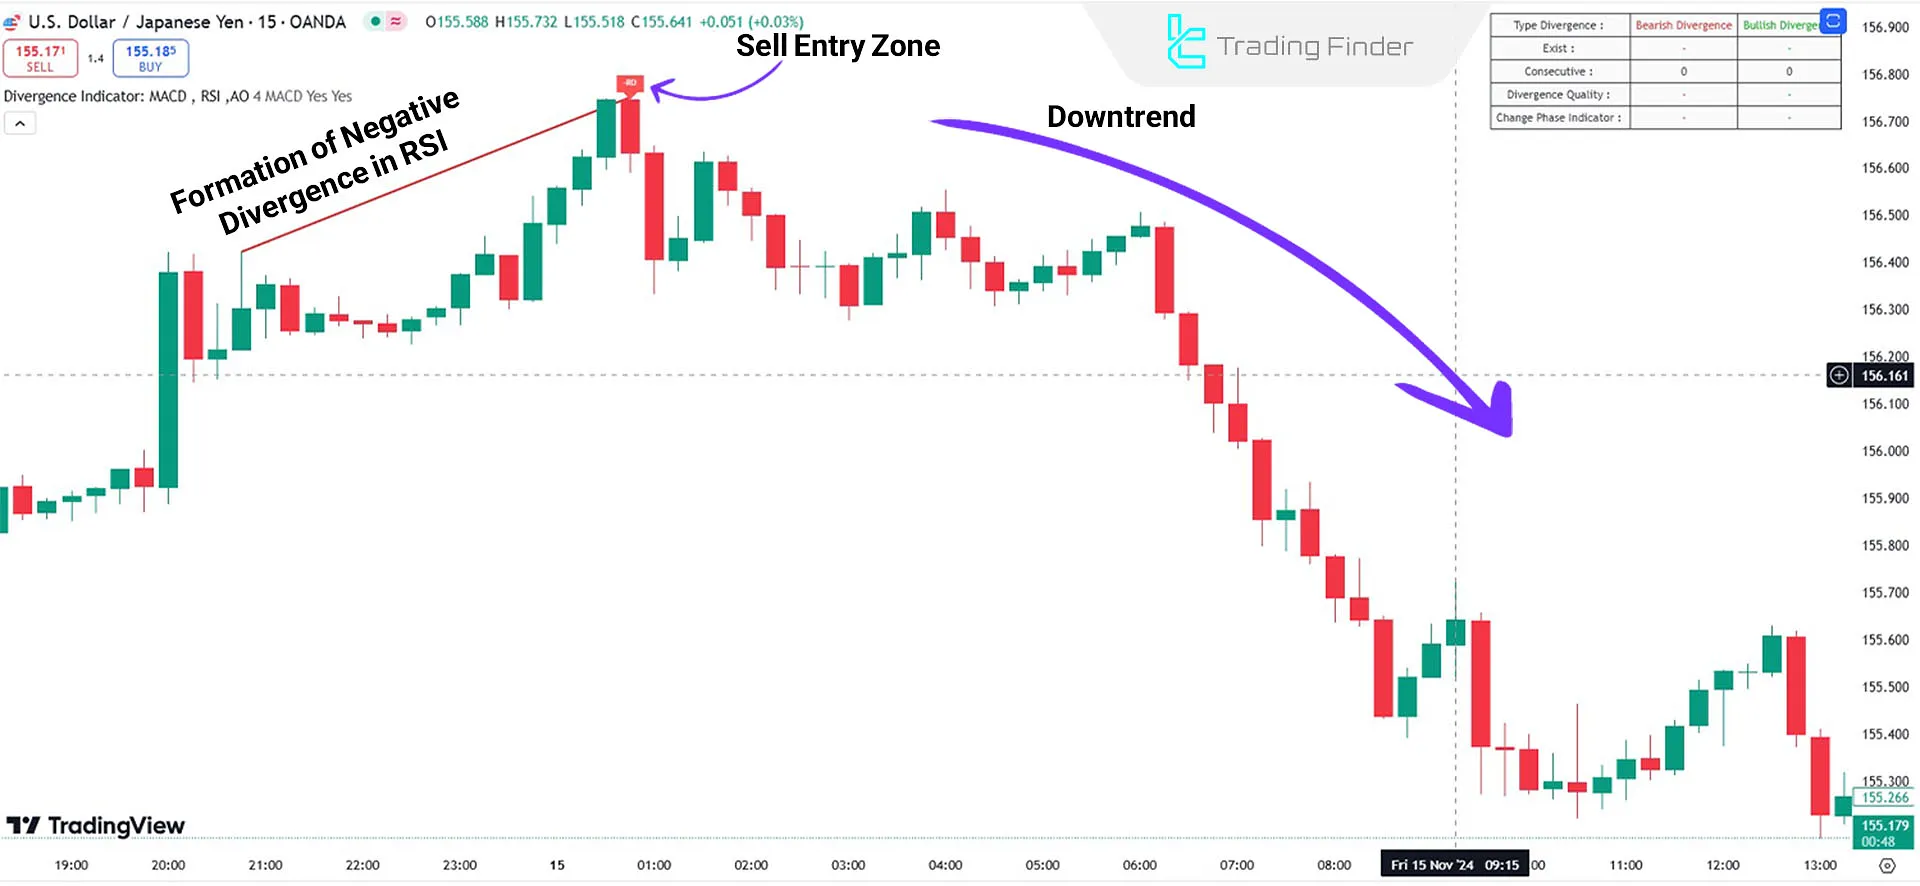
On the USD/JPY chart in the 15-minute timeframe, if the price forms a higher high but the selected indicator (RSI) registers a lower high, this is a negative divergence.
This scenario indicates decreasing buying pressure and gradually increasing selling pressure in the market, suggesting a possible return to a downward trend.

Indicator Settings

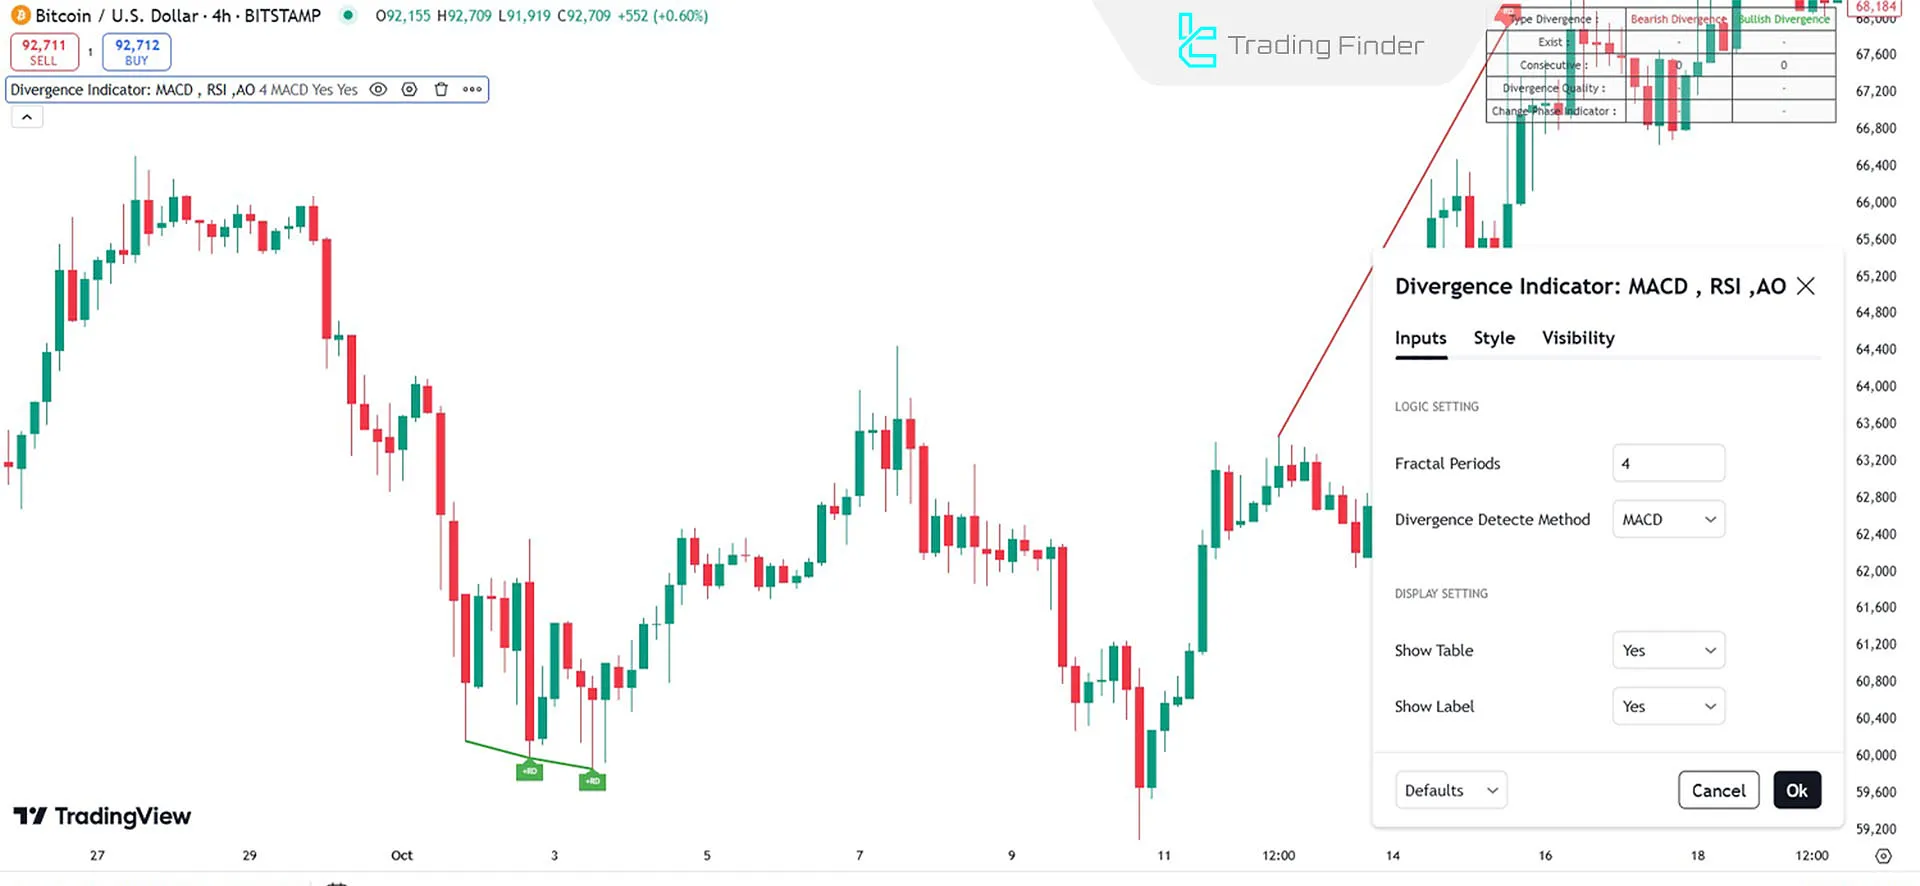
- Fractal Periods: Defines the number of periods for identifying fractal points on the chart;
- Divergence Detection Method: Select the indicator for detecting divergences (default: MACD);
- Show Table: Displays a divergence data table on the chart;
- Show Label: Displays divergence-related labels on the chart.
Conclusion
This volatile indicator combines multiple tools such as MACD, AO, and RSI, making the divergence identification process simpler and more accurate.
With this tool, traders can automatically and effortlessly identify divergences without complex manual analysis, helping them find suitable trading opportunities.
Multi Divergence TradingView PDF
Multi Divergence TradingView PDF
Click to download Multi Divergence TradingView PDFWhat is the Multi Divergence Indicator?
This indicator assists traders in identifying divergences between prices and popular indicators like MACD, AO, and RSI.
What types of divergences can be identified with this tool?
This indicator identifies positive and negative divergences, which may signal potential market trend changes.


