


The Nen Star Harmonic Pattern Indicator is recognized as an advanced reversal pattern among TradingView indicators, designed to identify market trend changes and predict key price reversal points (PRZ - Potential Reversal Zones).
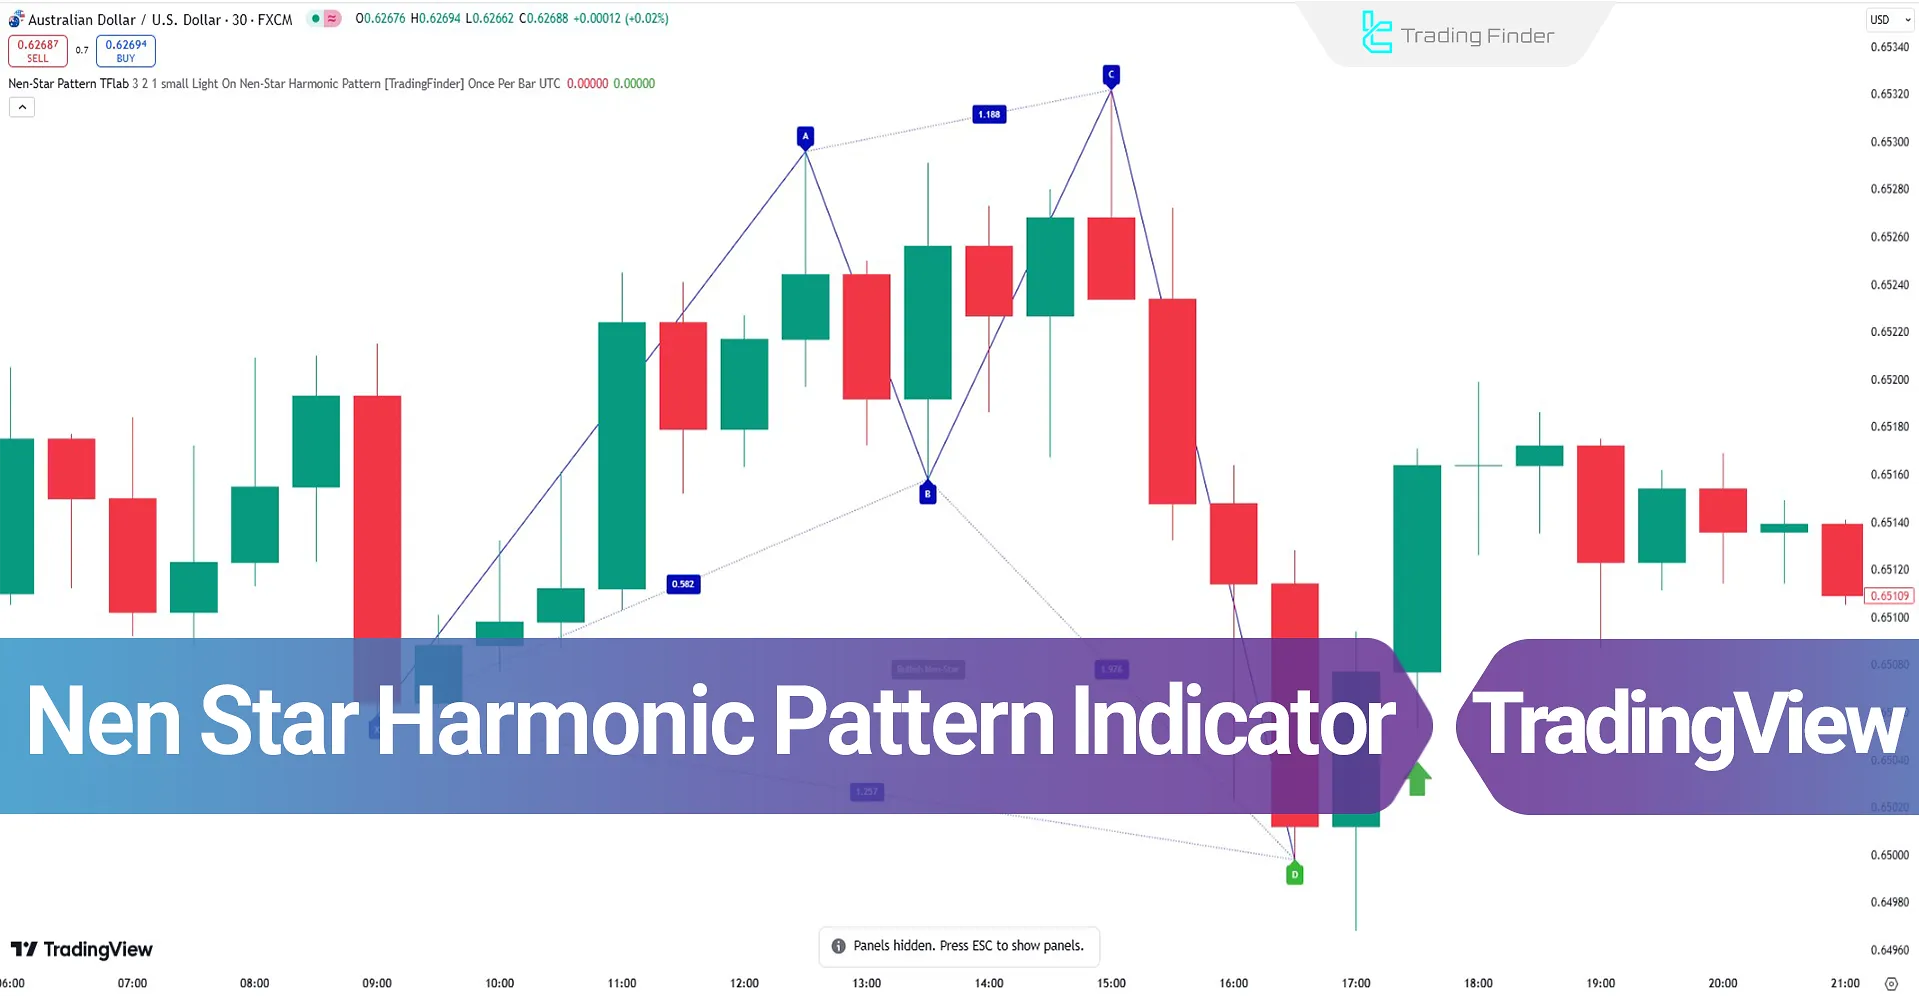
Using Fibonacci ratios and specific price structures, the Nen Star harmonic pattern determines potential reversal areas, where price direction is likely to change.
Nen Star Harmonic Pattern Indicator Table
The table below summarizes the key features of the Nen Star Harmonic Indicator:
Indicator Categories: | Signal & Forecast Tradingview Indicators Harmonic Tradingview Indicators Chart & Classic Tradingview indicators |
Platforms: | Trading View Indicators |
Trading Skills: | Elementary |
Indicator Types: | Reversal Tradingview Indicators |
Timeframe: | Multi-Timeframe Tradingview Indicators |
Trading Style: | Intraday Tradingview Indicators |
Trading Instruments: | TradingView Indicators in the Forex Market Cryptocurrency Tradingview Indicators Stock Tradingview Indicators Forward Tradingview Indicators Share Stocks Tradingview Indicators |
Indicator Overview
The Nen Star Harmonic Pattern Indicator is structured based on five key points: X, A, B, C, and D.
- Point X represents the start of the price movement, while Point A marks the end of the initial move
- Point B is the first price retracement, located within the Fibonacci 0.382 to 0.786 range
- Point C is the second retracement, positioned within the 1.13 to 1.414 Fibonacci range of movement AB
- Point D is the most critical point, acting as the Potential Reversal Zone (PRZ)
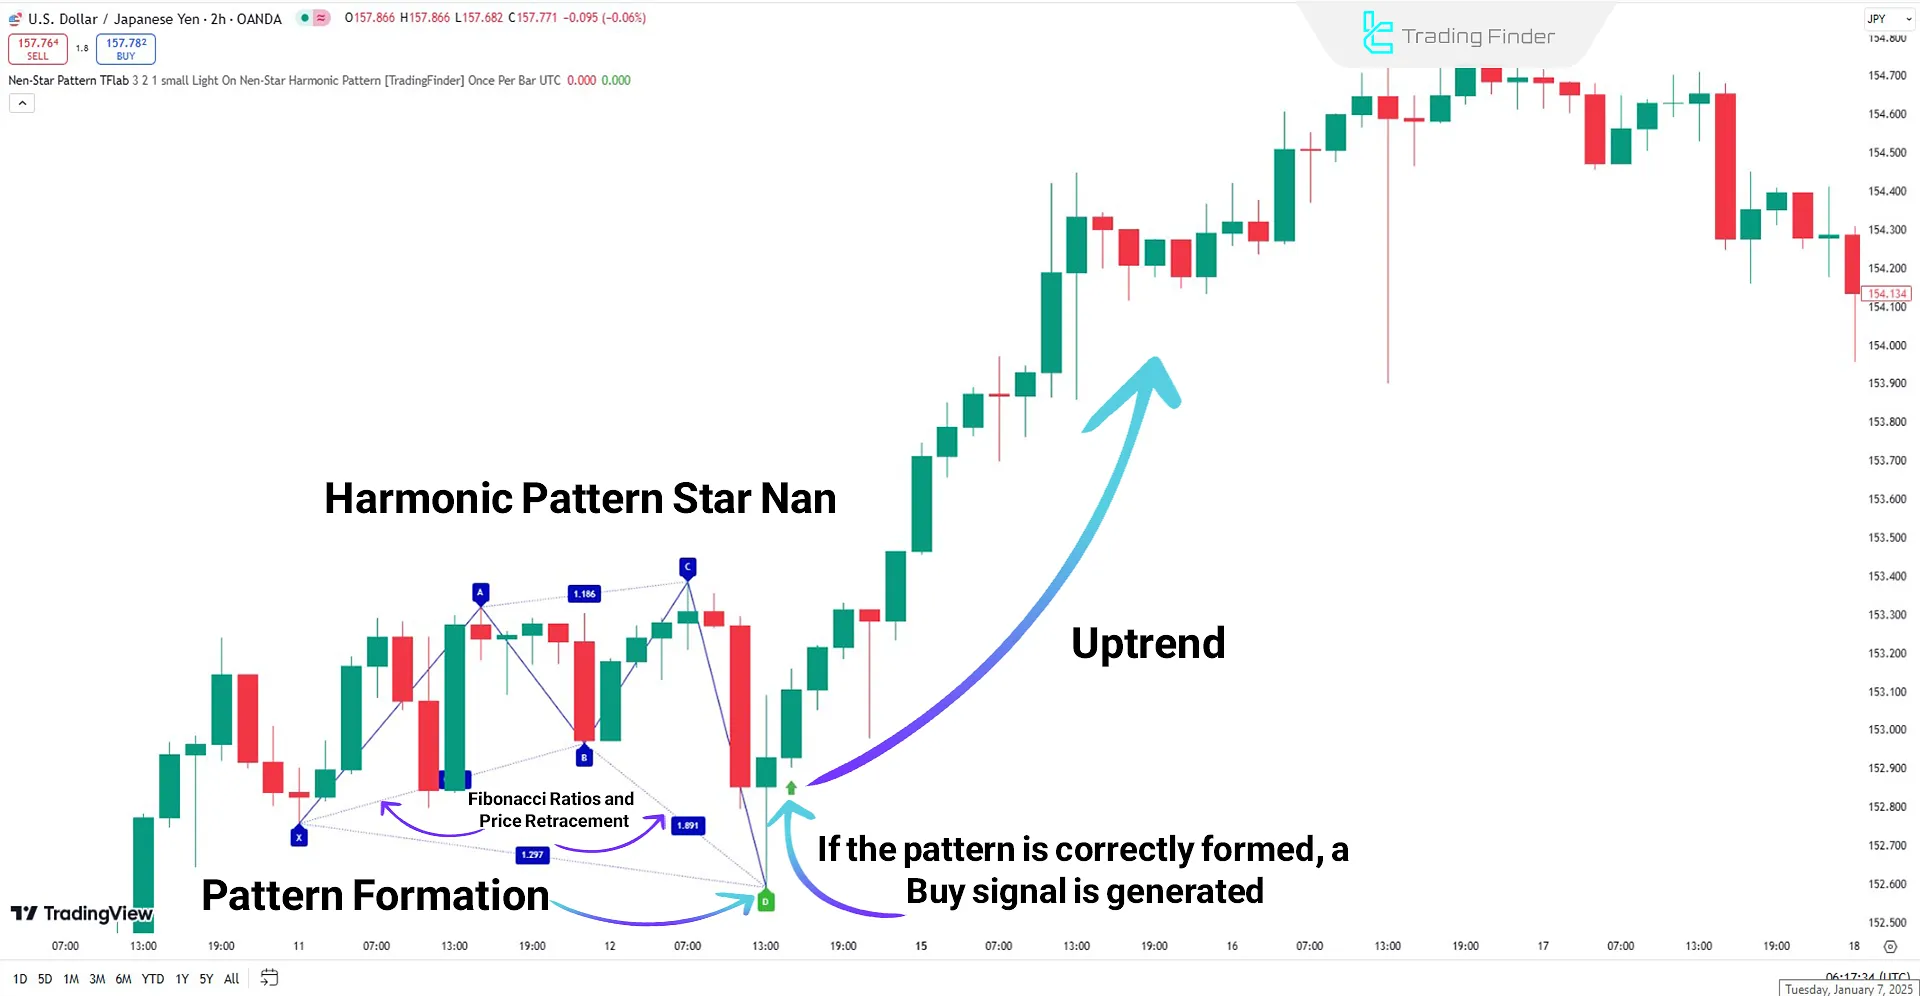
Indicator in an Uptrend
The Nen Star Harmonic Pattern Indicator detects a bullish Nen Star pattern.
The identified pattern, forming an M shape on the chart, signals the end of a bearish move as price reaches Point D in the Potential Reversal Zone (PRZ). After Point D, a trend reversal signal to bullish is generated, marked by a green arrow.
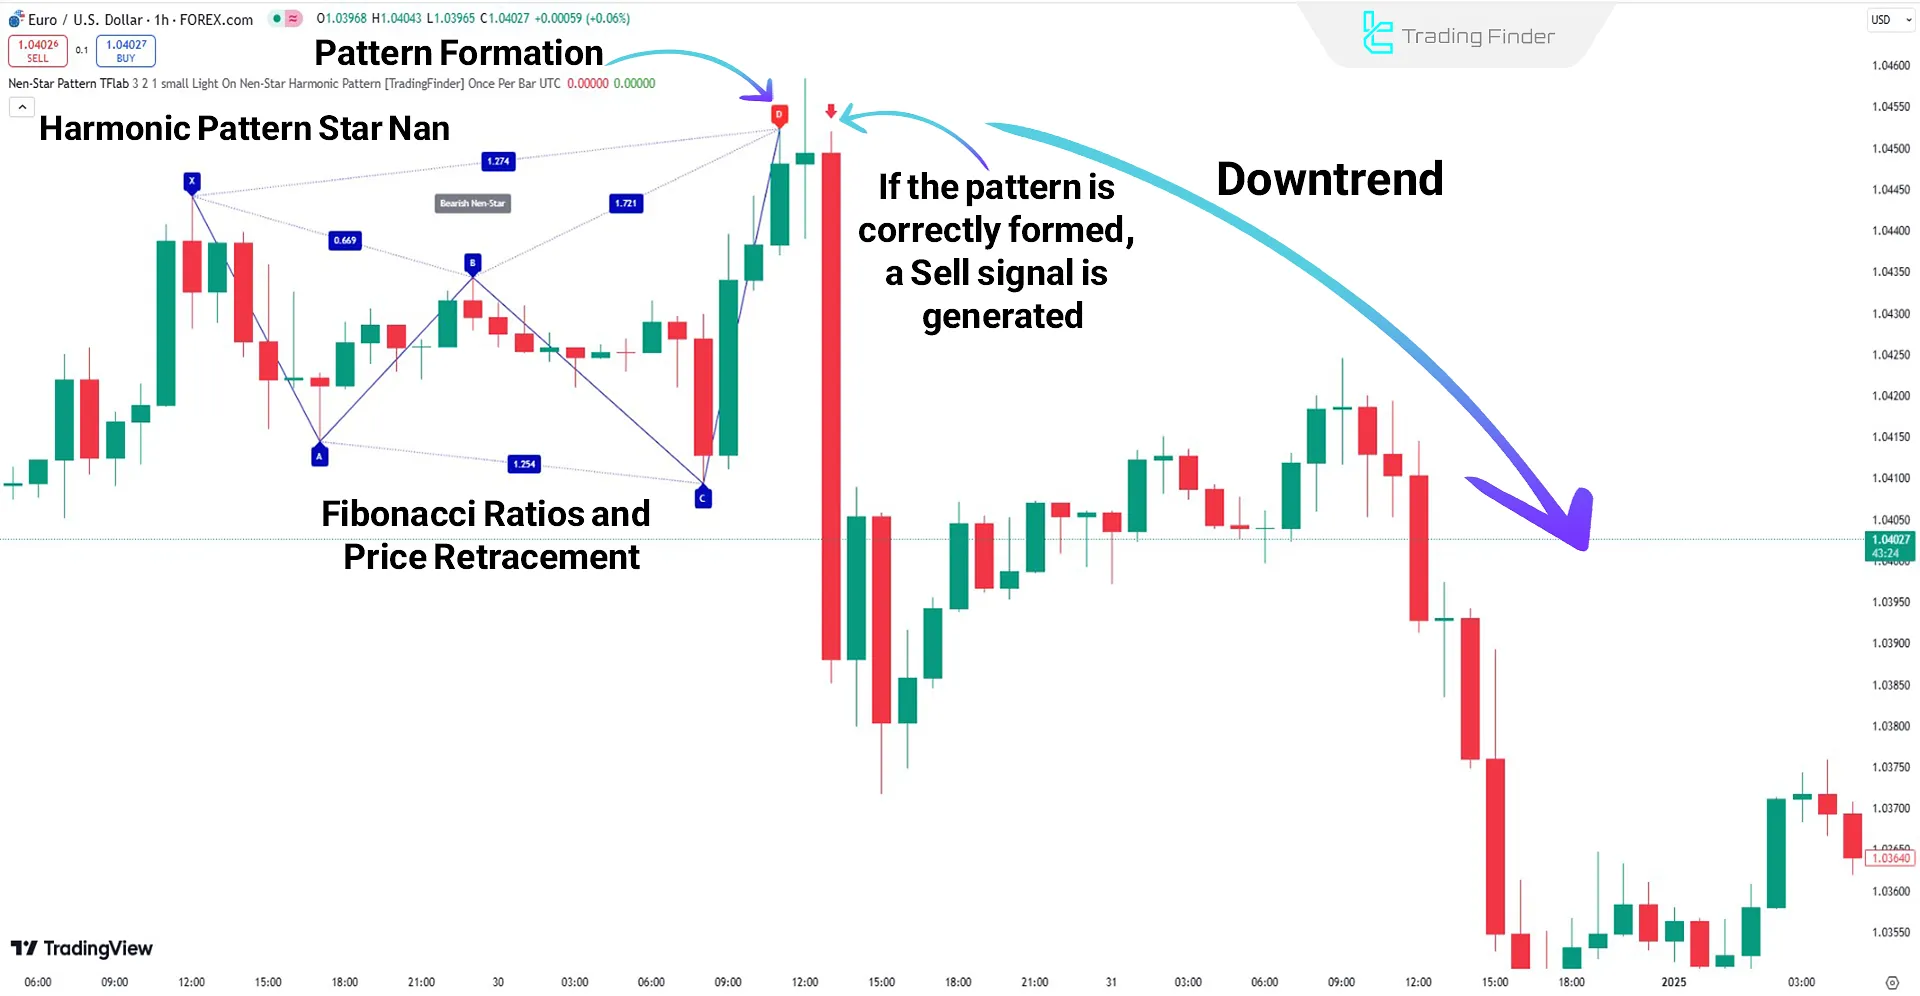
Indicator in a Downtrend
In the Nen Star harmonic pattern, after Point D, a confirmation bearish candle appears, indicating the beginning of a downtrend. The indicator determines the entry signal (Sell) near Point D.
Traders can place the Stop Loss (SL) slightly above Point D and define Take Profit (TP) targets based on the continuation of the downtrend.
Indicator Settings
Upon evaluating the Nen Star Harmonic Pattern Indicator, it is observed that its settings are divided into three main sections: Logical, Display, and Alert.
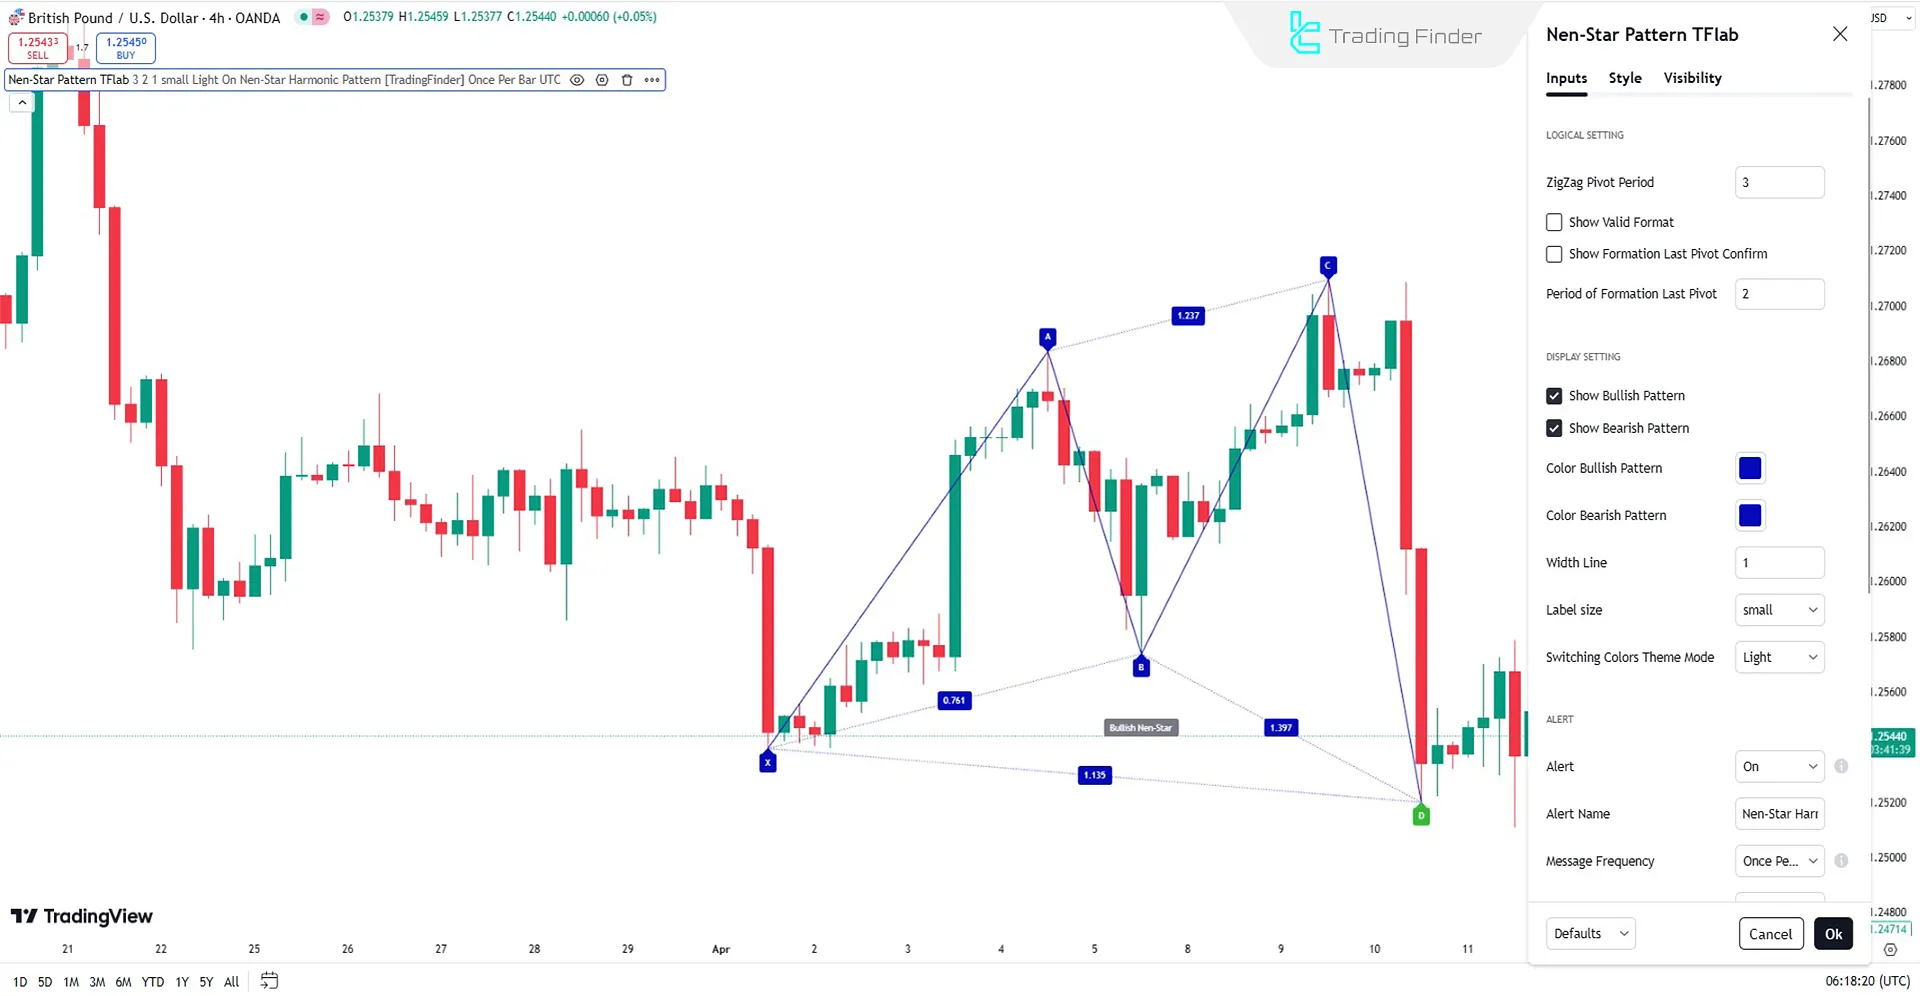
Logical Settings
- ZigZag Pivot Period: Defines the calculation period for pivot points
- Show Valid Format: Displays valid patterns
- Show Formation Last Pivot Confirm: Displays confirmation of the last pivot
- Period of Formation Last Pivot: Defines the calculation period for the last pivot confirmation
Display Settings
- Show Bullish Pattern: Enables displaying bullish patterns
- Show Bearish Pattern: Enables displaying bearish patterns
- Color Bullish Pattern: Sets the color for bullish patterns
- Color Bearish Pattern: Sets the color for bearish patterns
- Width Line: Defines the thickness of pattern lines
- Label Size: Adjusts the size of text labels on the chart
- Switching Colors Theme Mode: Changes the indicator’s background theme
Alert Settings
- Alert: Generates an alert when a pattern is detected
- Alert Name: Customizes the alert name
- Message Frequency: Defines how often messages appear when a pattern forms
- Show Alert Time by Time Zone: Displays alert time based on the selected time zone
Conclusion
Traders can utilize the Harmonic Pattern Indicators to identify high risk-to-reward trading opportunities.
The Buy Signal is displayed with a green arrow, and the Sell Signal is shown with a red arrow. These signals are applicable across various markets, including Forex.
The precise identification of Potential Reversal Zones (PRZ) and target price levels in the Nen Star Harmonic Pattern makes this indicator an effective tool for risk management and optimizing profitability in trading strategies.
Nen Star Harmonic Pattern TradingView PDF
Nen Star Harmonic Pattern TradingView PDF
Click to download Nen Star Harmonic Pattern TradingView PDFWhat is the Nen Star Harmonic Pattern Indicator?
The Nen Star Harmonic Pattern Indicator is an advanced analytical tool in TradingView that helps traders identify market trend reversals and potential price reversal zones (PRZ).
How can the Nen Star Harmonic Indicator be used for risk management?
Traders can utilize Potential Reversal Zones (PRZ) to define entry and exit points. The Stop Loss (SL) should be placed slightly above or below Point D, depending on the trade direction.


