The Quasimodo Pattern Indicator (Quasimodo) is part of a series of TradingView indicators that helps identify the QM pattern, one of the robust and reliable technical analysis patterns in the RTM style.
Due to its structural resemblance to the character Quasimodo in Victor Hugo's novel "The Hunchback of Notre Dame," this pattern is named after him. This specific type of Head and Shoulders (H&SH) pattern assists traders in identifying Trend Reversal points.
Its difference from the Head and Shoulders pattern lies in creating CHOCH (Change of Character), which can increase its performance reliability.
Indicator Table
|
Indicator Categories:
|
Price Action Tradingview Indicators
Signal & Forecast Tradingview Indicators
Chart & Classic Tradingview indicators
|
|
Platforms:
|
Trading View Indicators
|
|
Trading Skills:
|
Intermediate
|
|
Indicator Types:
|
Reversal Tradingview Indicators
Leading Tradingview Indicators
Non-Repaint Tradingview Indicators
|
|
Timeframe:
|
Multi-Timeframe Tradingview Indicators
|
|
Trading Style:
|
Fast Scalper Tradingview Indicators
Day Trading Tradingview Indicators
Scalper Tradingview Indicators
Swing Trading Tradingview Indicators
|
|
Trading Instruments:
|
TradingView Indicators in the Forex Market
Cryptocurrency Tradingview Indicators
Stock Tradingview Indicators
Commodity Tradingview Indicators
Indices Tradingview Indicators
Share Stocks Tradingview Indicators
|
Overview
The Quasimodo Pattern Indicator signals a potential price trend reversal and can be used as confirmation at key chart points where a trend reversal is likely.
By identifying the QM pattern, this indicator specifies entry points and take-profit and stop-loss levels, enabling traders to enter trades accordingly.
QM Pattern in an Uptrend
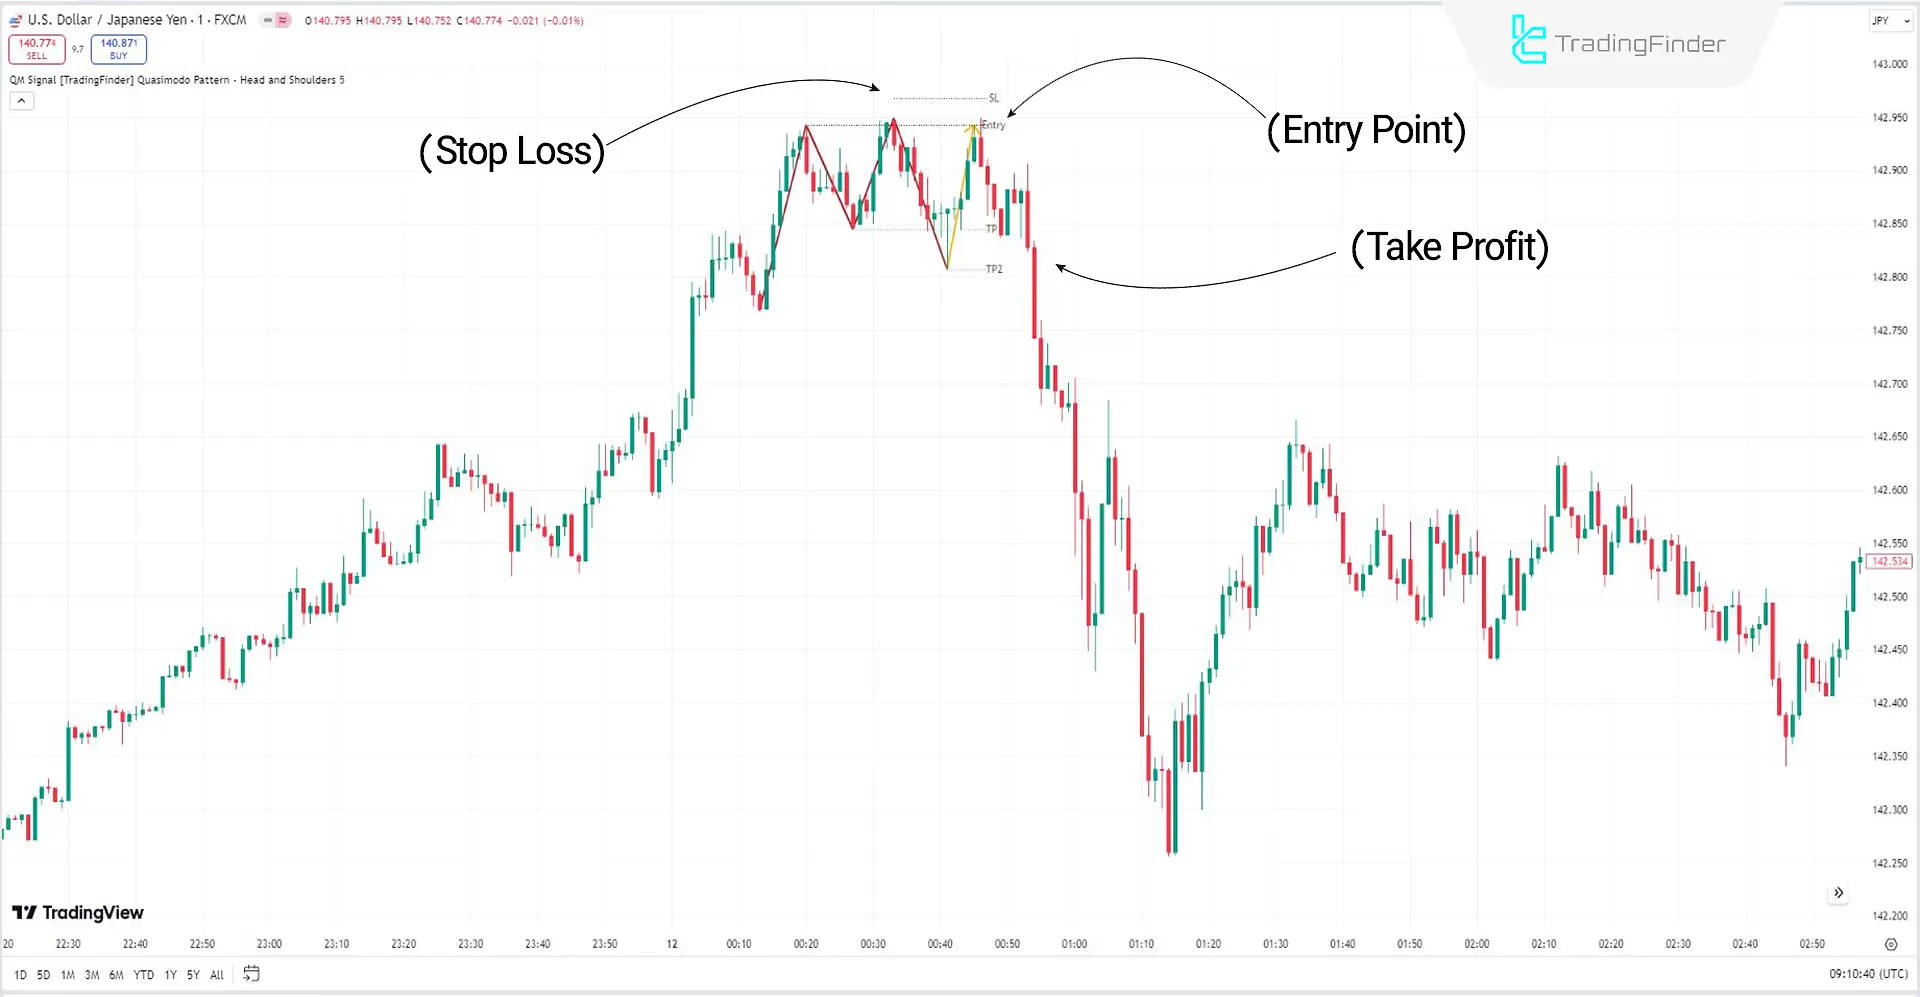
The following image shows the price chart of USDJPY in a 1-minute timeframe. After a sustained uptrend, the left shoulder forms, and the price creates a new peak (head) higher than the left shoulder's peak. After the price drops toward the previous low, we witness a CHOCH (Change of Character) as it breaks the low, followed by a movement back up to reach a level equal to the left shoulder.
The QM pattern is complete, and a sell trade can be initiated.
Take-Profit and Stop-Loss for the QM Pattern
The indicator sets the area above the head (highest peak) as the stop-loss and the last low where CHOCH occurred as the take-profit.

Inverse QM Pattern in a Downtrend
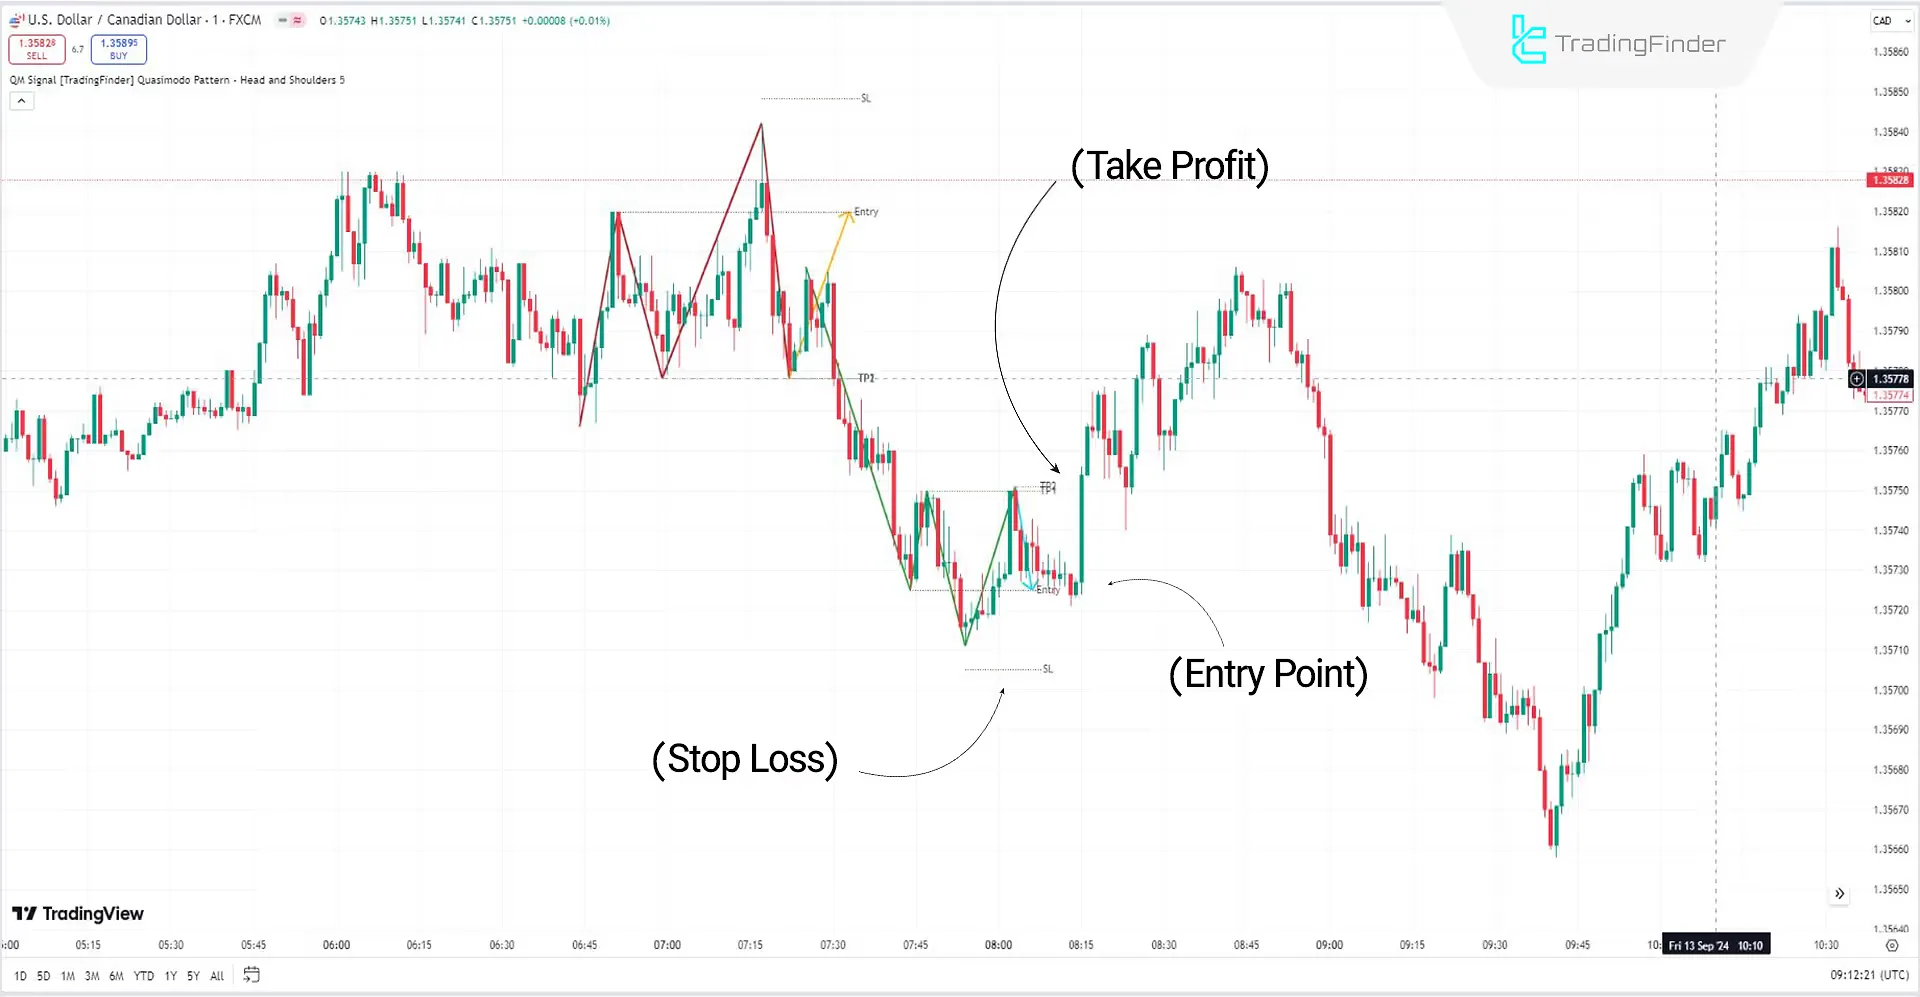
The image below shows the price chart of USDCAD in a 1-minute timeframe. After a sustained downtrend, the left shoulder forms, and the price creates a new valley (head) lower than the left shoulder's valley.
After the price rises towards the previous high, we witness a CHOCH, and the price returns to a level equal to the left shoulder. The QM pattern is complete, and a buy trade can be initiated.
Take-Profit and Stop-Loss for the Inverse QM Pattern
The indicator sets the area below the head (lowest valley) as the stop loss and the last high where CHOCH occurred as the take profit.

Indicator Settings

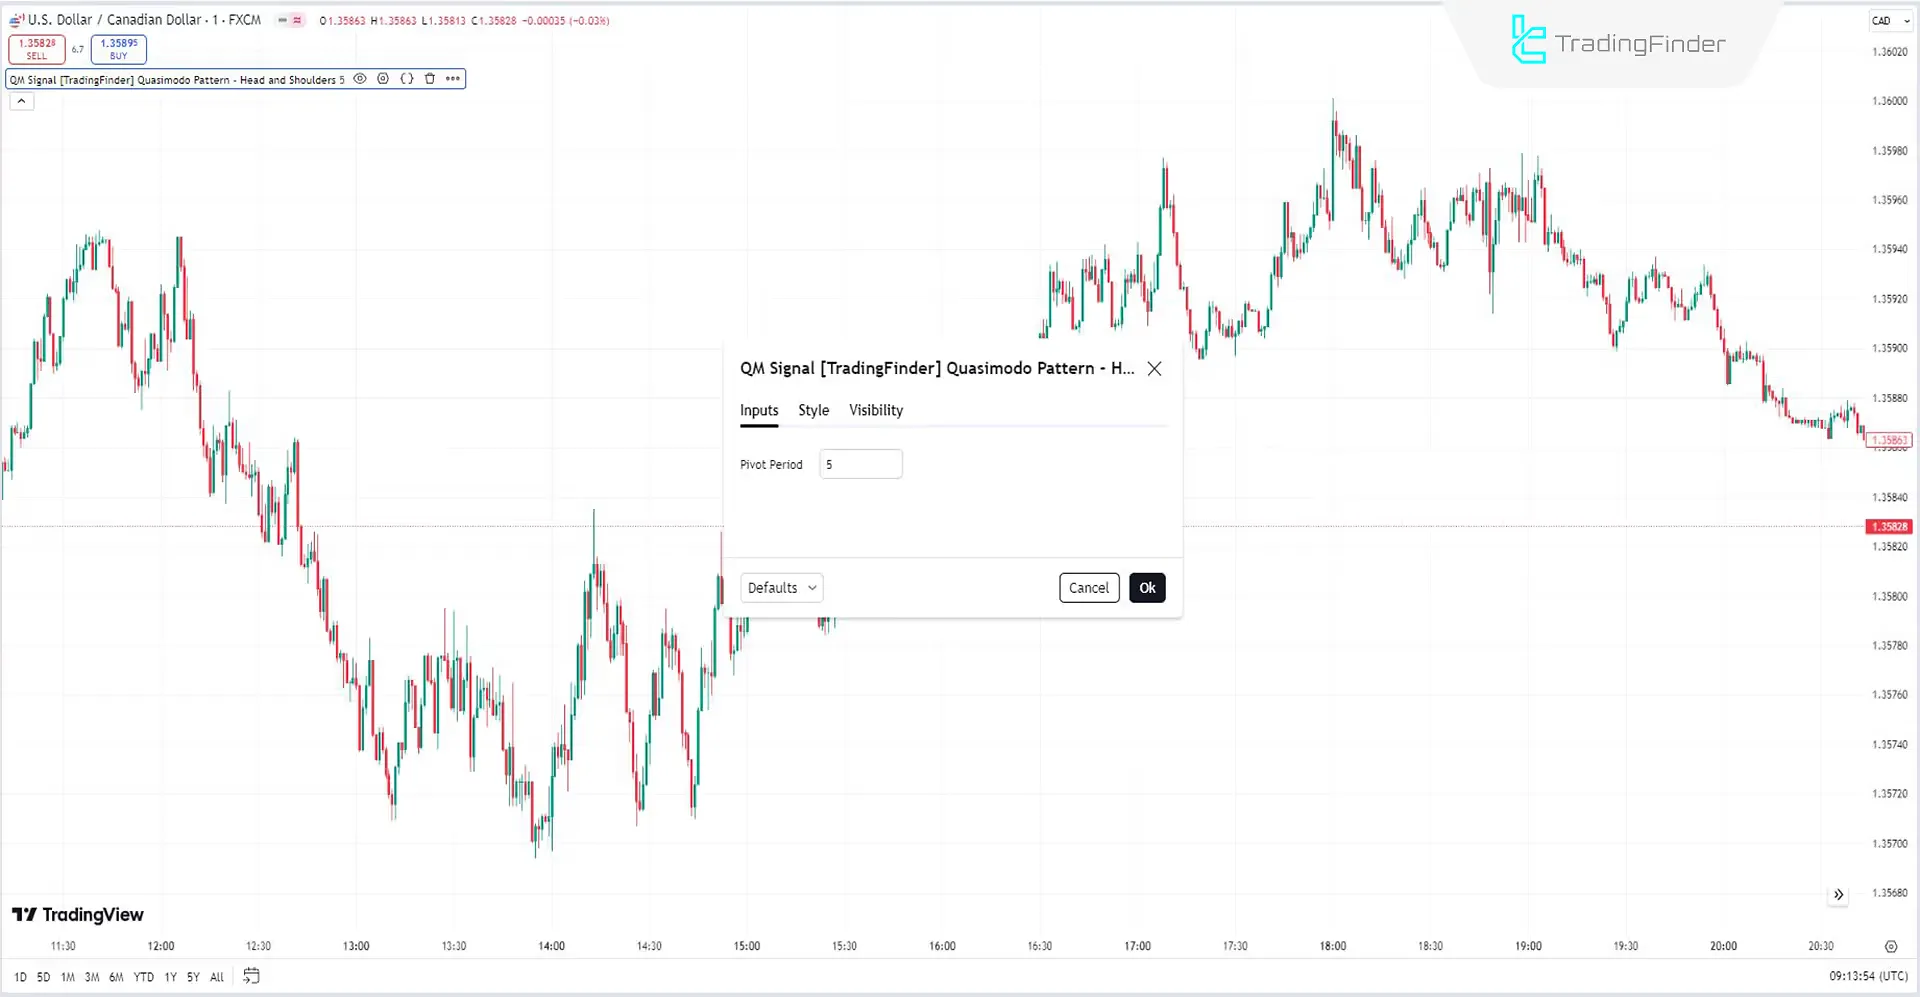
- Pivot Period: The indicator's period is set to 5.
Summary
The Quasimodo Pattern, or QM, is a reliable technical analysis pattern frequently appearing on price charts.
This Price Action indicator identifies QM patterns without needing to examine the chart, and traders can use additional confirmations like trend direction, support and resistance levels, and supply and demand zones to trade.
What is the difference between the QM Indicator and the H&SH pattern?
The Quasimodo pattern confirms trend reversals by breaking the previous low or high (CHOCH), whereas in the Head and Shoulders pattern, the trend reversal is confirmed by breaking the neckline.
What is the Quasimodo Pattern Indicator, and how does it work?
This indicator is a technical analysis tool that automatically identifies the QM pattern and specifies optimal entry points, take-profit, and stop-loss levels.
hey can you make it just reference the candle open and close instead of the wicks?
Thank you for providing excellent trading tools and education on a consistent basis. I have found your site as one of my favourite trading depositories since I discovered it. I was looking for Quasimodo Pattern for MT5 but realised that it's only available for TV. Creating the MT5 version will be truly appreciated. Thank you for your excellent service.