TradingView
MetaTrader4
MetaTrader5
The Reversal Candlestick Pattern Indicator is a powerful tool for traders looking to identify these patterns on Trading View indicator.
The candlestick indicator automatically identifies and displays 5 major reversal patterns, including Pin Bar, Engulfing, 3 Inside Bar, Piercing, and Dark Cloud, to traders.
These reversal patterns, formed by two or more candles, usually appear at the end of bullish or bearish trends and indicate a potential market trend reversal.
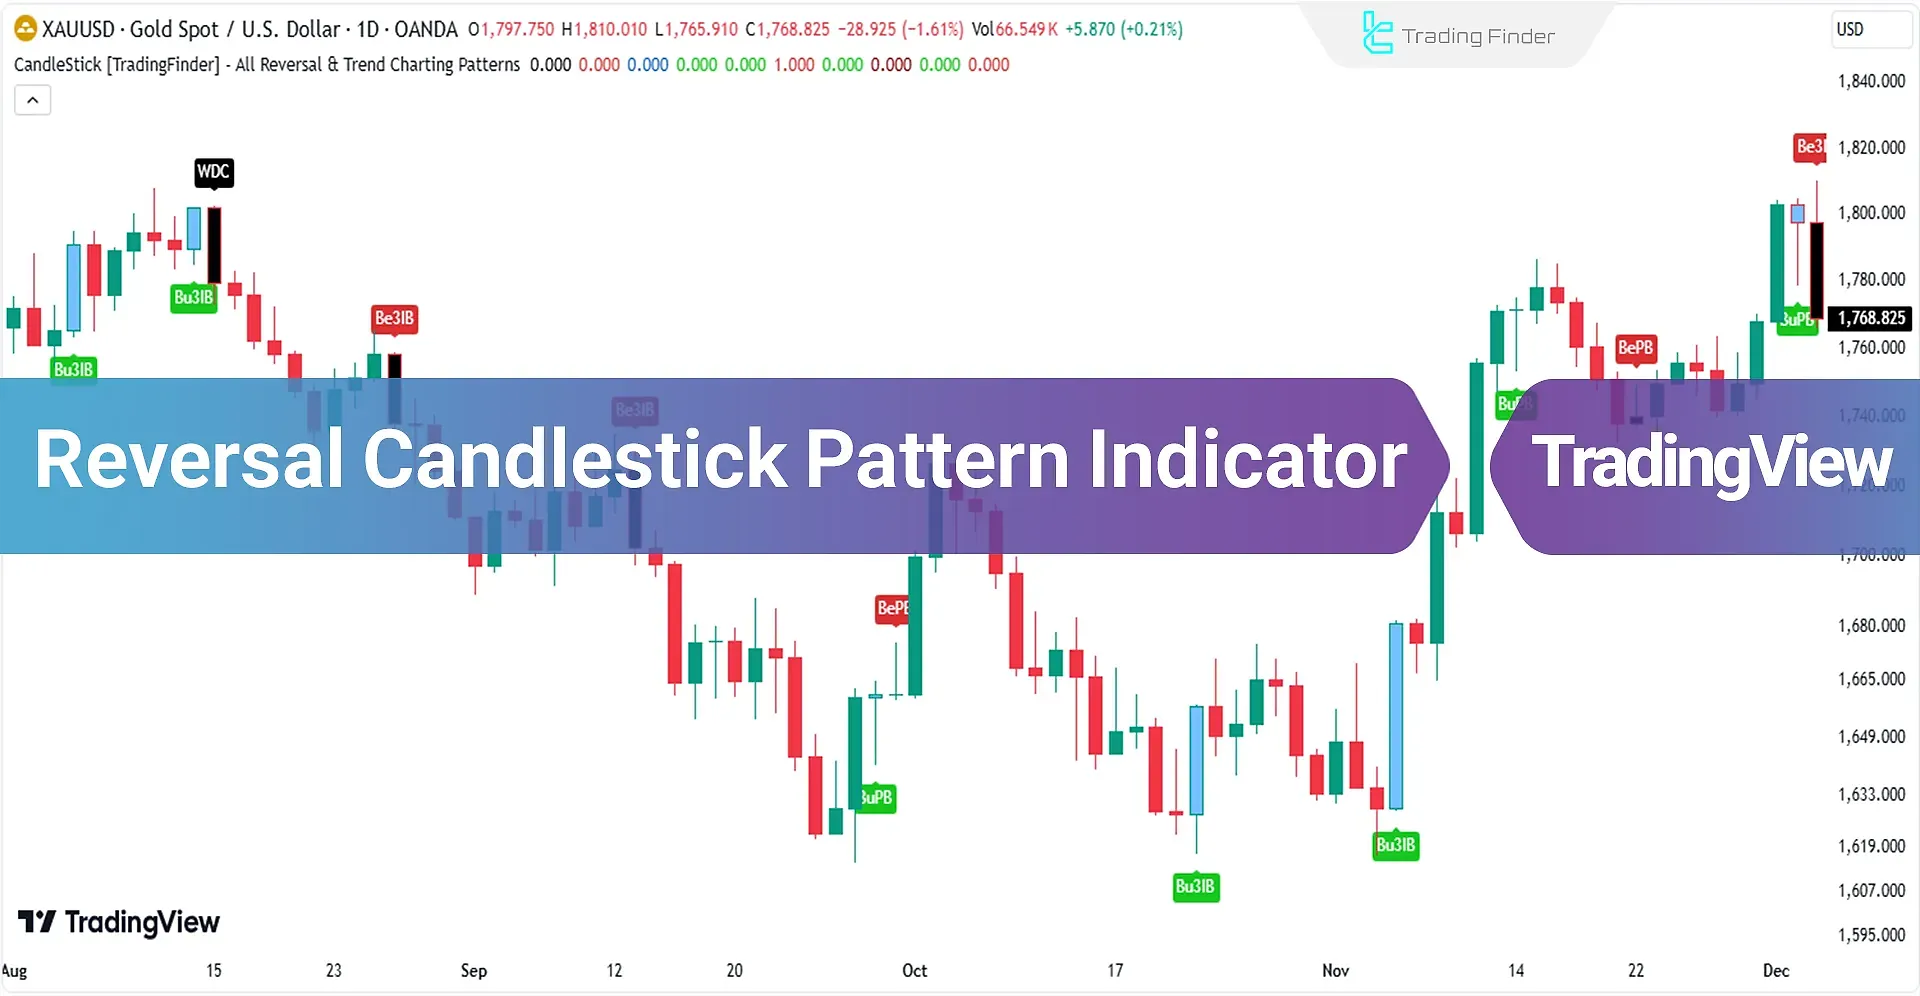
Traders can use these patterns to determine entry and exit points and optimize their strategies.
Candlestick Pattern Indicator Table
Indicator Categories: | Candle Sticks Tradingview Indicators Educational Tradingview Indicators Chart & Classic Tradingview indicators |
Platforms: | Trading View Indicators |
Trading Skills: | Elementary |
Indicator Types: | Reversal Tradingview Indicators Entry & Exit TradingView Indicators |
Timeframe: | Multi-Timeframe Tradingview Indicators |
Trading Style: | Intraday Tradingview Indicators Day Trading Tradingview Indicators Scalper Tradingview Indicators |
Trading Instruments: | TradingView Indicators in the Forex Market Commodity Tradingview Indicators Indices Tradingview Indicators |
Reversal Pin Bar Pattern
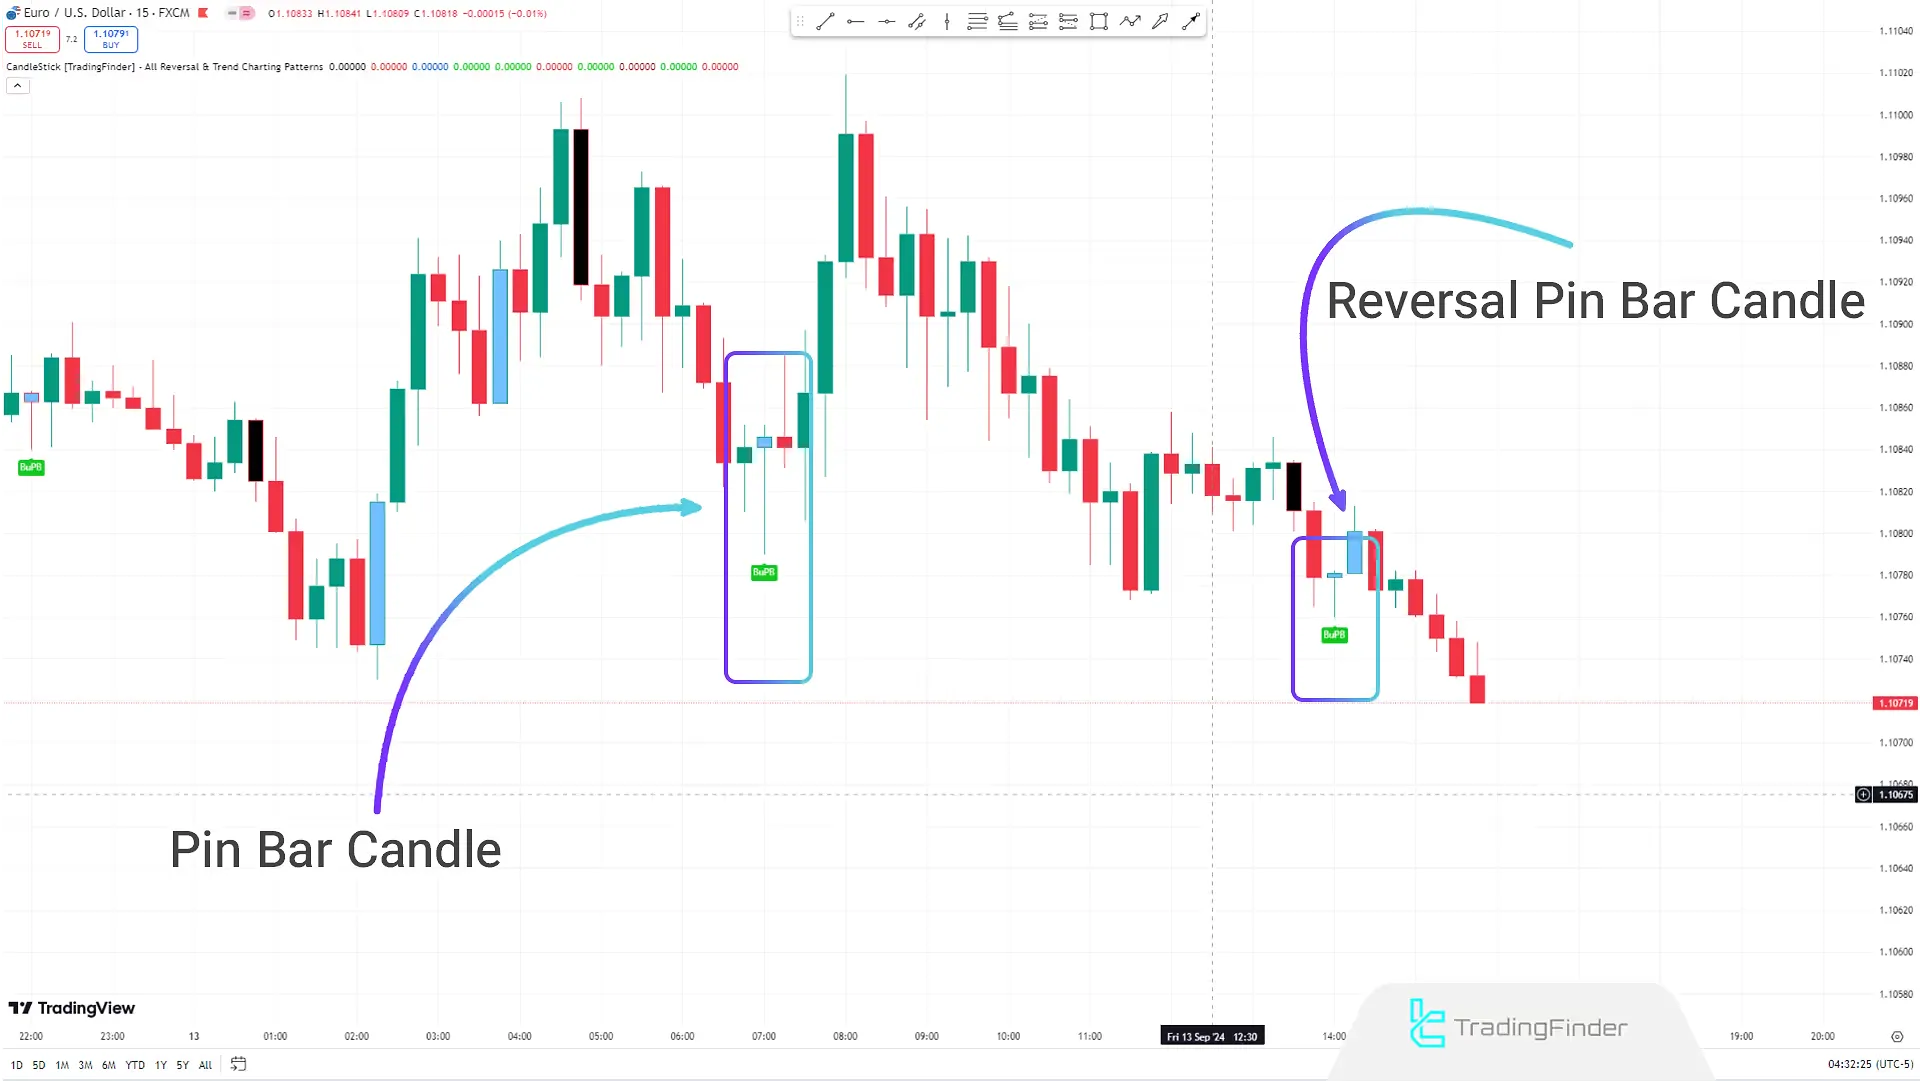
In the 15-minute chart of the EUR/USD currency pair, the candlestick indicator identifies and displays the Pin Bar reversal pattern. The Pin Bar is a powerful reversal pattern that usually appears at the end of trends.
This pattern includes a small body and a long wick, indicating a possible change in the direction of the market trend.
The longer the wick of the Pin Bar, the higher the likelihood of a strong trend reversal.
Reversal Dark Cloud Pattern
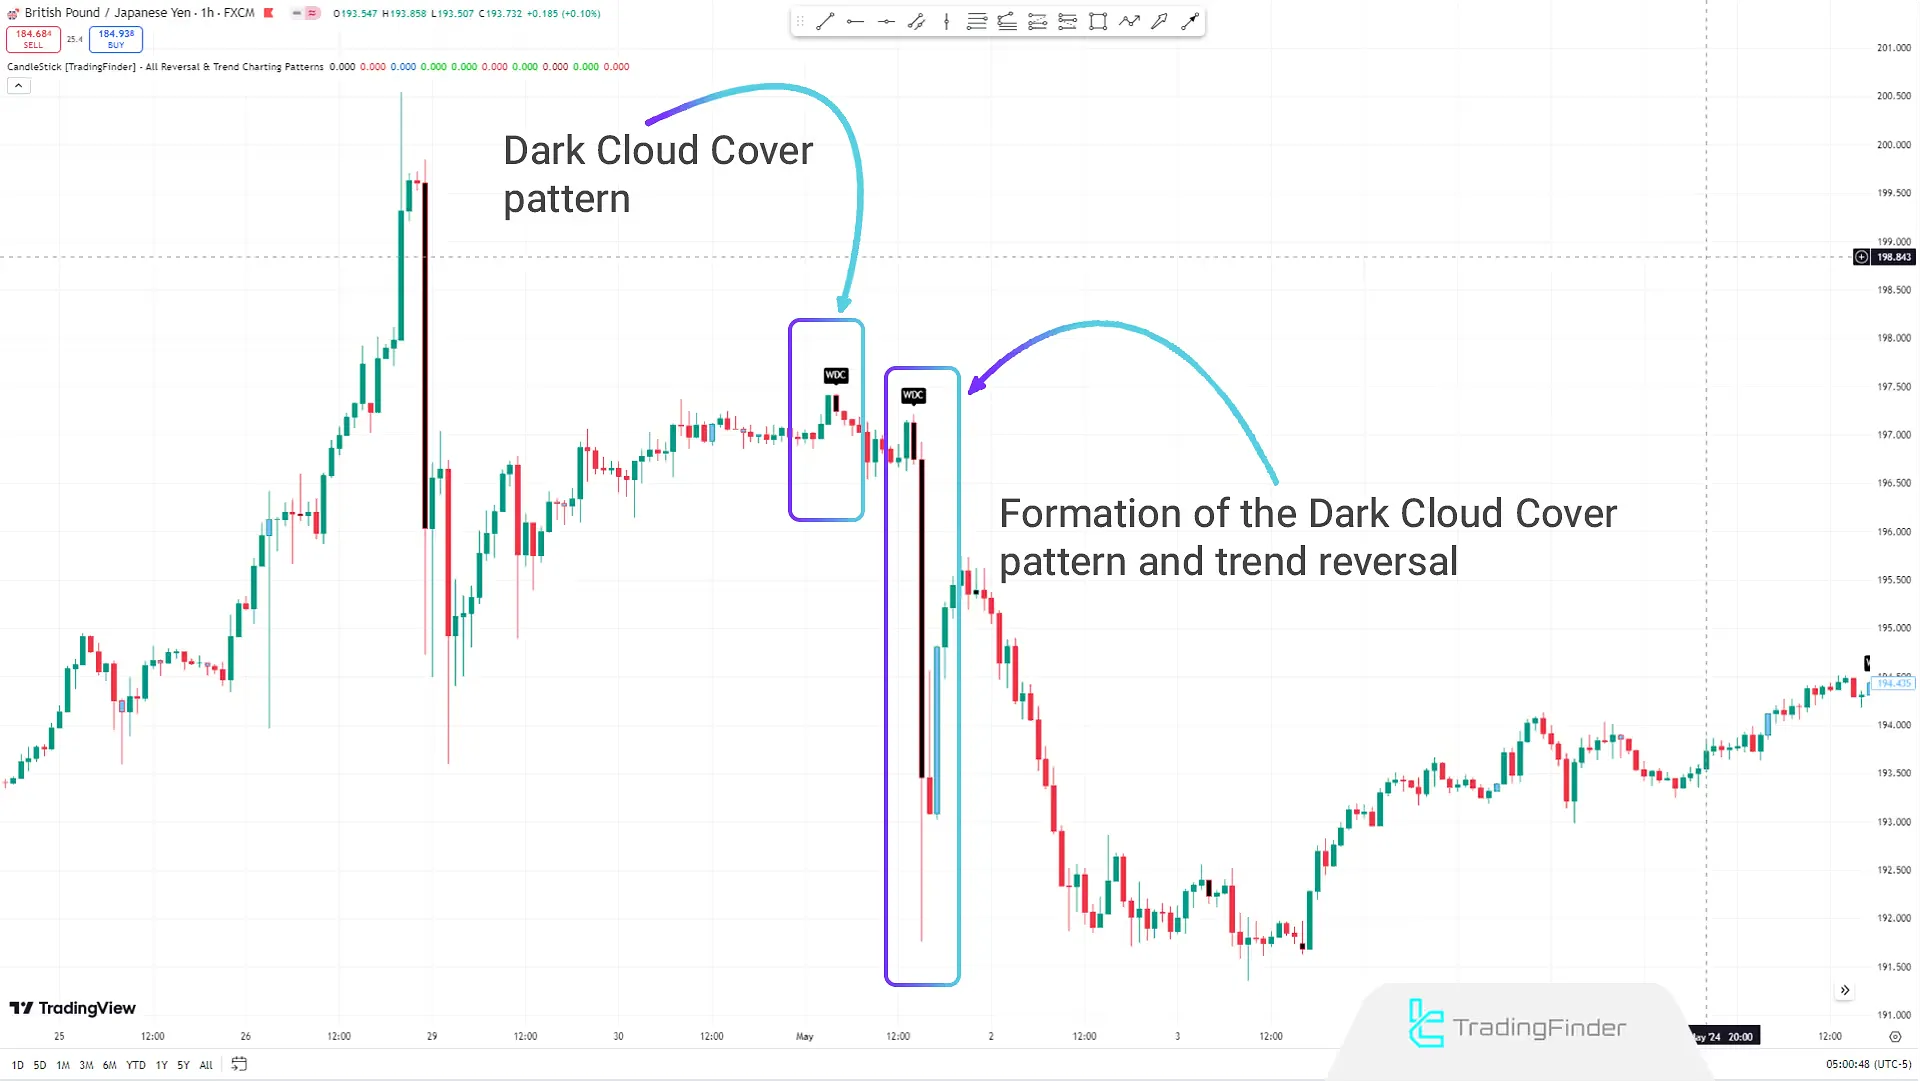
In the 1-hour chart of the GBP/JPY currency pair, the Candlestick indicator identifies two Dark Cloud Cover patterns.
This pattern is considered a bearish reversal that usually appears at the end of an uptrend. Traders who observe this pattern can predict a potential market trend change and adjust their trading strategies accordingly.
The Dark Cloud Cover pattern indicates selling pressure and a potential price decline, helping traders better manage their trades.
Piercing Line Pattern
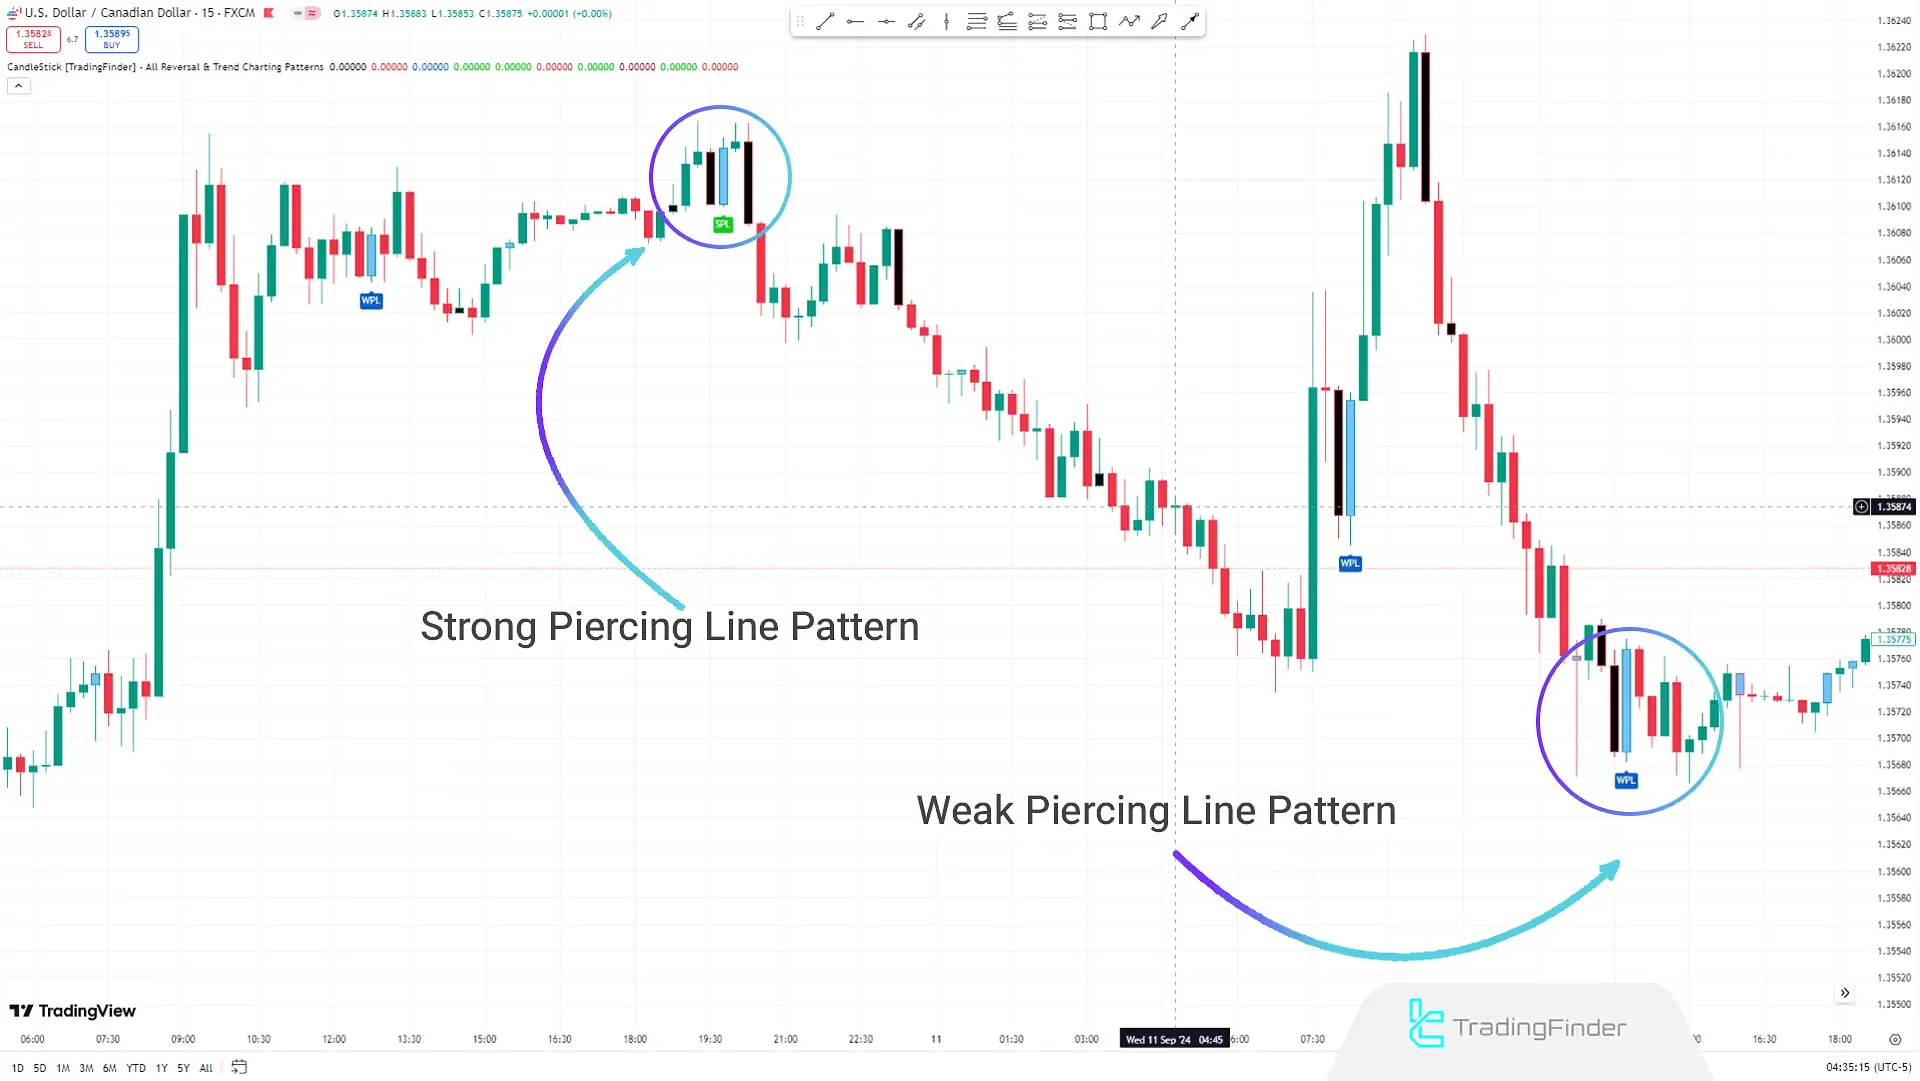
The candlestick indicator identifies two Piercing Line patterns in the 15-minute chart of the USD/CAD currency pair.
These patterns are displayed in weak (WPL: Weak Piercing Line) and strong (SPL: Strong Piercing Line) states.
The Piercing Line is a reversal pattern formed by two candles. The first candle appears at the end of a downtrend and is bearish.
The second candle is bullish and covers at least 50% of the previous candle's body. This pattern usually indicates a potential reversal from a downtrend to an uptrend.
Reversal 3 Inside Bar Pattern
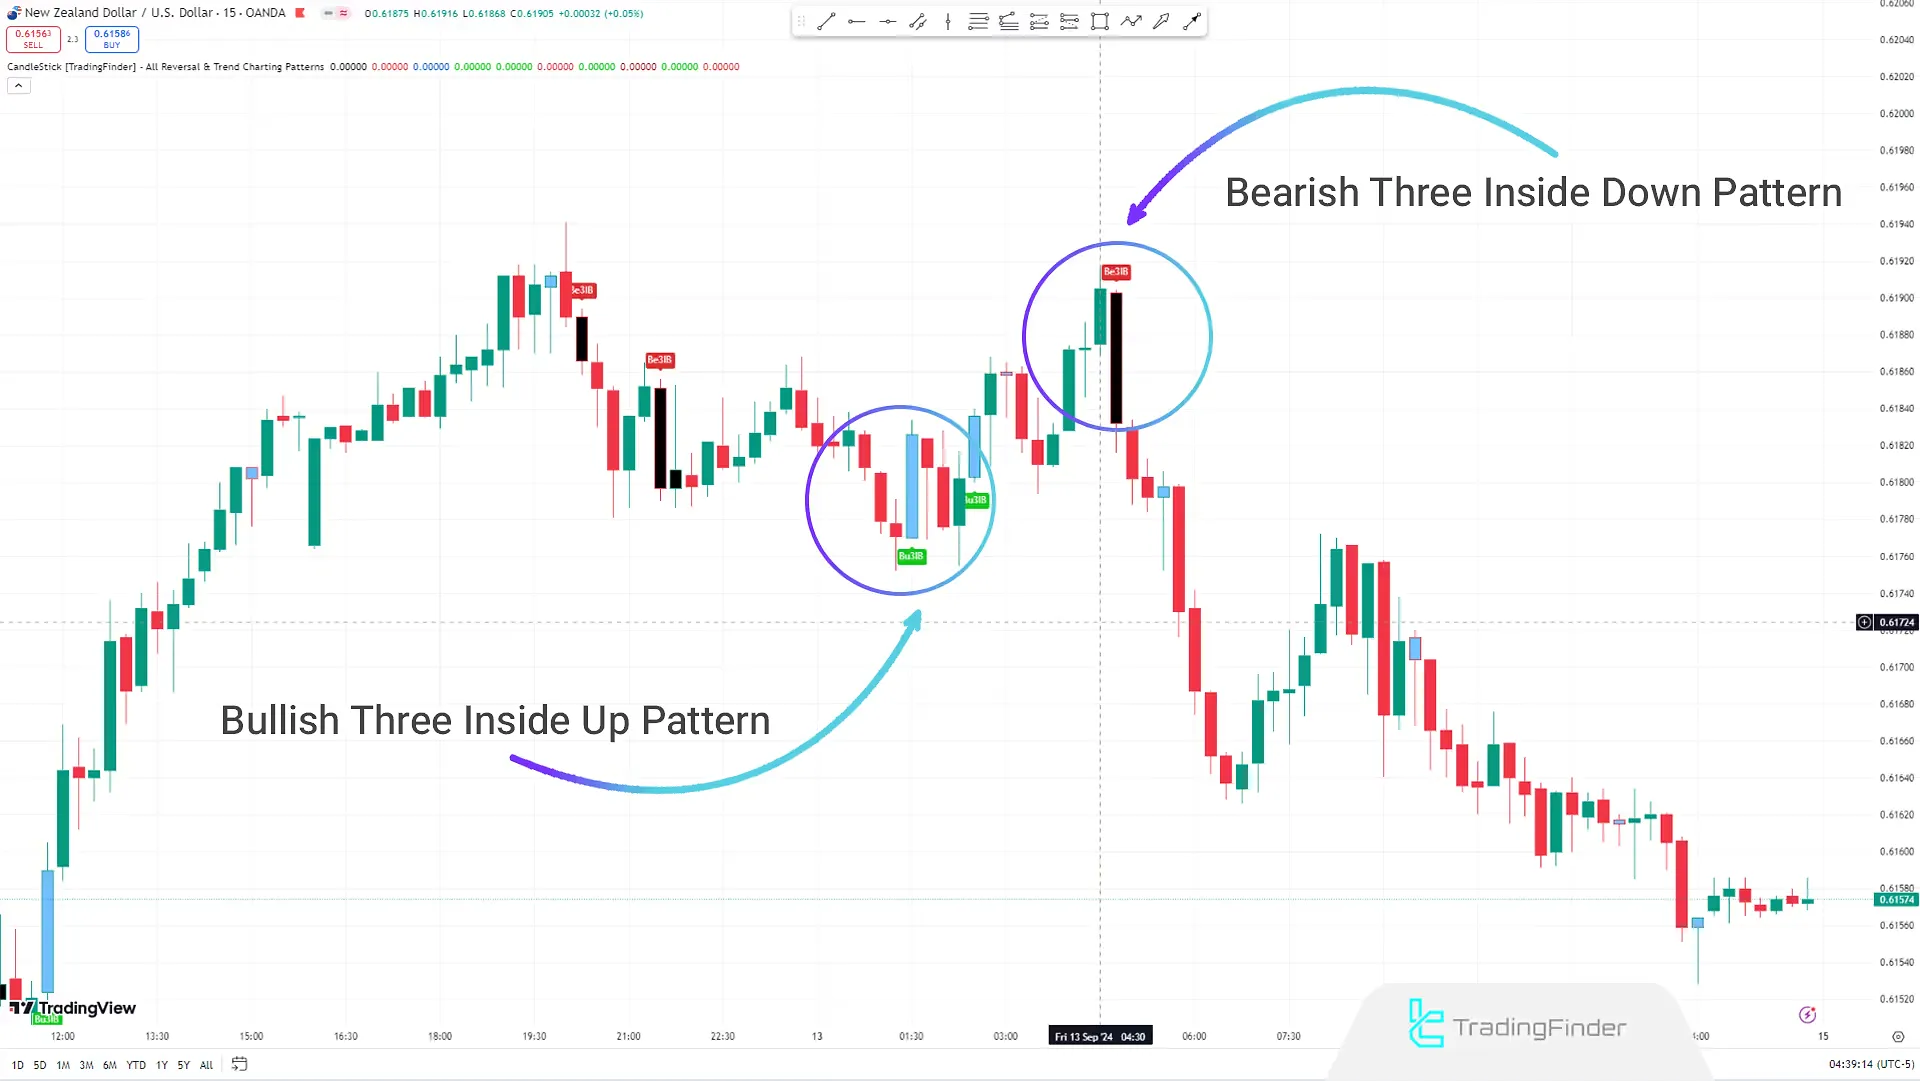
In the 15-minute NZD/USD currency pair chart, the pattern detector identifies two reversal 3 Inside Bar patterns at the end of an uptrend and a downtrend.
The Bullish 3 Inside Bar pattern (Bu3Lb) appears at the end of a downtrend and consists of three consecutive candles. The first candle must be bearish, the second smaller and within the range of the first candle, and the third a strong bullish candle.
To confirm the pattern, the third candle must cover more than 50% of the first candle's body.
In the Bearish 3 Inside Bar pattern (Be3Lb), this pattern appears at the end of an uptrend.
The first candle must be bullish, the second smaller and within the range of the first candle, and the third a strong bearish candle. Like the bullish case, the third candle must cover more than 50% of the first candle to confirm the pattern.
Reversal Engulfing Pattern
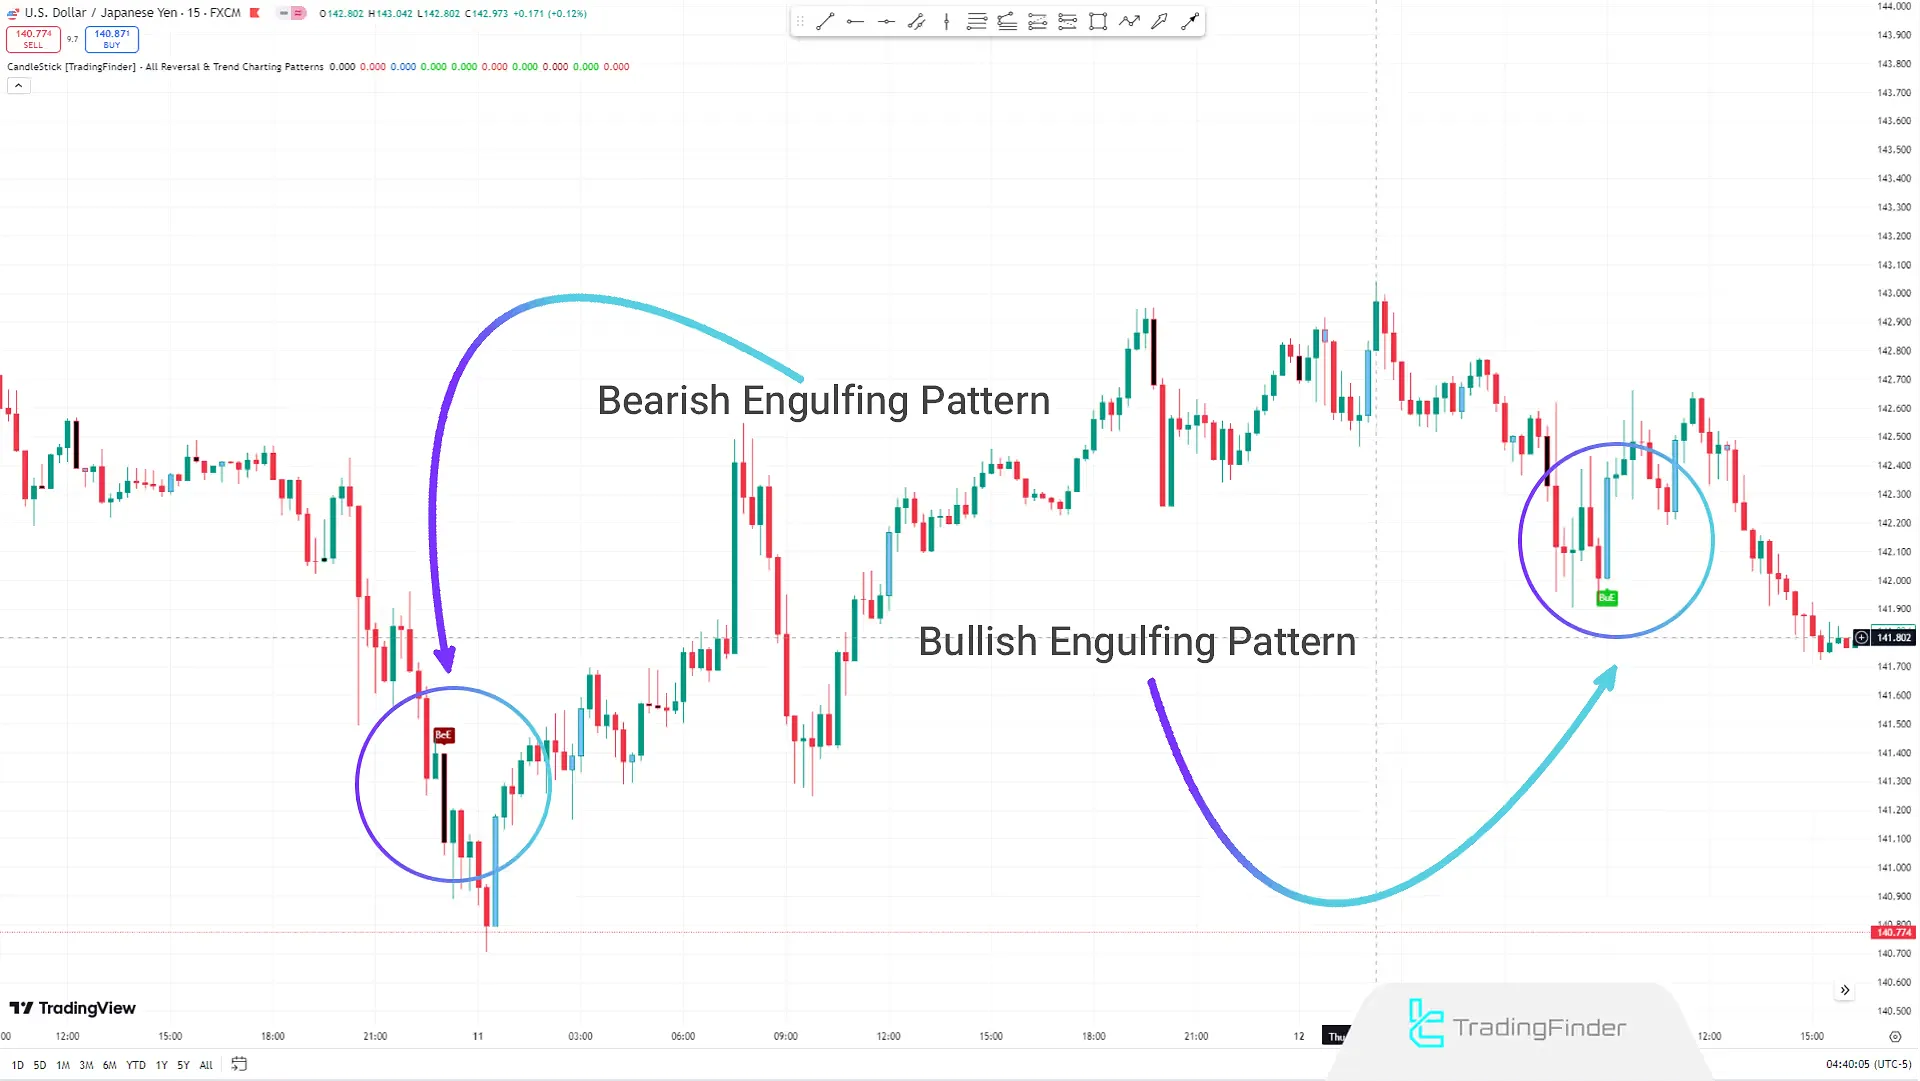
TheEngulfing pattern is a reversal pattern formed by at least two candles. In this pattern, the second candle has a significantly longer body than the first candle and completely covers the body of the first candle.
In the 15-minute USD/JPY chart, two types of Engulfing patterns, one bullish and one bearish, are displayed:
- The Bullish Engulfing Pattern indicates the strength of buyers. In this pattern, the first candle is bearish, and the second candle is a bullish candle with a long body that completely covers the body of the previous bearish candle. This pattern usually appears at the end of a downtrend, indicating a potential trend reversal to the upside, marked as (BuE) on the chart;
- The Bearish Engulfing Pattern indicates the strength of sellers. In this pattern, the first candle is bullish, and the second candle is bearish, with a long body that completely covers the body of the previous candle. This pattern appears at the end of an uptrend, indicating a potential trend reversal to the downside, marked as (BeE) on the chart.
Candlestick Pattern Indicator Settings
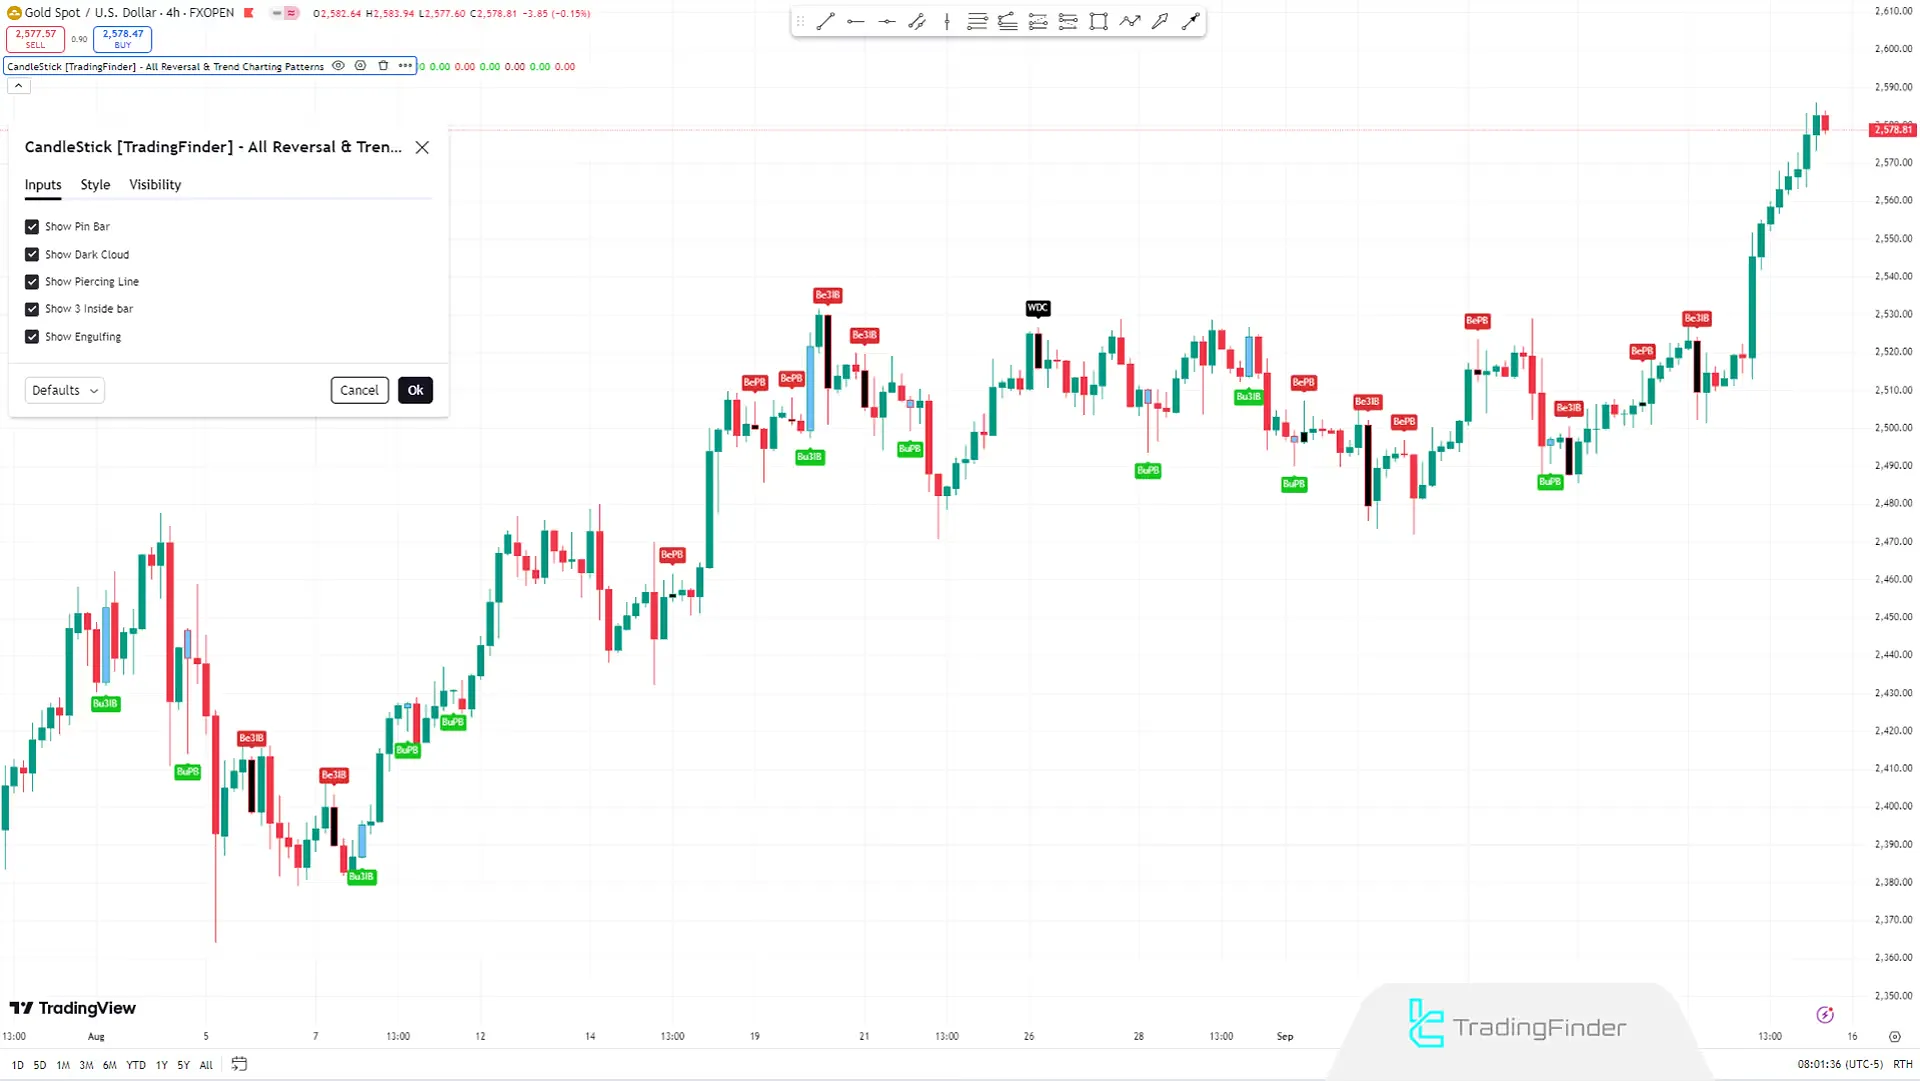
- Show Pin Bar: Show/Hide Pin Bar pattern;
- Show Dark Cloud: Show/Hide Dark Cloud pattern;
- Show Piercing Line: Show/Hide Piercing Line pattern;
- Show 3 Inside Bar: Show/Hide 3 Inside Bar pattern;
- Show Engulfing: Show/Hide Engulfing pattern.
Conclusion
The Reversal Candlestick Pattern Indicator is a specialized tool for detecting and identifying reversal patterns on price charts.
These patterns appear at the end of bullish and bearish trends and provide strong signals of buying or selling pressure to traders.
After these patterns form, the likelihood of a trend change in the market increases.
Reversal Candlestick Pattern TradingView PDF
Reversal Candlestick Pattern TradingView PDF
Click to download Reversal Candlestick Pattern TradingView PDFHow can candlestick patterns be used?
Candlestick patterns can indicate market trend continuation, trend reversal, or indecision. Analysts use these patterns to predict price movements.
What information do candlesticks provide?
Candlesticks provide important information about market psychology, including how buyers and sellers interact, price changes over each period, and levels of buying and selling pressure.


