


The Shark Harmonic Pattern is an effective technical analysis tool for identifying Potential Reversal Zones (PRZ) in financial markets. This pattern consists of five main points: X, A, B, C, and D.
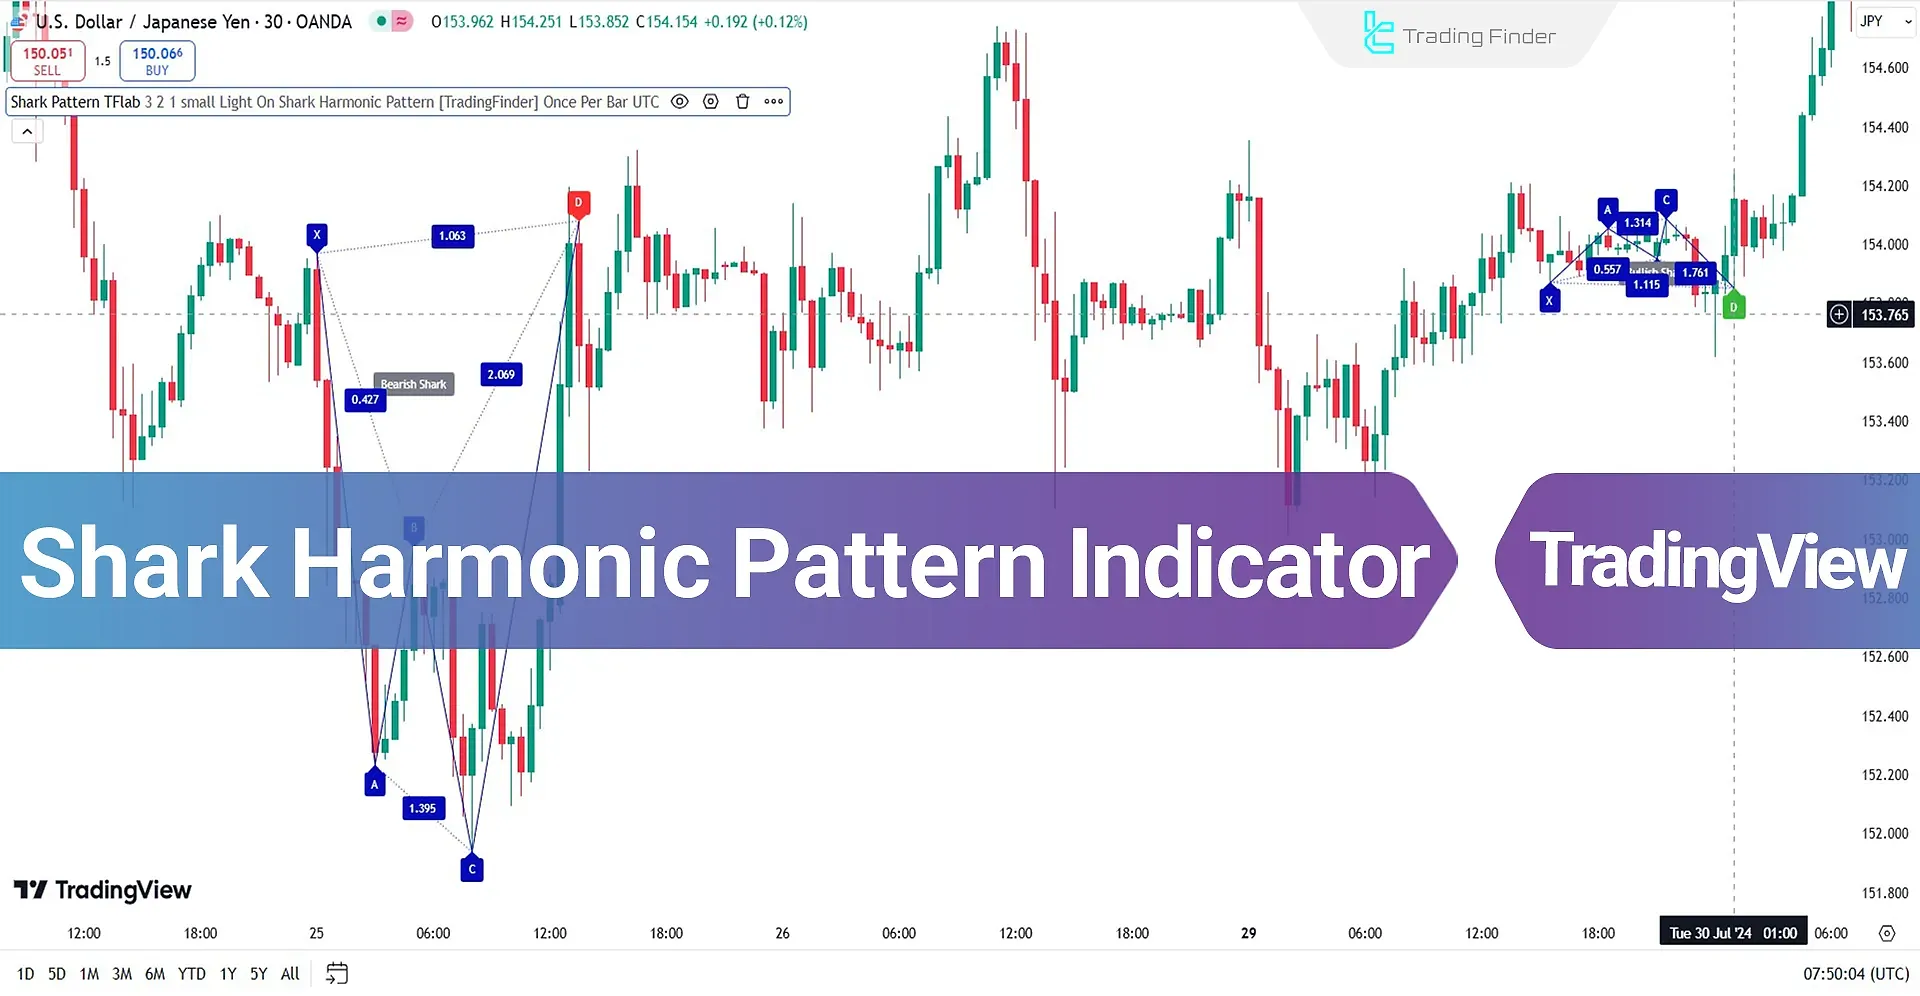
Unlike other harmonic patterns, the Shark pattern uses specific Fibonacci ratios such as 0.886, 1.13, and 1.618. Once the indicator verifies the relationships between these points, it displays the pattern on the chart and provides trading signals.
Shark Harmonic Pattern Indicator Table
Below is a summary table of the indicator's features.
Indicator Categories: | Signal & Forecast Tradingview Indicators Harmonic Tradingview Indicators Chart & Classic Tradingview indicators |
Platforms: | Trading View Indicators |
Trading Skills: | Intermediate |
Indicator Types: | Reversal Tradingview Indicators |
Timeframe: | Multi-Timeframe Tradingview Indicators |
Trading Style: | Day Trading Tradingview Indicators |
Trading Instruments: | TradingView Indicators in the Forex Market Cryptocurrency Tradingview Indicators Stock Tradingview Indicators Forward Tradingview Indicators |
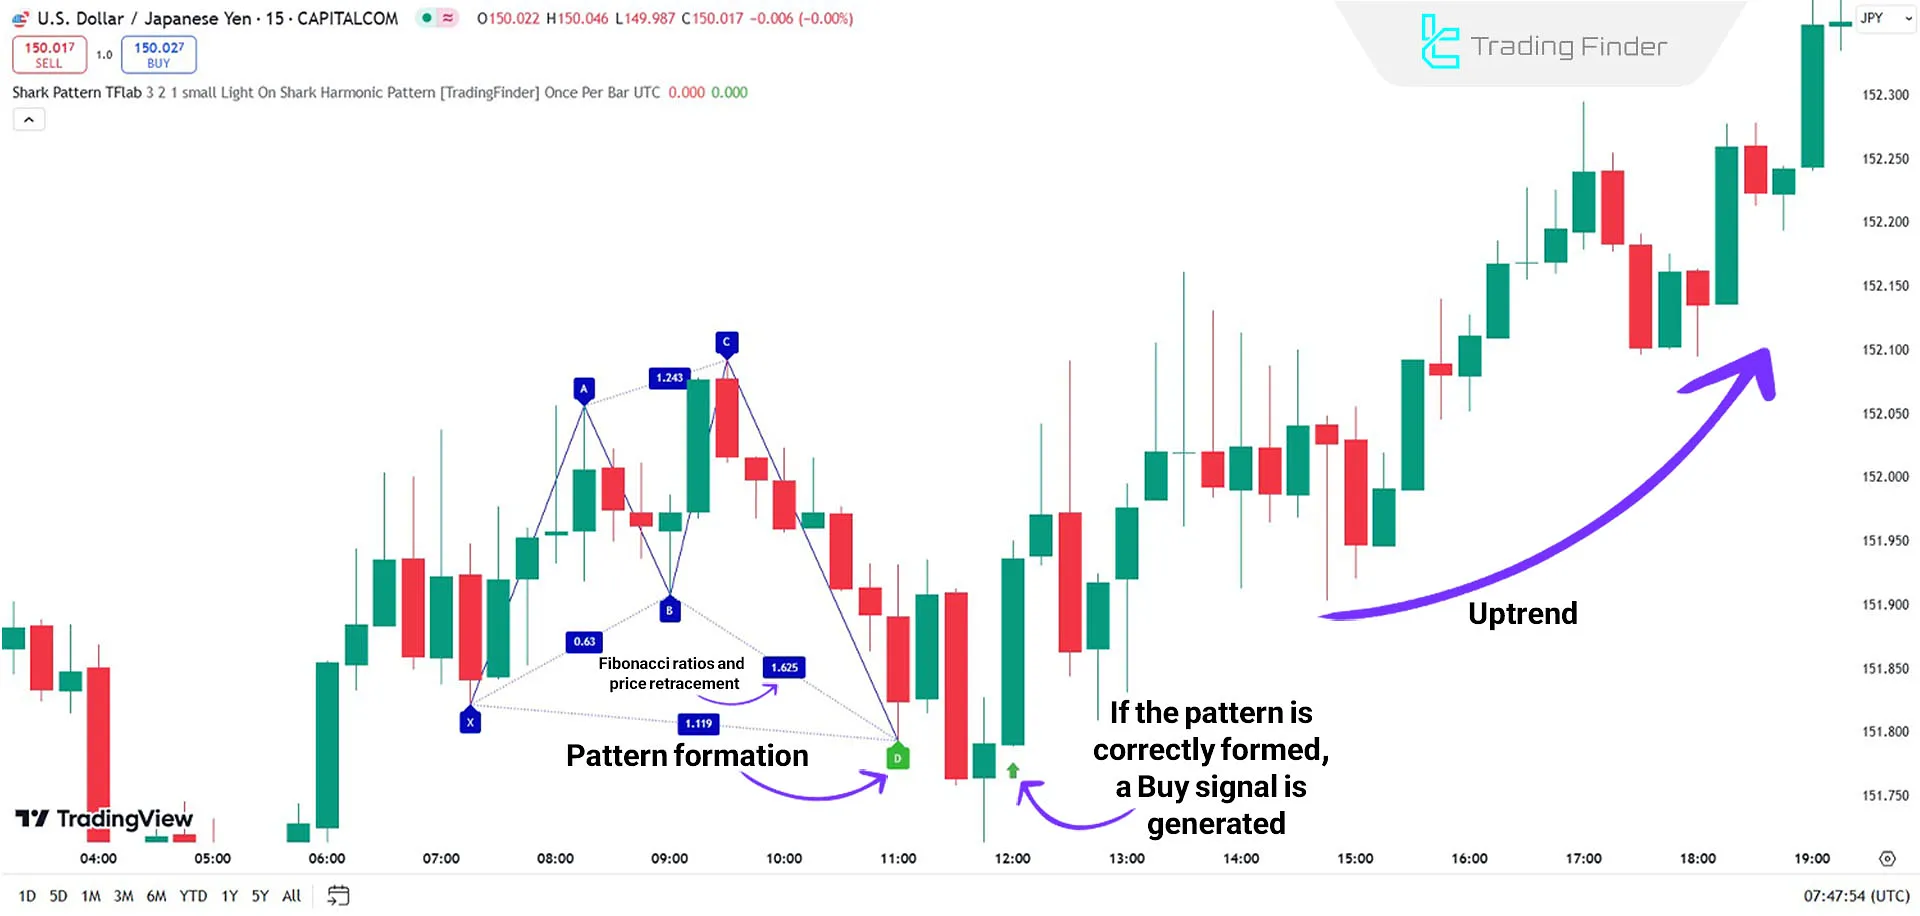
Indicator in Uptrend
In an uptrend, the USD/JPY currency pair's Shark Harmonic Pattern on a 15-minute time frame indicates the start of an upward movement after the price corrects from point B to C and reaches the PRZ.
- This reversal is accompanied by forming a bullish confirmation candle and issuing a buy signal (green arrow);
- Traders can enter a buy position near the PRZ and place the stop loss below point D.
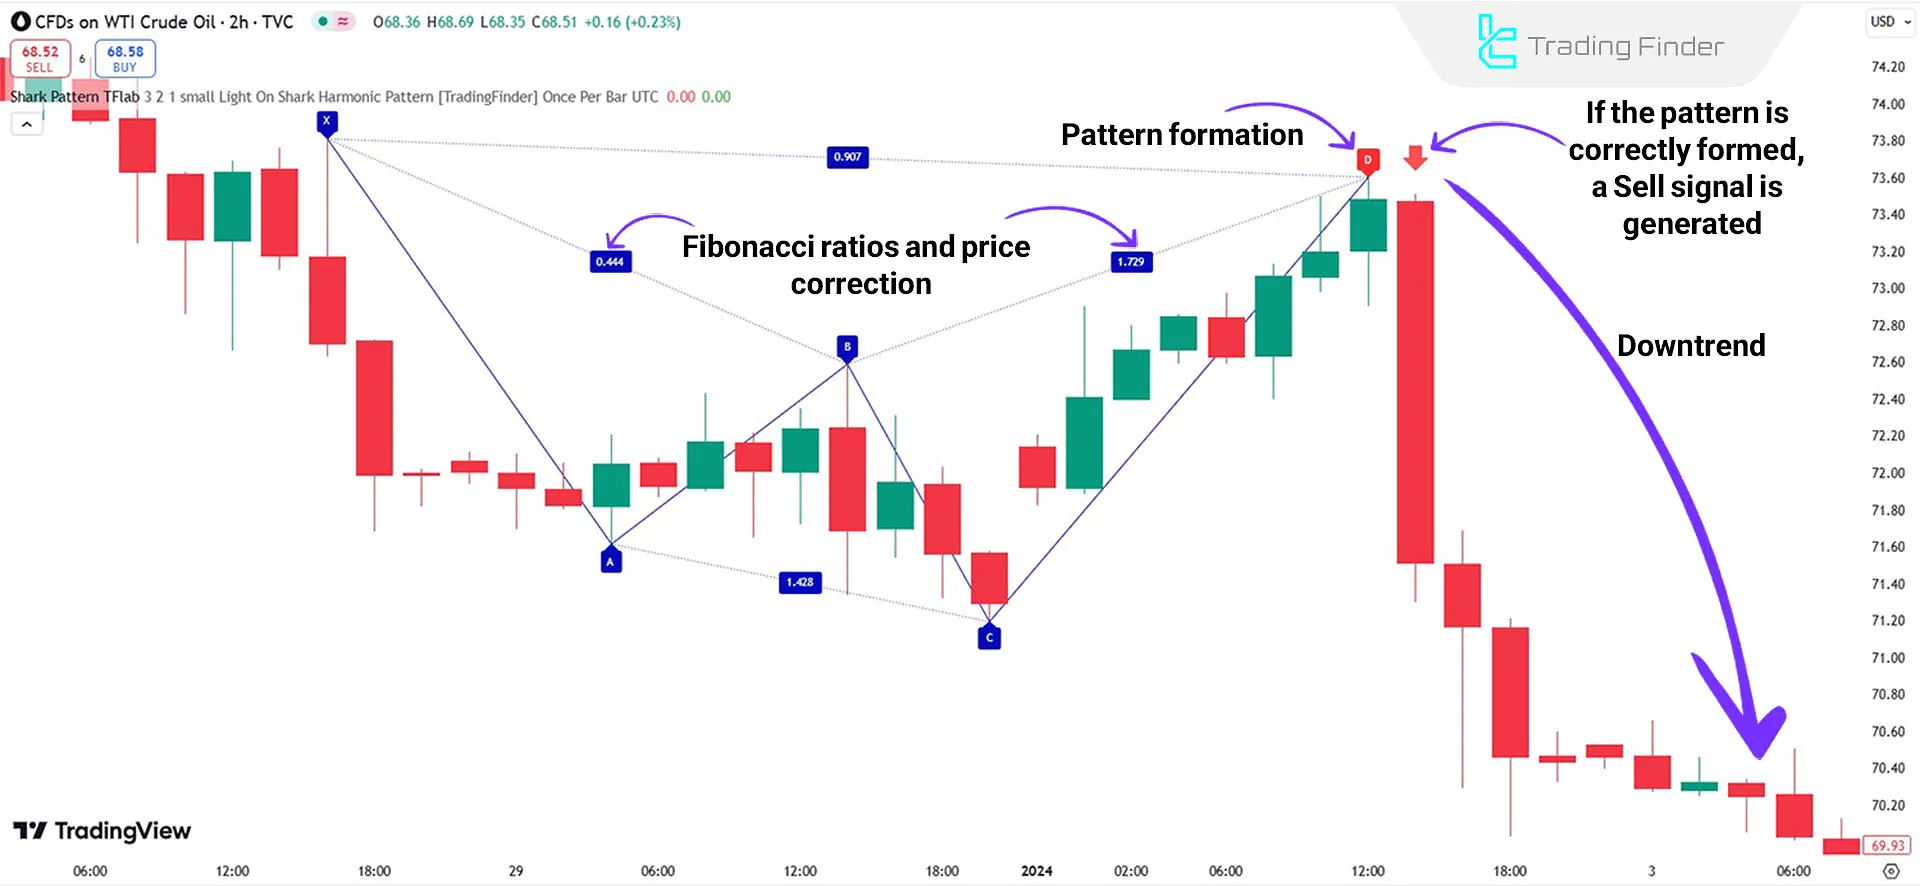
Indicator in Downtrend
In a downtrend, for the WTI crude oil index on a 2-hour time frame, the price corrects from point B to C, reaches the PRZ, and initiates a downward move.
- This trend is accompanied by the issuance of a sell signal (red arrow) and a decrease in buying pressure, providing an opportunity for short trades near the PRZ.
Indicator Settings for Shark Harmonic Pattern
The following image shows the settings of Shark Harmonic Pattern Indicator, including sections such as Logical Setting, Display Setting, and more:
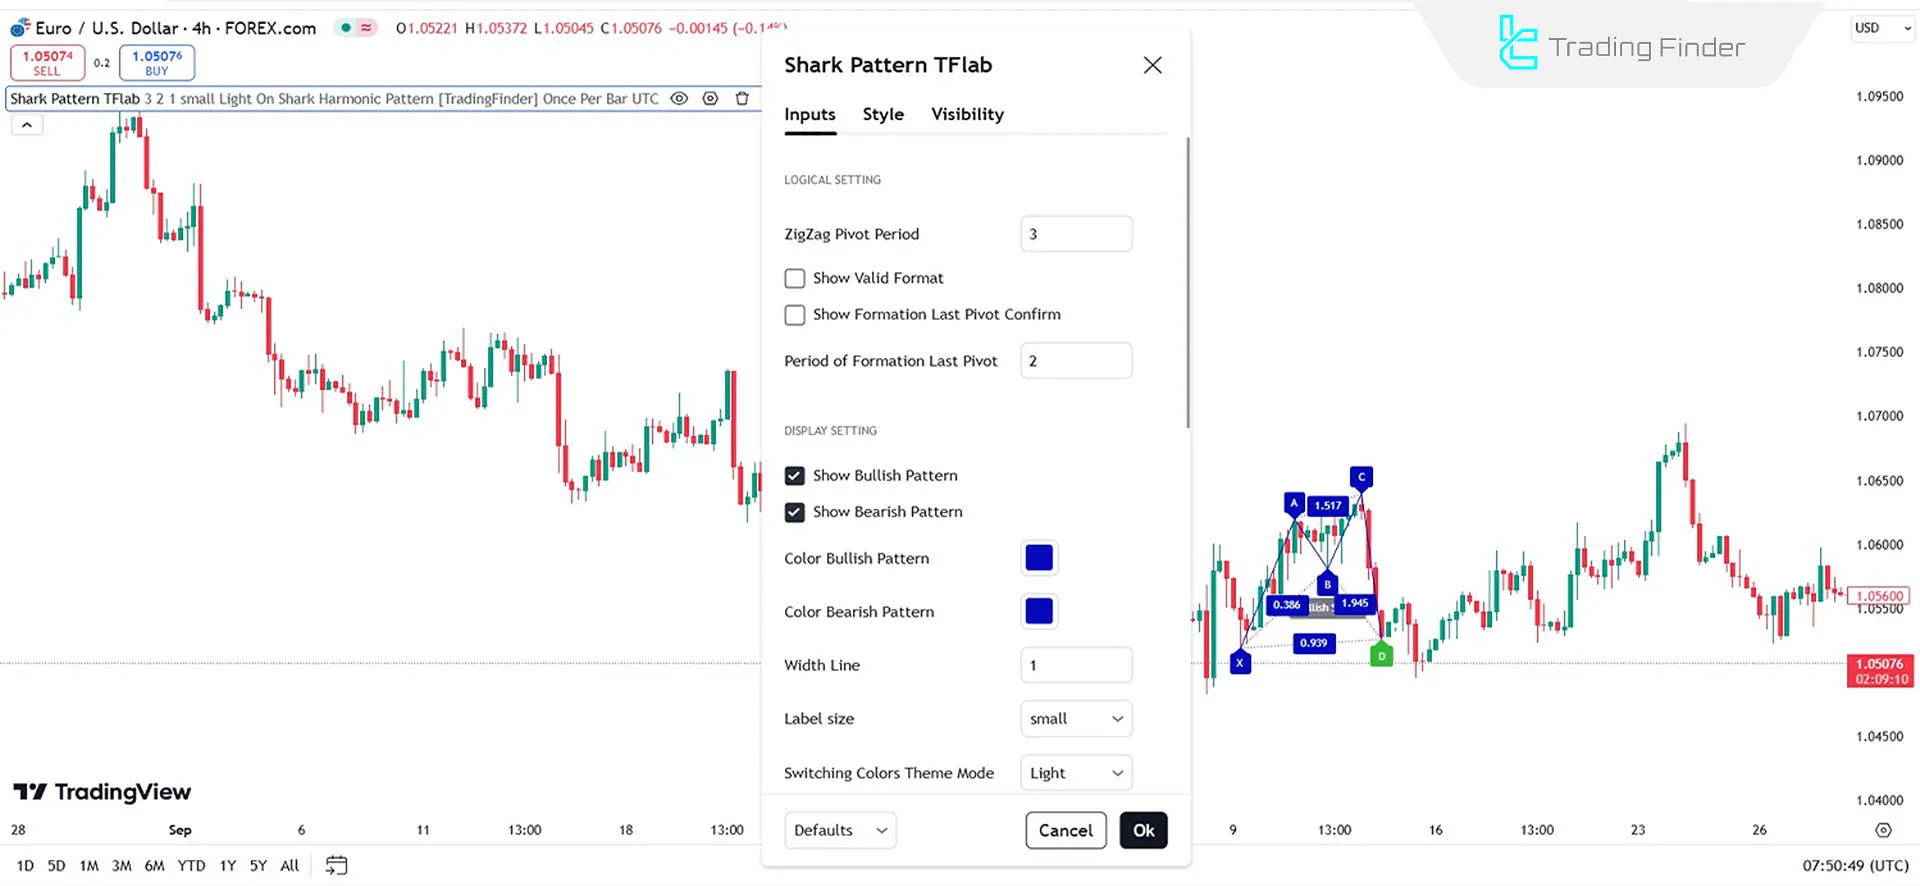
Logical Setting
- ZigZag Pivot Period: Calculates pivot points (default: 3);
- Show Valid Format: Enable/disable valid pattern display;
- Show Formation Last Pivot Confirm: Enable/disable the last pivot confirmation display;
- Period of Formation Last Pivot: Period for calculating the last pivot confirmation.
Display Setting
- Show Bullish Pattern: Enable bullish pattern display;
- Show Bearish Pattern: Enable bearish pattern display;
- Color Bullish Pattern: Set color for bullish patterns;
- Color Bearish Pattern: Set the color for bearish patterns;
- Width Line: Set line thickness (default: 1);
- Label Size: Adjust text label size;
- Switching Colors Theme Mode: Change theme color.
Alert Settings
- Alert: Notification when the pattern forms;
- Alert Name: Custom alert name;
- Message Frequency: Frequency of alert messages when the pattern forms;
- Show Alert Time by Time Zone: Display alert time based on time zone.
Conclusion
The Shark Harmonic Pattern Indicator is useful for identifying the Shark harmonic pattern on price charts.
By leveraging Fibonacci and analyzing the pattern's key points, it automatically marks potential reversal zones (PRZ) on the chart and provides entry signals for trades.
Shark Harmonic Pattern TradingView PDF
Shark Harmonic Pattern TradingView PDF
Click to download Shark Harmonic Pattern TradingView PDFWhat is the Shark Harmonic Pattern Indicator?
It identifies the Shark harmonic pattern using Fibonacci ratios and marks potential reversal zones on the chart.
How are the signals identified?
Signals are identified when the price reaches the PRZ; a buy signal forms with a bullish candle in an uptrend, and a sell signal in a downtrend.


