


The Son Model ICT Indicator is one of the ICT indicators on TradingView. It uses key concepts of this method, such as liquidity, market structure shift (MSS), and fair value gap (FVG), to identify special trading opportunities.
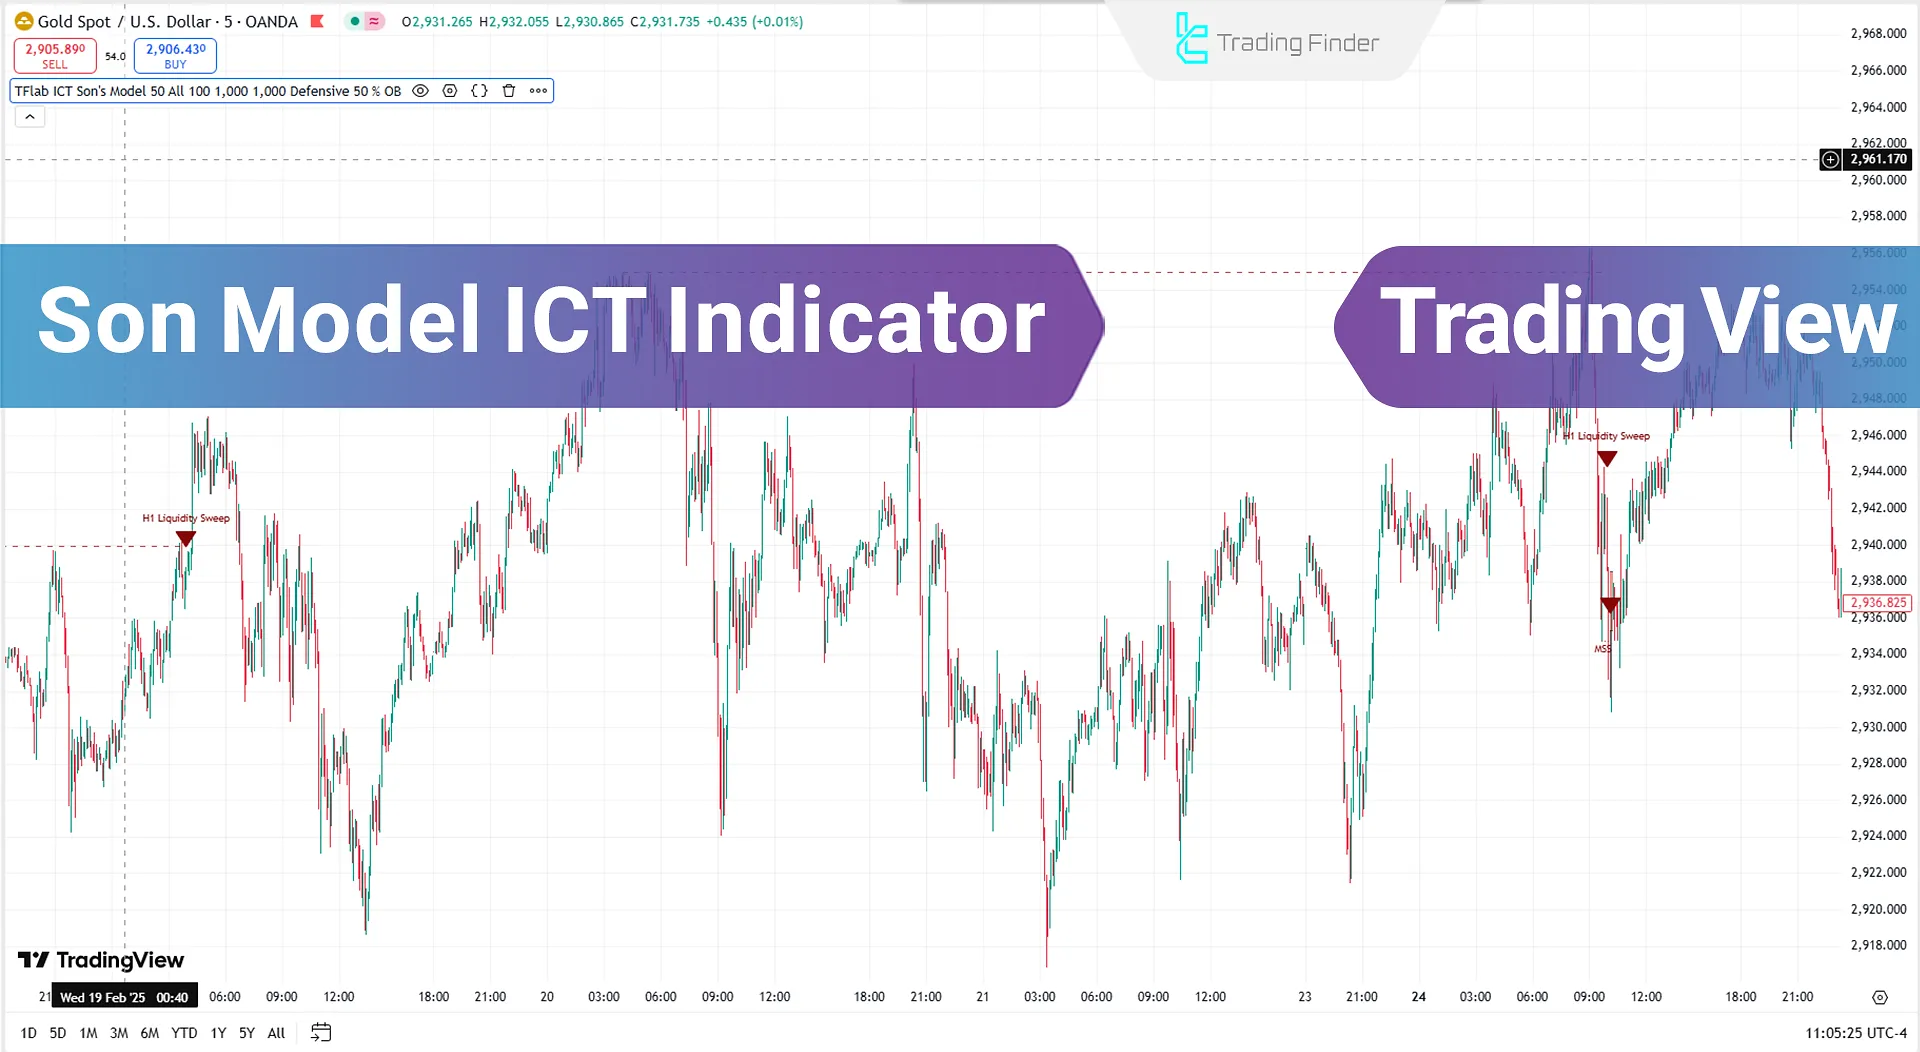
This indicator first issues a liquidity signal by accumulating liquidity in the market, then waits for a market structure shift. Finally, if a fair value gap (FVG) is created and the price returns to this range, traders can enter trading positions.
Son Model ICT Indicator Table
The table below outlines the general specifications of the Son Model ICT Indicator.
Indicator Categories: | ICT Tradingview Indicators Smart Money Tradingview Indicators Currency Strength Tradingview Indicators Liquidity Tradingview Indicators |
Platforms: | Trading View Indicators |
Trading Skills: | Intermediate |
Indicator Types: | Lagging Tradingview Indicators Entry & Exit TradingView Indicators |
Timeframe: | M1-M5 Time Tradingview Indicators |
Trading Style: | Intraday Tradingview Indicators Day Trading Tradingview Indicators Scalper Tradingview Indicators |
Trading Instruments: | TradingView Indicators in the Forex Market Stock Tradingview Indicators Indices Tradingview Indicators |
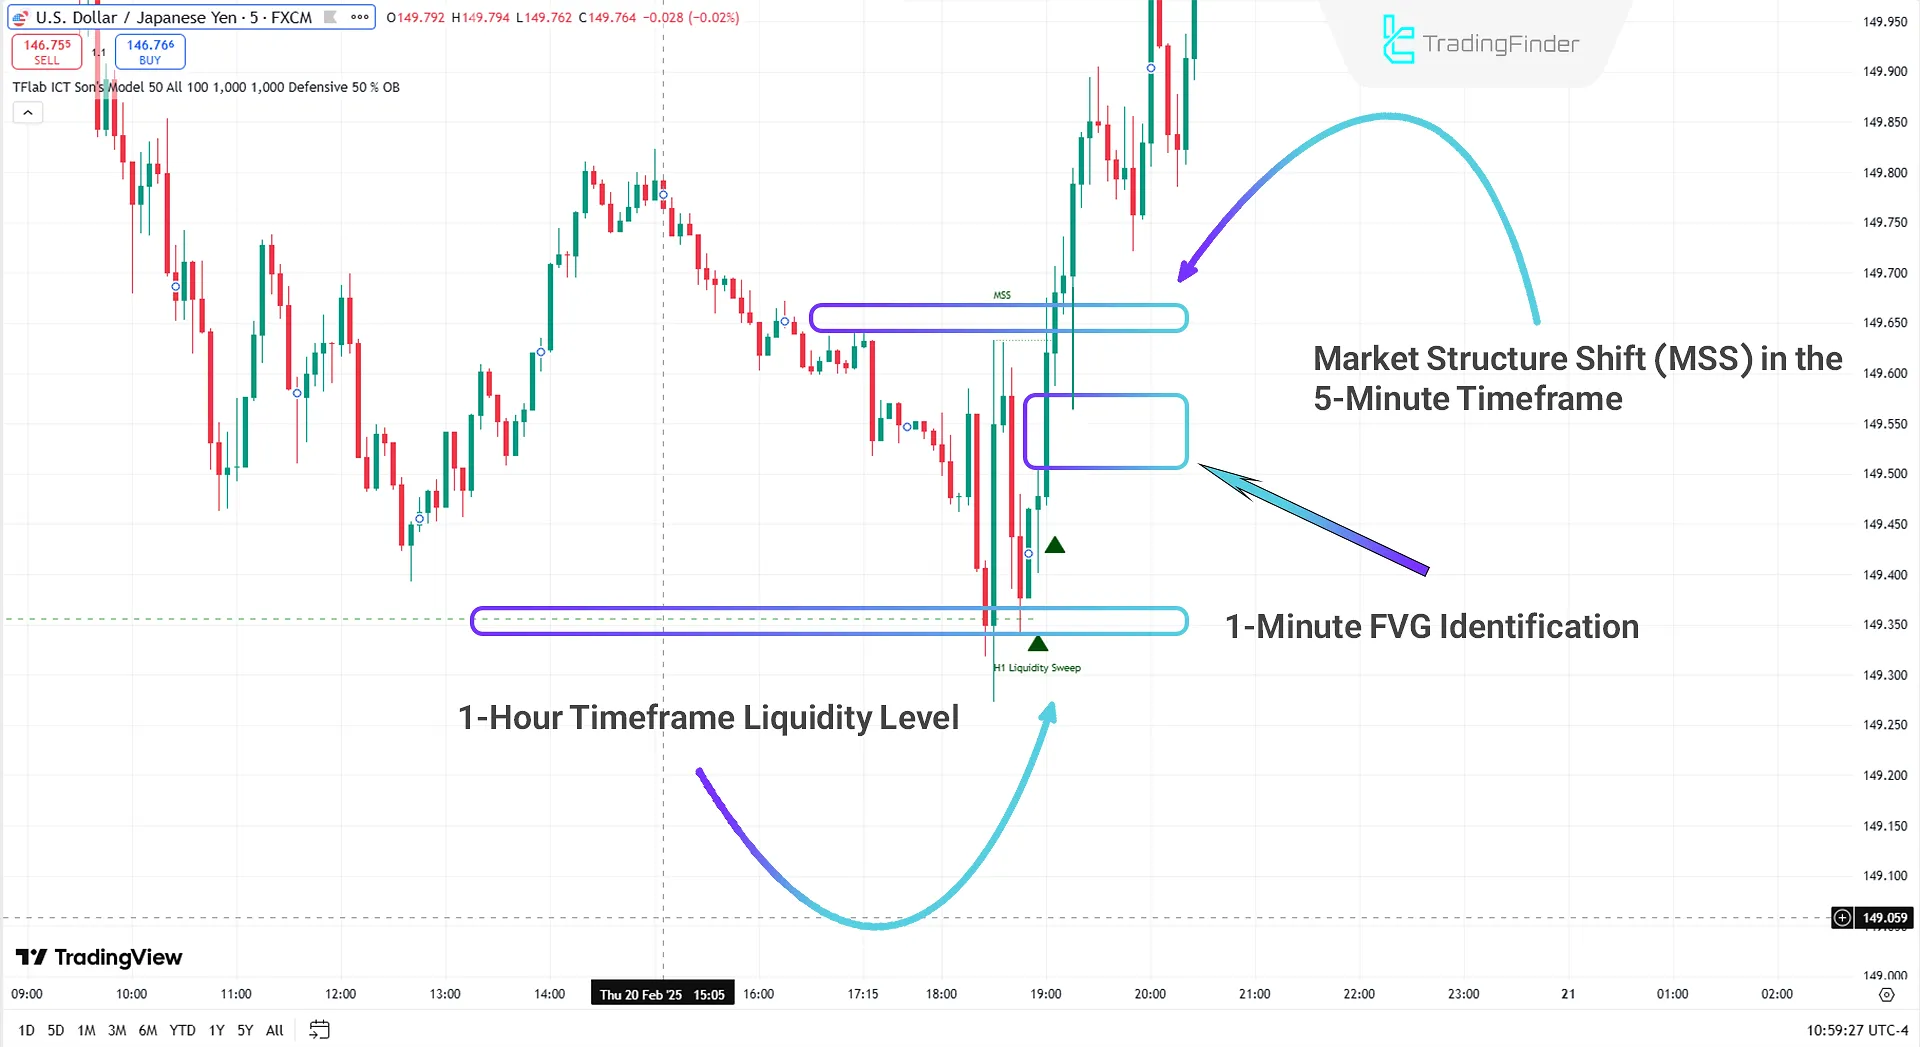
Bullish Trend
In the 5-minute USD/JPY chart, the Son Model ICT Indicator has identified liquidity accumulation in the 5-hour timeframe.
After observing a market structure shift (MSS), the price tested the fair value gap (FVG) range with a shadow and, after reaching this liquidity gap, continued its bullish trend.
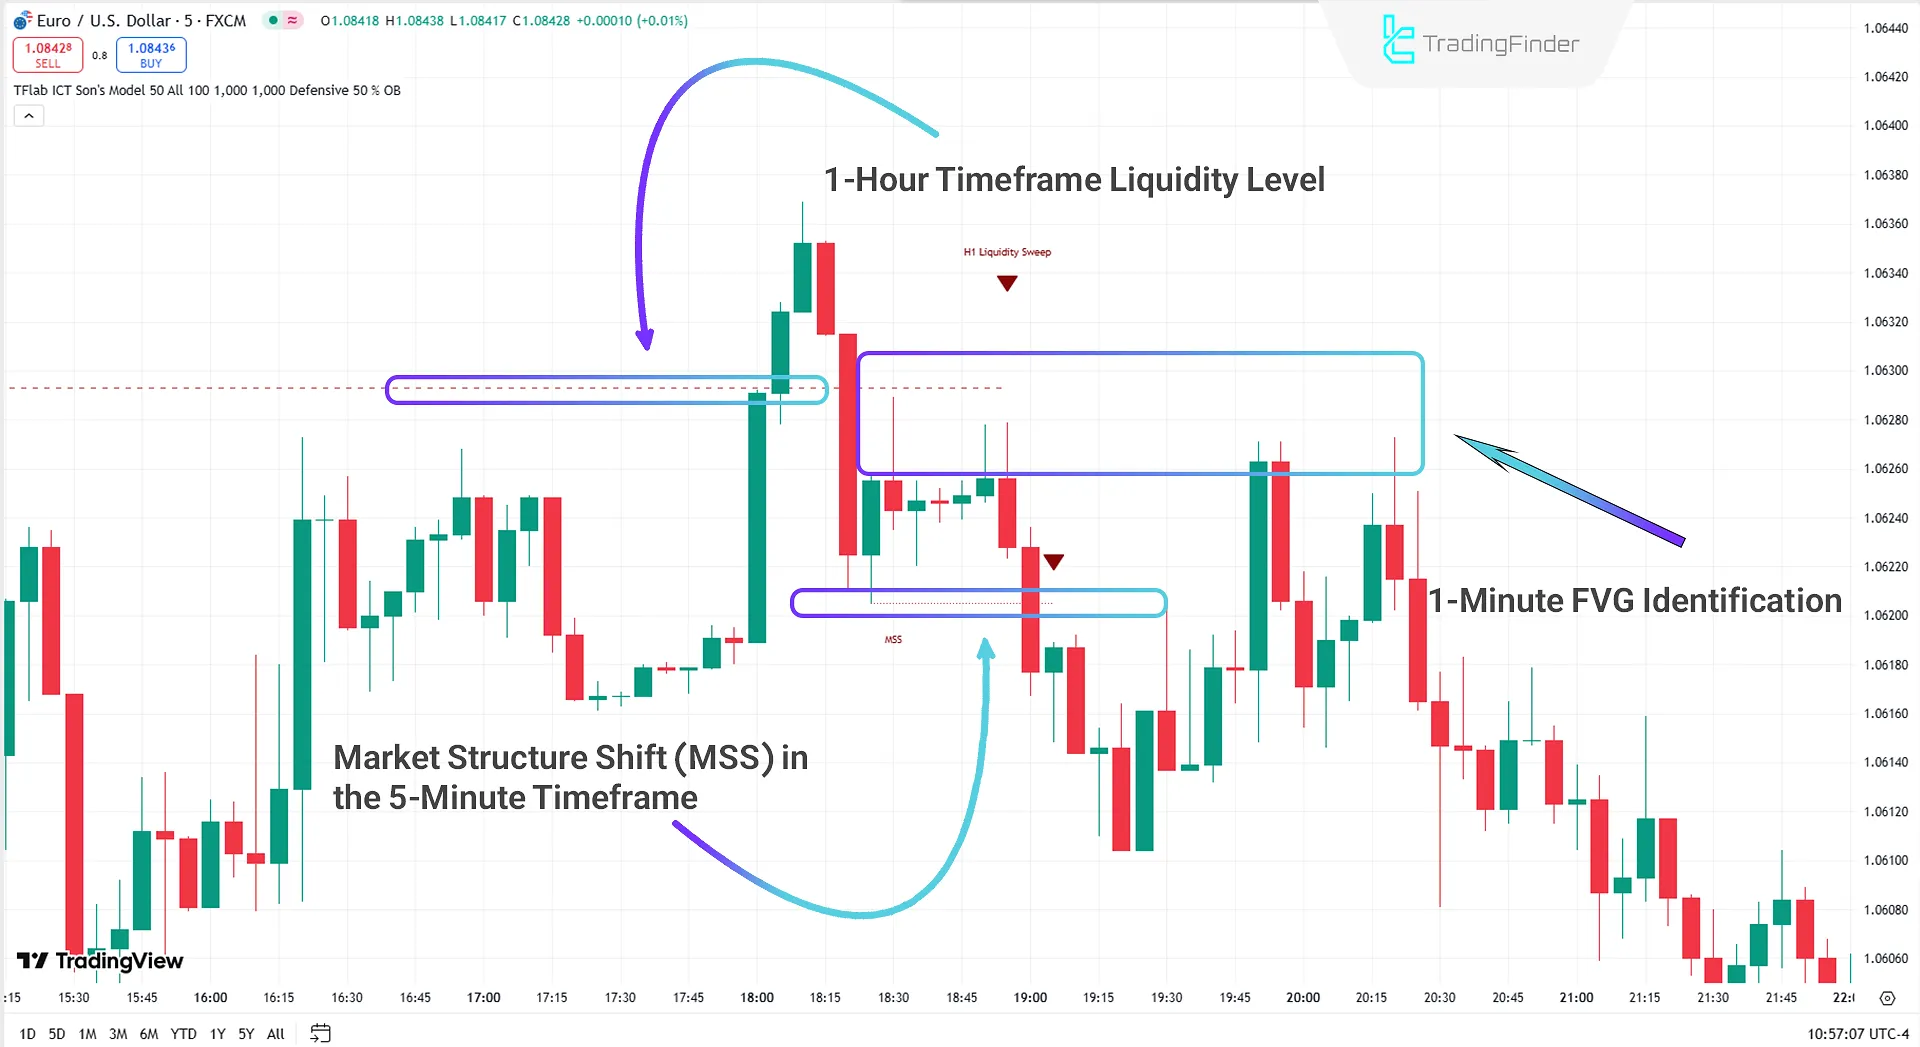
Bearish Trend
In the 5-minute EUR/USD chart, the Son Model ICT Indicator has identified a liquidity level in the 1-hour timeframe.
After accumulating liquidity, the price experienced a downward movement. Following a market structure shift, the price retraced to the fair value gap (FVG) range and began to decline.
Son Model ICT Indicator Settings
The settings for the Son Model ICT Indicator are as follows:
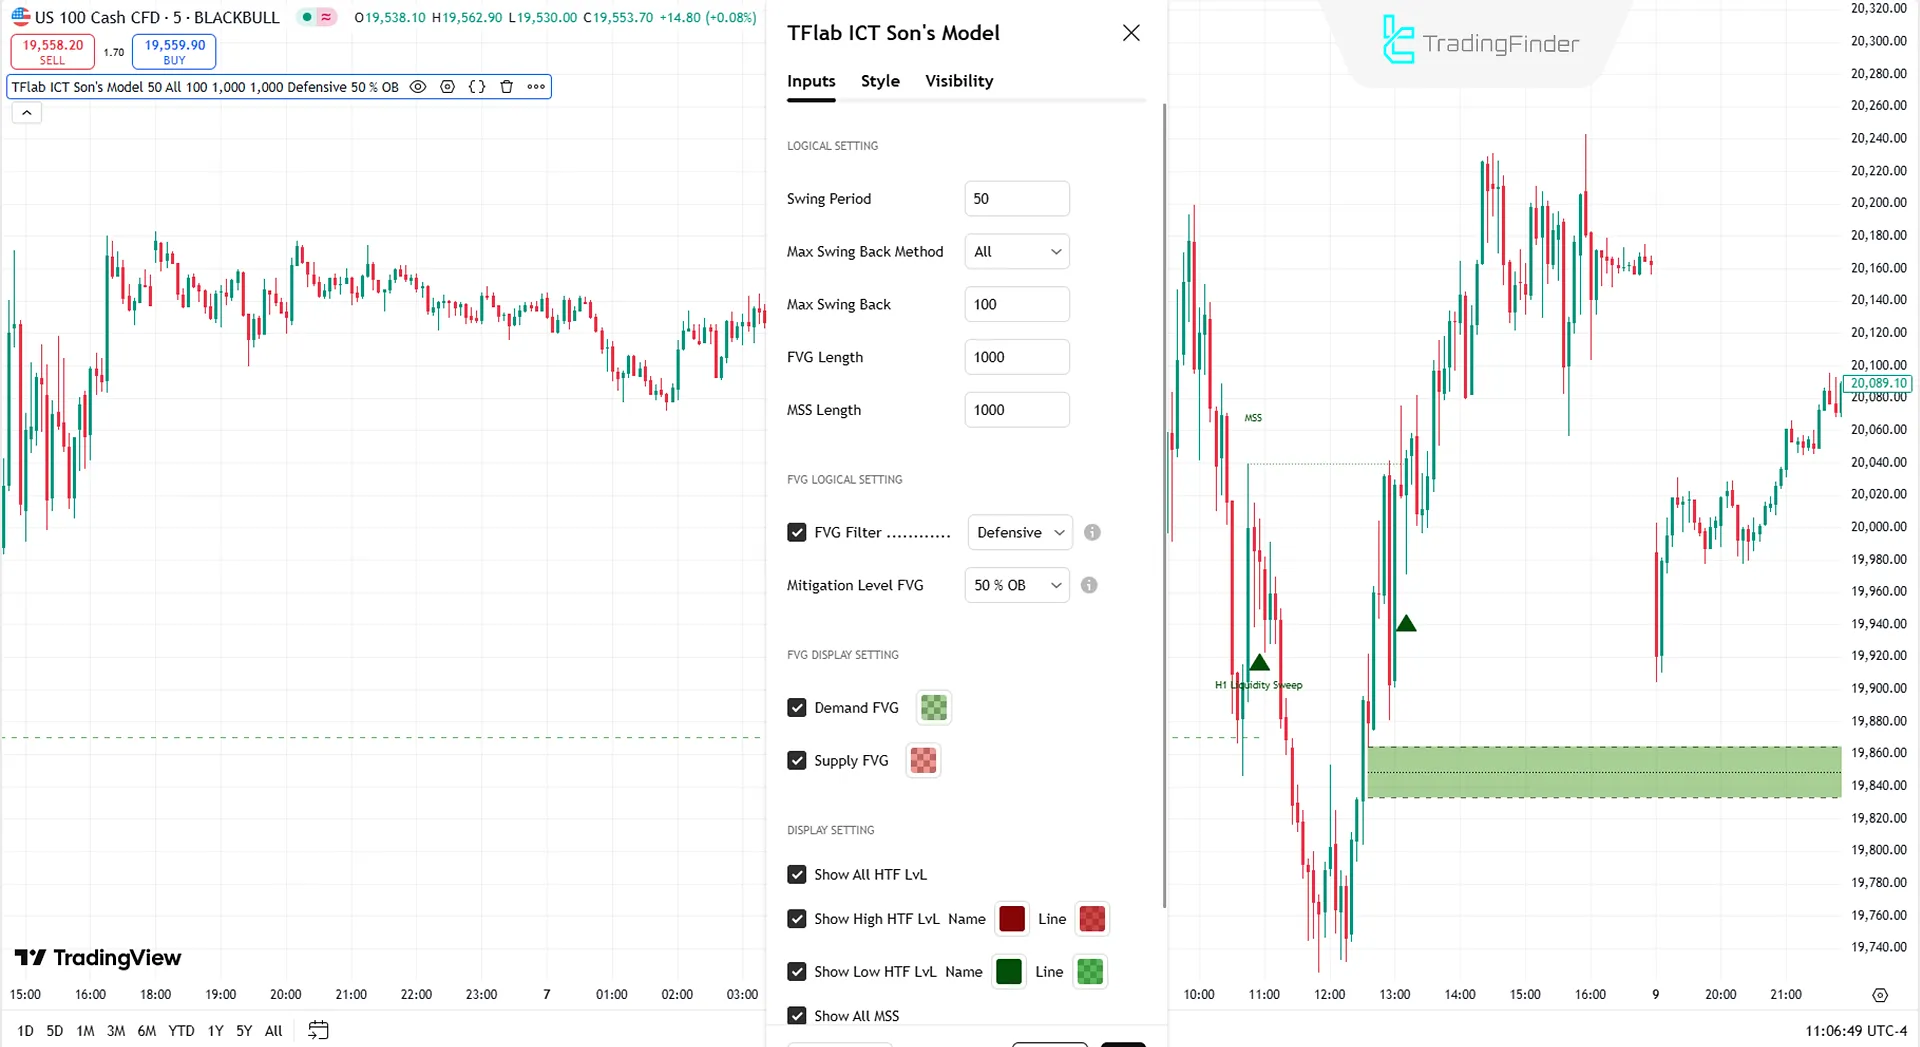
LOGICAL SETTING
- Swing Period: Set the period for identifying swings.
- Max Swing Back Method: Two options: "All" and "Custom".
- In "All" mode, all swings are analyzed.
- In "Custom" mode, only a specified number of swings are analyzed.
- Max Swing Back: Set the number of swings to be analyzed.
- FVG Length: Set the validity length of FVG based on candles.
- MSS Length: Set the validity length of MSS based on candles.
FVG LOGICAL SETTING
- FVG Filter: Filter fair value gaps (FVG) to focus on high-quality signals.
Types of FVG Filters
Below are the types of filters and their functions:
Very Aggressive Filter
- Checks the highest price of the last candle for an upward FVG;
- Checks the lowest price of the last candle for a downward FVG.
Aggressive Filter
- Filters very small middle candles to reduce additional signals.
Defensive Filter
- Requires specific middle candle body size and polarity to increase accuracy.
Very Defensive Filter
- Eliminates small doji candles in the first and third candles to maintain high-quality signals.
- Mitigation Level FVG: The consumption level in the Son Model ICT Indicator is divided into three levels:
- Proximal: Considers the closest FVG level to the price. If the price reaches this level, the FVG becomes invalid.
- 50 Level: Considers the midpoint (50%) of the FVG range as the consumption level.
- Distal: Considers the farthest FVG level from the price. If the price reaches this level, the FVG becomes invalid.
FVG DISPLAY SETTING
- Demand FVG: Enable/disable the display of demand FVG.
- Supply FVG: Enable/disable the display of supply FVG.
DISPLAY SETTING
- Show All HTF LvL: Enable/disable the display of all higher timeframe levels.
- Show High HTF LvL Name: Enable/disable the display of higher timeframe high level names.
- Show Low HTF LvL Name: Enable/disable the display of higher timeframe low level names.
- Show All MSS: Enable/disable the display of all market structure shifts (MSS).
- Show High MSS Name: Enable/disable the display of high MSS names.
- Show Low MSS Name: Enable/disable the display of low MSS names.
Conclusion
The Son Model ICT Indicator is one of the liquidity indicators on TradingView, designed based on ICT concepts and liquidity.
This indicator identifies three key stages to help traders find entry points. First, in the 1-hour timeframe, liquidity levels are identified, and liquidity accumulation occurs.
Then, in the 5-minute timeframe, a market structure shift (MSS) is confirmed. Finally, in the 1-minute timeframe, a fair value gap (FVG) is identified.
After confirming all three stages, traders can perform more specialized analysis on the chart and identify better trading opportunities using this indicator.
Son Model ICT TradingView PDF
Son Model ICT TradingView PDF
Click to download Son Model ICT TradingView PDFWhat is the Son Model ICT Indicator?
This indicator is one of the analytical tools on the TradingView platform, designed based on ICT (Inner Circle Trader) concepts such as liquidity, market structure shift (MSS), and fair value gap (FVG).
How does the Son Model ICT Indicator help traders identify trading opportunities?
This indicator uses multi-timeframe analysis. First, it examines liquidity in the 1-hour timeframe, then looks for a market structure shift (MSS) in the 5-minute timeframe, and finally, if a fair value gap (FVG) is created in the 1-minute timeframe, traders can enter trades after the price returns to this range.


