TradingView
MetaTrader4
MetaTrader5
The Three Drive Harmonic Pattern Indicator (Three Drive) is a powerful reversal pattern in the RTM style that was designed and developed for the Trading View platform.
This TradingView Harmonic Pattern indicator identifies the formation of the three-drive pattern and provides traders with entry signals. The bullish three-drive pattern is formed when three lower lows are created, while the bearish three-drive pattern is formed by making three higher highs.
Traders can quickly identify this strong reversal pattern using the indicator and enter trades when the price reverses.
3 Drive Indicator Table
|
Indicator Categories:
|
Price Action Tradingview Indicators
Harmonic Tradingview Indicators
Chart & Classic Tradingview indicators
|
|
Platforms:
|
Trading View Indicators
|
|
Trading Skills:
|
Intermediate
|
|
Indicator Types:
|
Reversal Tradingview Indicators
Leading Tradingview Indicators
Entry & Exit TradingView Indicators
|
|
Timeframe:
|
Multi-Timeframe Tradingview Indicators
|
|
Trading Style:
|
Intraday Tradingview Indicators
Day Trading Tradingview Indicators
Scalper Tradingview Indicators
|
|
Trading Instruments:
|
TradingView Indicators in the Forex Market
Commodity Tradingview Indicators
Indices Tradingview Indicators
|
Bullish 3 Drive Pattern

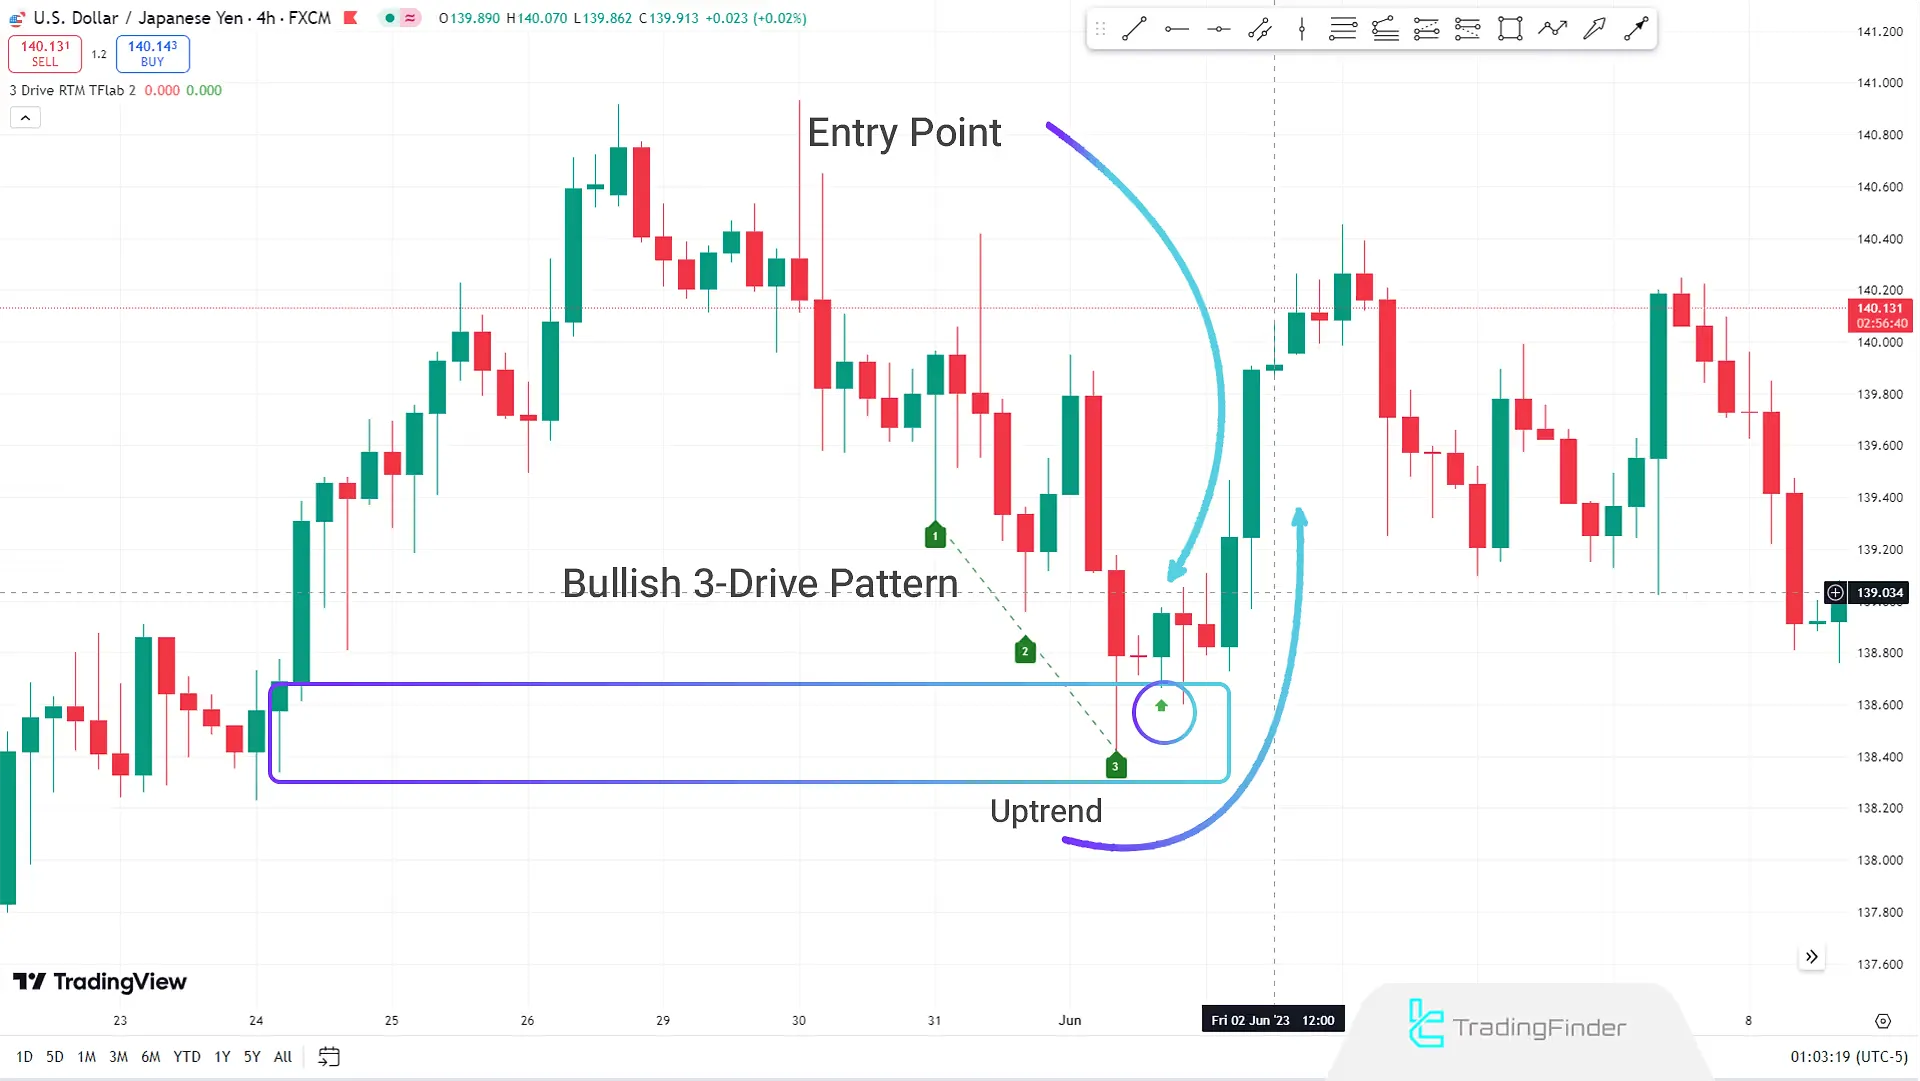
The 4-hour USD/JPY chart, the price moves towards a significant support level and forms a bullish reversal Three Drive pattern. This pattern indicates weakening selling pressure and increasing buyer strength.
The Three Drive Indicator issues a buy signal after forming the third low in the support area. In this pattern, the price is downtrend, creating lower lows.
The second low penetrates below the first low's area and the third low forms within the second low's area. This situation indicates reduced selling pressure and a potential trend reversal.
RTM-style traders can use the signal from the Trading view indicator and enter a buy trade at a suitable entry point after the pattern fully forms.
The profit target is typically the area from which the downward move started and the highs formed during the pattern's formation.
Bearish 3 Drive Pattern

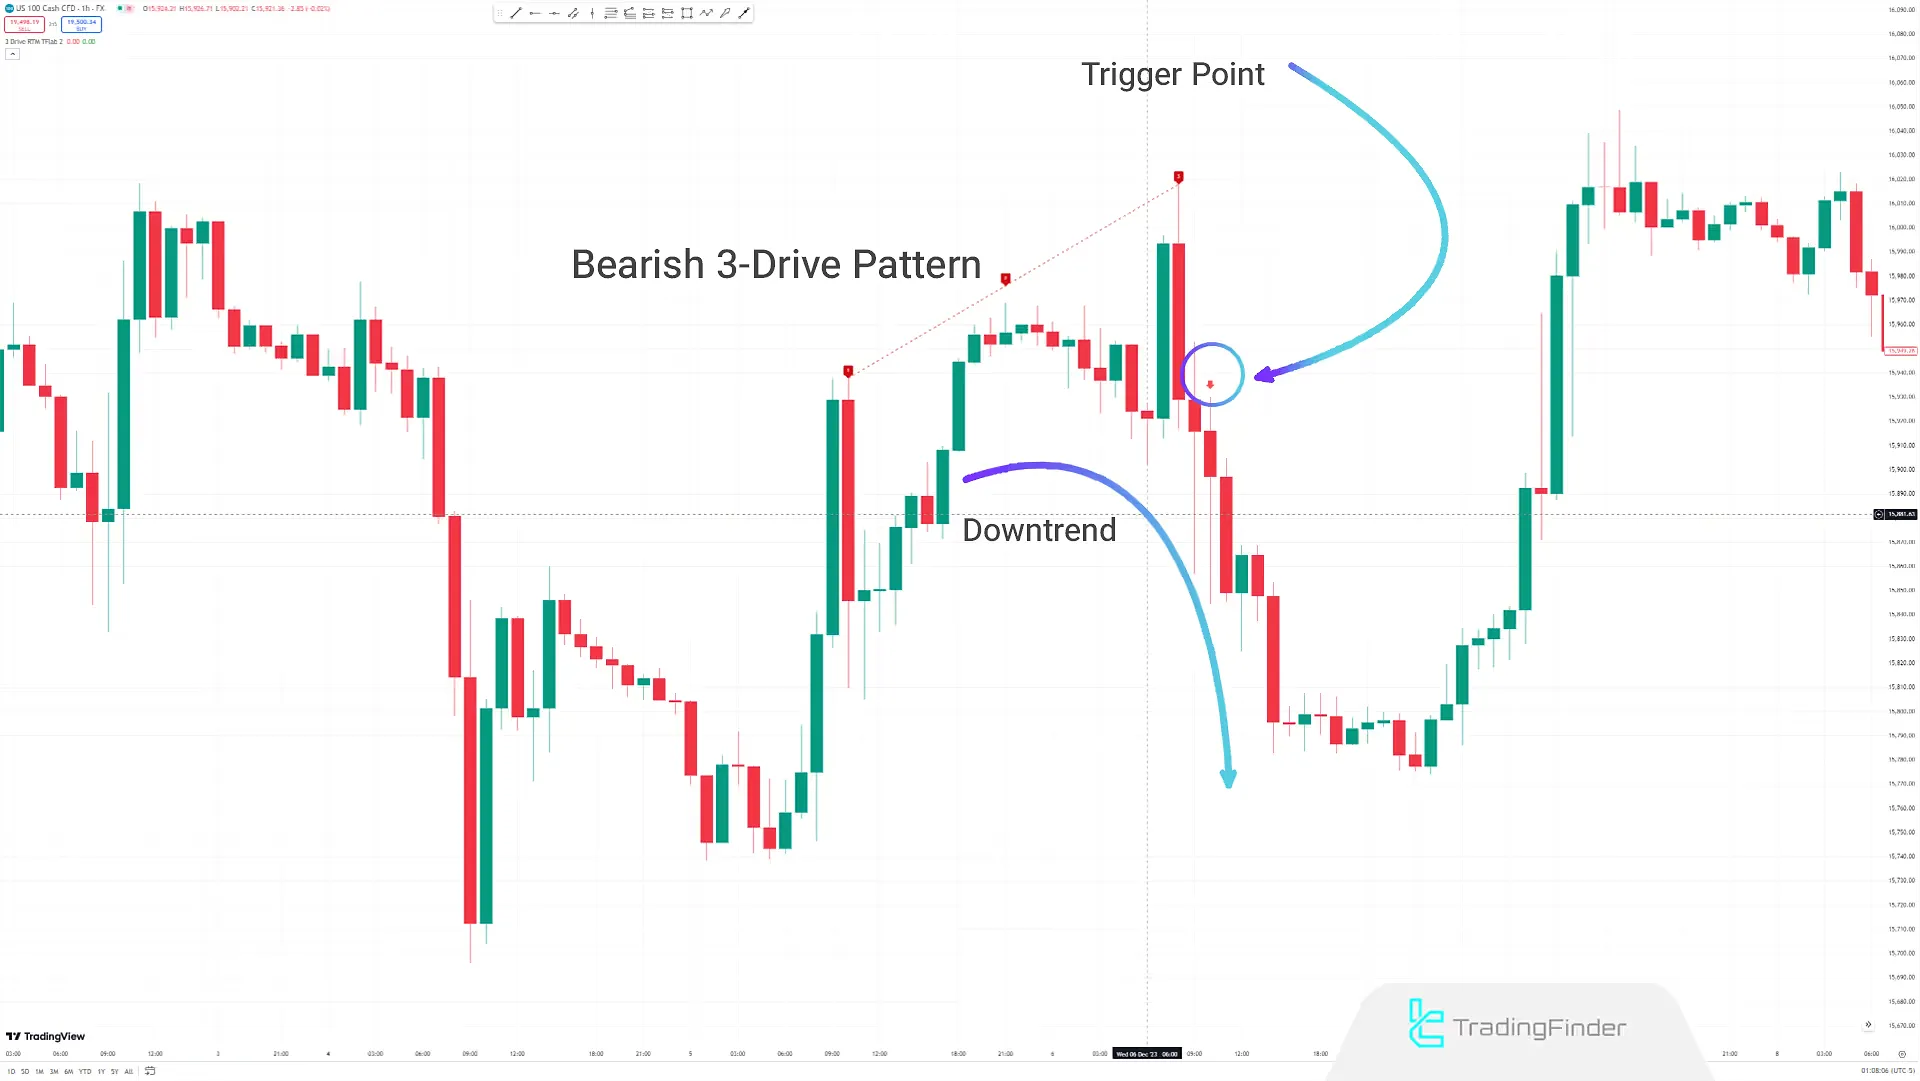
In the 1-hour NASDAQ chart, the price starts to move downward after forming a Three Drive pattern in an uptrend.
The Three Drive Indicator identifies and plots this pattern on the price chart, issuing a sell signal. This signal indicates the entry point for a sell trade (SELL).
A bearish three-drive pattern is formed as follows: In an uptrend, the price first penetrates the first high and creates the second high. Then, the price breaks above the second high and forms the third high.
Completing this pattern indicates a potential trend change to bearish, helping traders enter a sell trade at the right time.
Indicator Settings

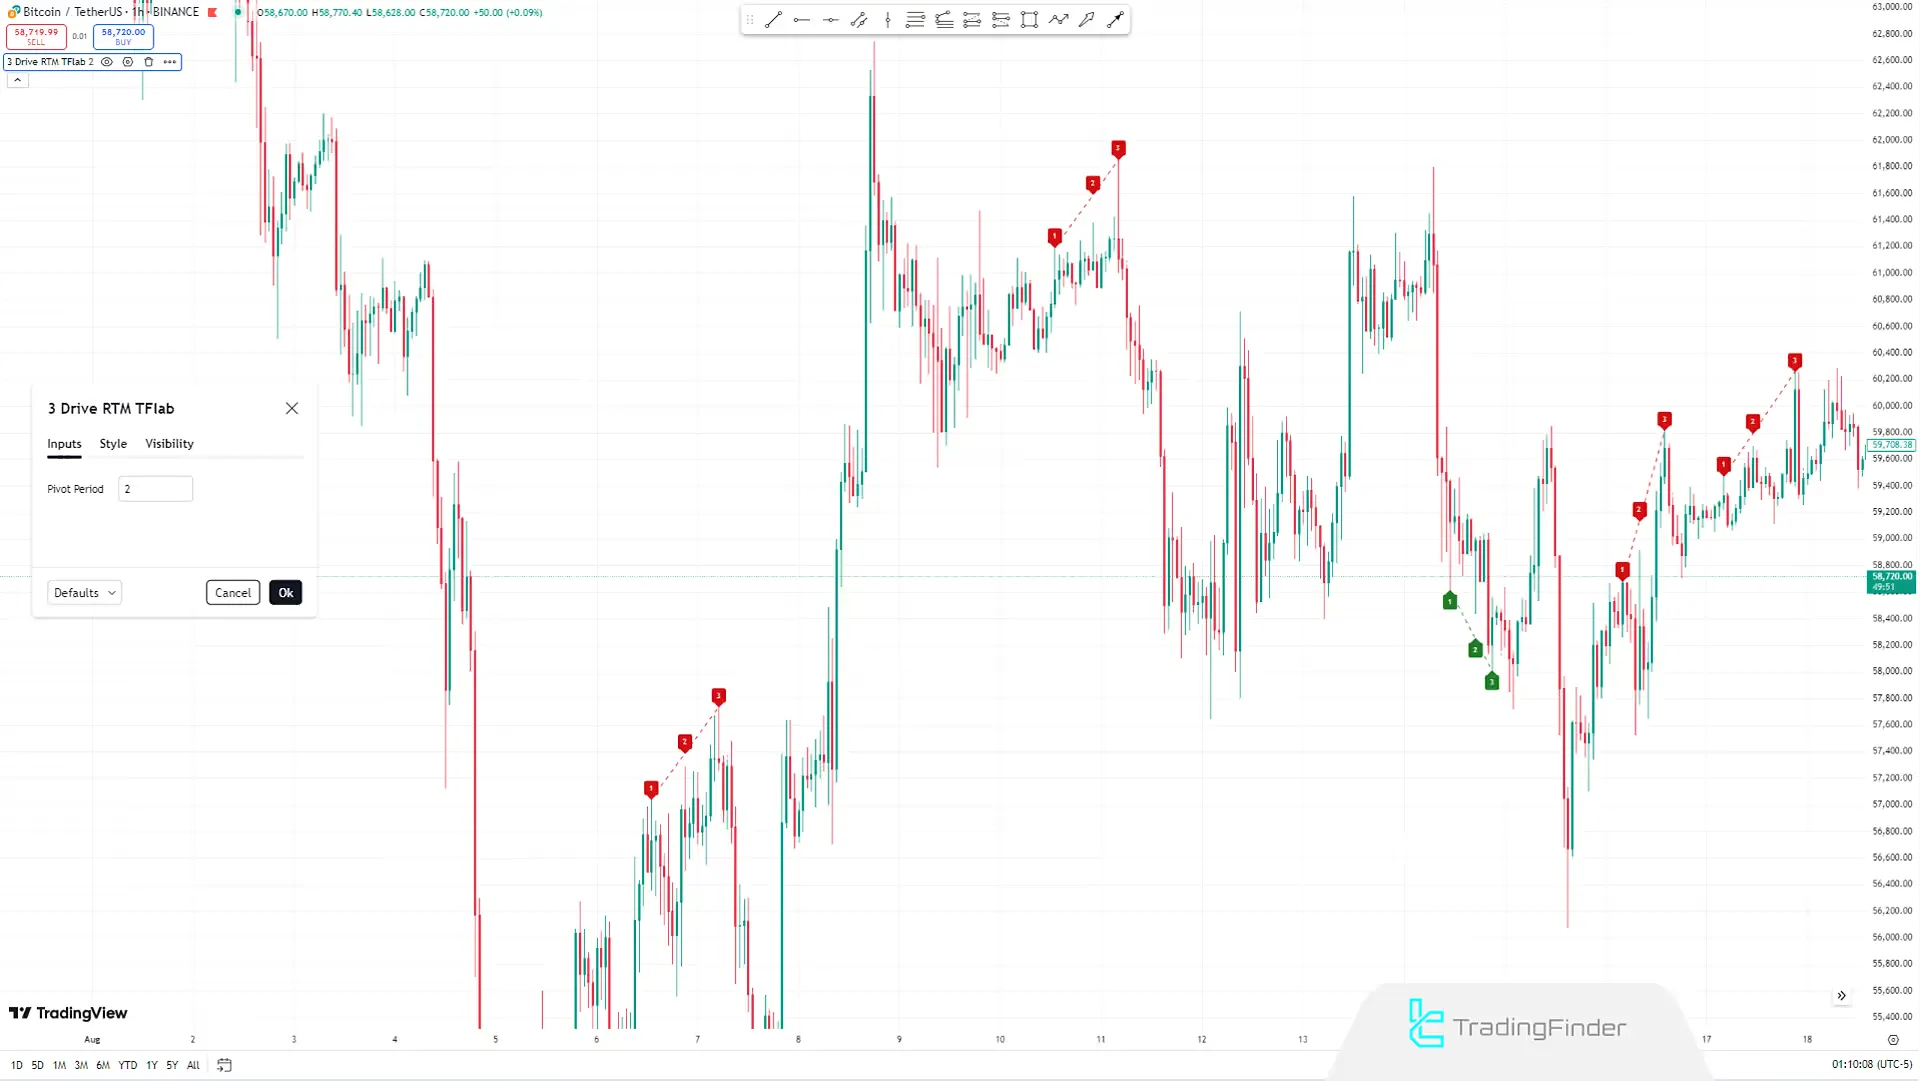
- Pivot Period: Pivot Period Settings (Reversal Axis).
Summary
The Three Drive Harmonic Pattern Indicator is a strong reversal pattern that allows traders to enter trades after the pattern forms.
Although confirmation is not required for entering trades based on this pattern, to reduce trading risks, traders should look for this pattern within supply and demand structures or support and resistance zones.
This approach increases the likelihood of successful trades and significantly reduces risk.
What is the Three Drive Harmonic Pattern Indicator in RTM Style?
The Three Drive Harmonic Pattern Indicator in RTM Style is a technical analysis tool designed to identify harmonic patterns and predict future market movements. This indicator uses its specific algorithms to detect three-drive harmonic patterns on the chart and provides trading signals.
Does using the Three Drive Indicator in RTM Style require advanced knowledge?
Using this indicator requires a basic understanding of technical analysis and harmonic patterns. However, many of its features are automated, making it useful for traders with different levels of knowledge.