


Pivot Point Calculator by TradingFinder
TradingFinder’s Pivot Point Calculator provides insights into determining key price levels and anticipating potential market movements.

What are Pivot Points?
Pivot Points are technical indicators used to determine potential Support and Resistance levels. They are calculated using the previous period’s High, Low, and Close prices.
Pivot Points are particularly useful in markets with high liquidity, such as Forex, Indices, and Commodities, as they provide a mathematical framework for anticipating price action without the need for complex indicators.
How to Calculate Pivot Points?
There are multiple strategies for calculating pivot points based on High (H), Low (L), and Close (C) prices, each with unique formulas and applications.
TradingFinder Forex Pivot Point Calculator’s strategies:
- Fibonacci
- DeMark
- Camarilla
- Woodie
- Floor

Fibonacci Pivot Points
Fibonacci-based pivots use standard calculations but integrate Fibonacci retracement levels.
PP (Pivot Point) | |
R1 (Resistance) | |
R2 | |
R3 | |
S1 (Support) | |
S2 | |
S3 |
DeMark Pivot Points
DeMark’s method is unique as it adjusts the Pivot Point based on the relationship between the opening and closing prices:
X (If Close < Open) | |
X (If Close > Open) | |
X (If Close = Open) | |
PP (Pivot Point) | |
R1 (Resistance) | |
S1 (Support) |
Camarilla Pivot Points
Camarilla Pivot Points are particularly useful for short-term and day trading strategies, as they provide more detailed levels compared to traditional Floor pivot points.
PP (Pivot Point) | |
R1 (Resistance) | |
R2 | |
R3 | |
R4 | |
S1 (Support) | |
S2 | |
S3 | |
S4 |
Woodie Pivot Points
Woodie’s formula places greater weight on the closing price rather than just the average of high, low, and close. This method is particularly popular among day traders and scalpers, as it adjusts pivot calculations based on recent market sentiment.
PP (Pivot Point) | |
R1 (Resistance) | |
R2 | |
S1 (Support) | |
S2 |
Floor Pivot Points
Floor is among the most commonly used methods for calculating pivot points in trading. They are called "Floor" pivots because floor traders initially used them in exchanges to determine potential support and resistance levels for the upcoming trading session.
PP (Pivot Point) | |
R1 (Resistance) | |
R2 | |
R3 | |
S1 (Support) | |
S2 | |
S3 |
How to Use the TradingFinder Pivot Point Calculator in Trading?
Using this tool, you can identify key levels such as Support and Resistance based on historical price data. The process involves 3 simple steps:
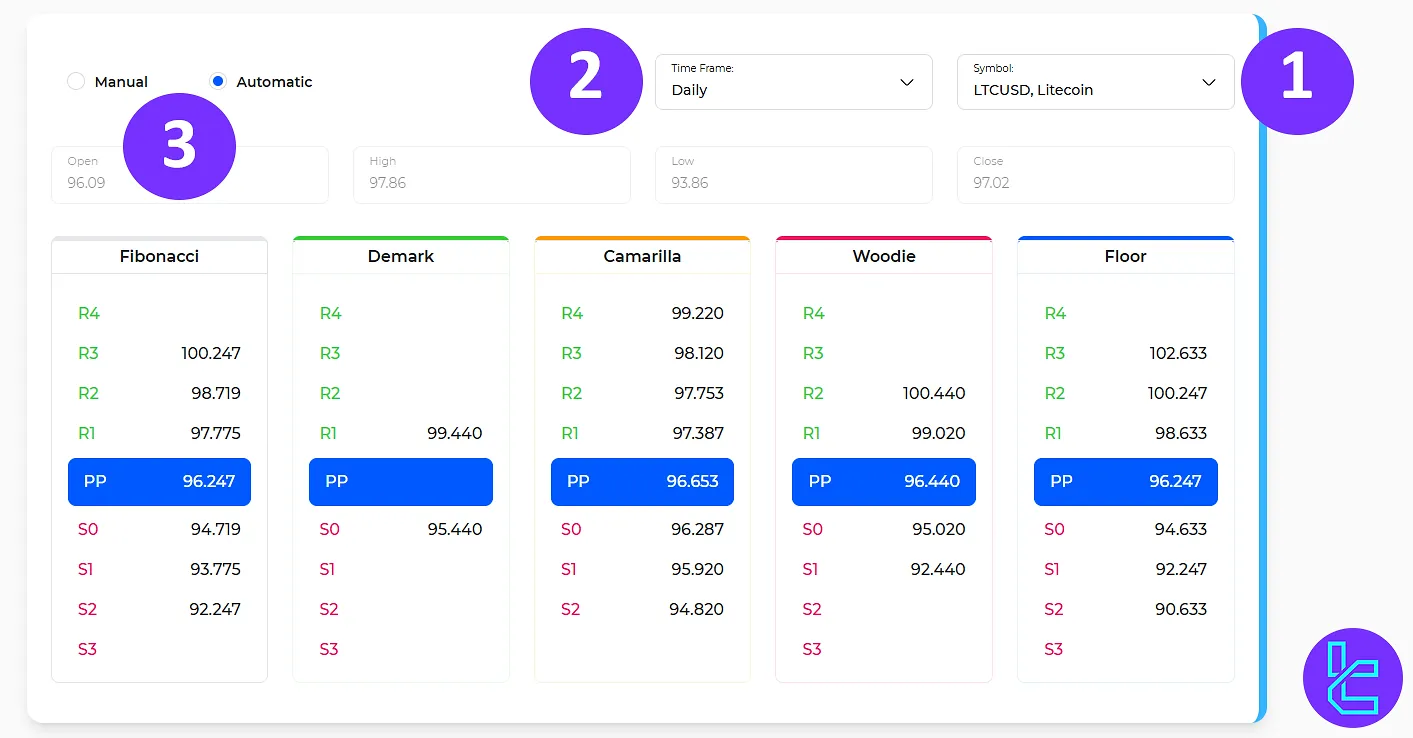
- Select your desired trading symbol;
- Choose the appropriate timeframe based on your trading strategy;
- Choose the price input mode (manual or automatic).
Finally, review the output of each pivot point calculation method and apply the levels in your technical analysis.
For example, If the current price is close to R1, it can be considered a short-term resistance level.
If the price breaks below the Pivot Point (PP), it may indicate a bearish trend, in which case S1 could be used as the next support level.
Applications of TradingFinder's Pivot Point Calculator
The TradingFinder product provides a structured way to analyze price movements, helping traders identify entry, exit, and stop-loss placements.
- Identify Key Support and Resistance Levels: Anticipate price reversals or breakouts by marking key levels where the price will likely face buying (Support) or selling (Resistance) pressure;

- Improve Trade Entry and Exit Points: Buy near support (S1, S2) and sell near resistance (R1, R2) in range-bound markets;
- Works Across Multiple Timeframes and Markets: TradingFinder Pivot Point Calculator can be applied to various timeframes (hourly, daily, weekly, monthly, and yearly) and markets (Forex, Stocks, Indices, Crypto, and Commodities);
- Supports Multiple Calculation Methods: Different pivot calculation methods (Floor, Fibonacci, Camarilla, Woodie, and DeMark) provide alternative perspectives on price movements:
- Fibonacci Pivots are ideal for retracement-based trading;
- Camarilla Pivots are useful for mean-reversion strategies;
- Woodie Pivots adjust more dynamically to recent price action;
- DeMark Pivots factor in opening prices for a different perspective.
- Complements Other Technical Indicators: Pivot Points work well alongside:
- Moving Averages (MA) to confirm trend direction;
- RSI, MACD, and Stochastic Oscillator to identify overbought/oversold conditions;
- Candlestick Patterns to validate reversal signals at pivot levels.
- Helps with Risk Management: Pivot Points provide precise levels for stop-loss and take-profit orders.
Unique Features of TradingFinder Pivot Point Calculator
TradingFinder’s Pivot Point Calculator stands out from standard pivot calculators due to its powerful features, including:
- Multi-Timeframe Support: Pivot Points for different timeframes, including 1m, 5m, 15m, 30m, hourly, 4h, daily, weekly, monthly, and yearly

- Diverse Market Coverage: 150+ trading instruments across multiple asset classes, including:
- Forex: EURUSD, GBPUSD, USDJPY, USDCAD, and many more
- Metals: XAGUSD, XAGEUR, XAUEUR, and XAUUSD
- Indices: SPA35, AUS200, HK50, GER40, USA100, and USA500
- Crypto: BTCUSD, ETHUSD, LTCEUR, XRPUSD, BTCJPY, and more
- Energy: UKOIL and USOIL
- Stocks: AMD, Adobe, Alphabet, Amazon, Apple, and many more

- Automatic vs. Manual Input: Indicating Open, High, Low, and Close values manually or opt for the automatic feature that fetches real-time market data

- Comprehensive Pivot Strategies: Five calculation methods, including Fibonacci, DeMark, Camarilla, Woodie, and Floor
Pivot Point Calculator; A Tool for Novice and Beginners
The TradingFinder Pivot Point Calculator offers multi-timeframes, diverse market coverage, automatic/manual input options, and multiple pivot strategies.
With the TradingFinder Pivot Point Calculator, you can identify key price levels across various markets, including Forex, Commodities, Indices, Stocks, and Cryptocurrencies.


