


Key Points:
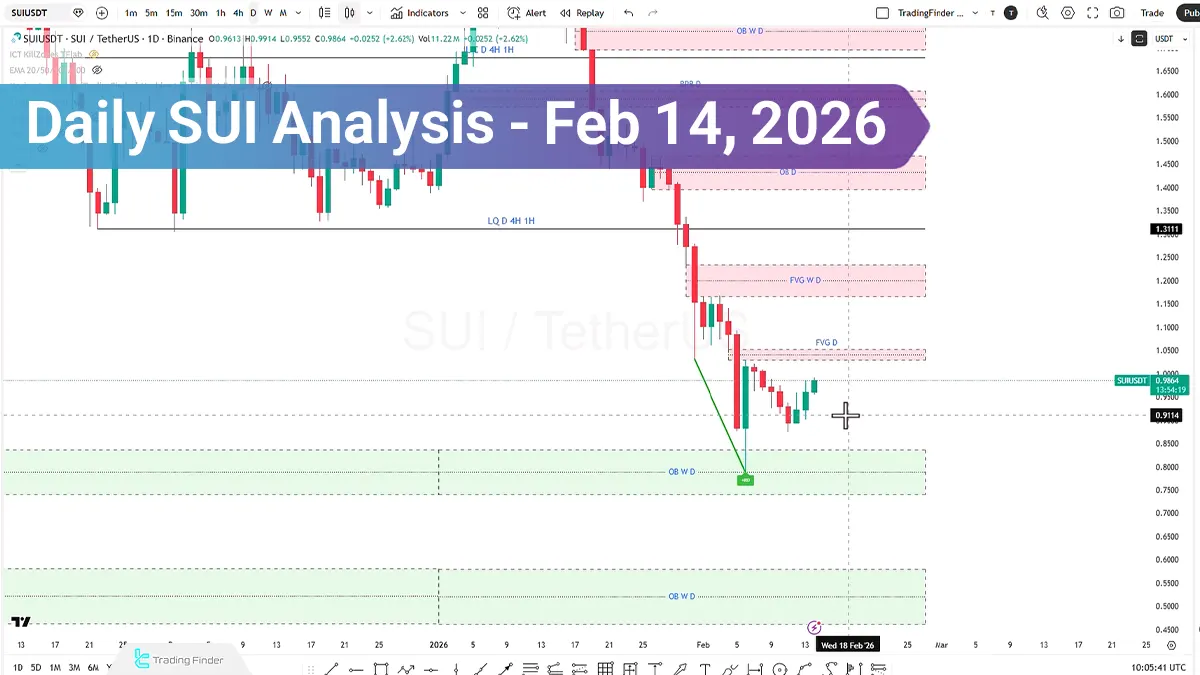
- Sui, after 8 days of consolidation with three consecutive positive closes, has recorded signs of increasing momentum and liquidity and, if the bullish move continues, may target the daily FVG at $1.0523;
- In the 4-hour timeframe, the registration of a bullish Break of Market Structure and MSS has strengthened the market structure; however, entry into the FVG zone could trigger a short-term correction if momentum declines;
- The Relative Strength Index is in the overbought condition and lacks the strength to enter the high-potential zone, increasing the probability of the completion of the short-term bullish wave;
- In the 1-hour timeframe, price positioning within the Rejection Block and negative RSI divergence serve as a warning for a correction toward the $0.9322 level; a valid close above this zone keeps the bullish scenario active;
- In the 15-minute timeframe, the AMD structure (Accumulation–Manipulation–Distribution) and weakness in recent closes strengthen the corrective scenario toward the $0.9599 and $0.9323 levels.
After 8 days in a consolidation phase, Sui price has moved inside an ERC candle and has closed positively over the past three days. This behavior indicates increasing Momentum and growing liquidity in the market.
If the bullish movement continues, price may collect Buy Side Liquidity and enter the daily Fair Value Gap (FVG) at the 1.0523 level.
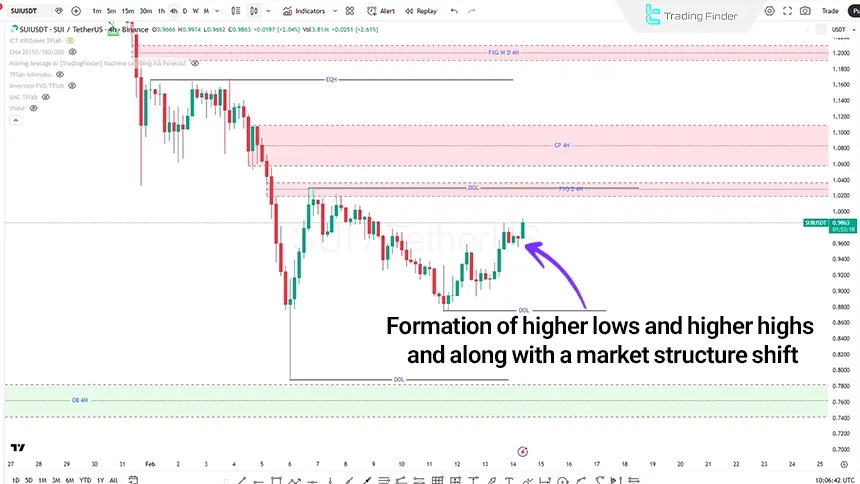
Sui Analysis in the 4-Hour Timeframe (H4)
In this timeframe, after a Break of Structure (BOS), price formed higher lows and higher highs and registered a bullish Market Structure Shift (MSS).
The market is currently experiencing increasing liquidity, and two scenarios can be considered.
Corrective Scenario:
- Price entry into the Fair Value Gap (FVG) zone;
- Collection of Buy Side Liquidity;
- Start of a bearish move with declining momentum.
Bullish Continuation Scenario:
- Registration of bullish Displacement;
- Close above the FVG zone;
- Continuation of movement toward the Continuation Pattern zone.
A multi-timeframe review of the Relative Strength Index (RSI) shows that the indicator has entered the overbought zone but lacks sufficient momentum to move into the high-potential area; this condition may signal the completion of the bullish correction.
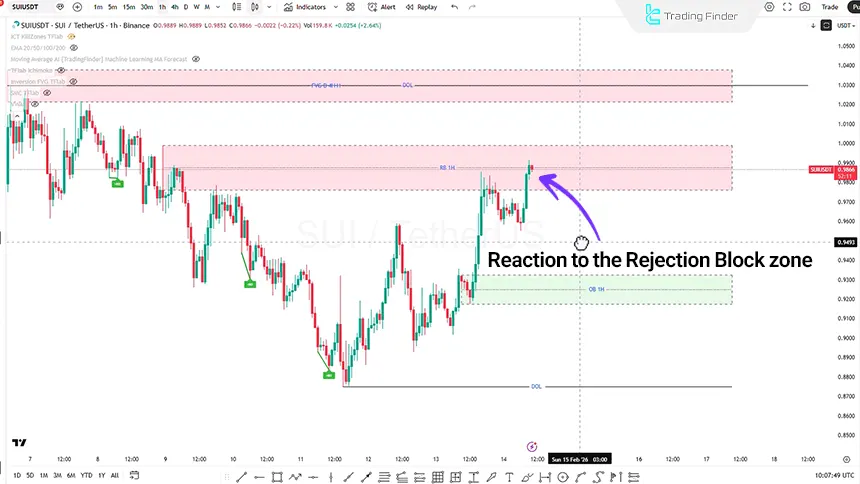
Sui Analysis in the 1-Hour Timeframe (H1)
Price is positioned within the 1-hour Rejection Block. Additionally, in this timeframe, negative divergence is observed in the Relative Strength Index (RSI); price is registering higher highs while the RSI is forming lower highs, which can be interpreted as confirmation of weakening bullish momentum.
Scenarios:
- If price fails to close above this zone and stalls within the same area, the probability of bearish momentum formation increases;
- The corrective target could be the 1-hour Order Block at the 0.9322 level.
If a valid close occurs above the Rejection Block, the probability of bullish continuation and targeting higher price highs increases.
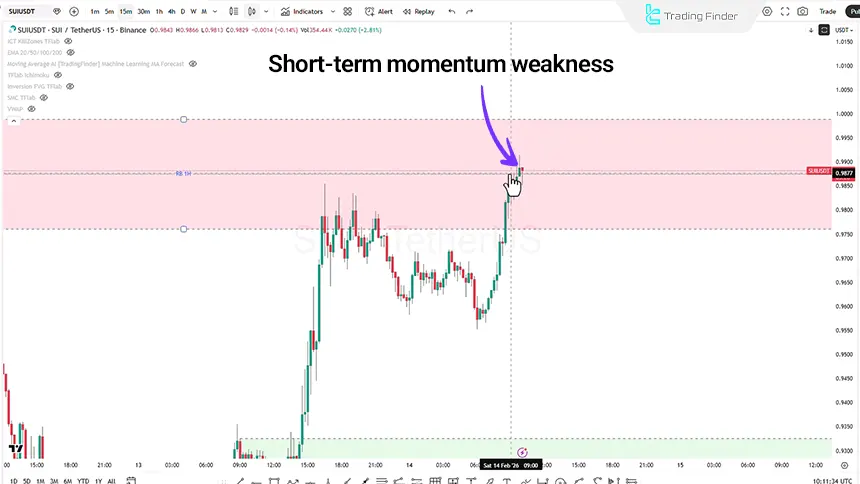
Sui Analysis in the 15-Minute Timeframe (M15)
In the 15-minute timeframe, a consolidation range initially formed, considered as the Accumulation phase. After that:
- A bearish Manipulation move occurred;
- Then a bullish Distribution move formed.
This structure aligns with the AMD (Accumulation–Manipulation–Distribution) strategy framework. In the last four candles, price has failed to register a close above the previous candle, indicating short-term momentum weakness.
If the correction continues, short-term targets may include:
- The 0.9599 level;
- The Proximal Order Block zone at the 0.9323 level.
Conclusion
In the daily timeframe, Sui has shown signs of strengthening bullish momentum; however, entry into FVG zones and overbought conditions in the RSI increase the probability of correction completion.
In lower timeframes, negative divergence and weakness in consecutive closes reinforce the corrective scenario. Until strong closes above resistance zones are registered, the market may remain in a corrective or ranging phase, and the final decision will depend on price reaction within key zones.


