


Key notes:
- Copper price holding above the previous weekly Close reflects a bullish bias, with a potential move toward Buy Side Liquidity if price stabilizes above the $6.15 level;
- A bearish divergence on the Multi RSI indicator shows weakening momentum, suggesting a possible short-term correction before continuation of the broader trend;
- On the daily timeframe, the presence of an Order Block and upper liquidity zone may attract price toward higher levels;
- Price reaction to the key levels of $6.15, $6.157, and $5.6053 may determine the next directional move based on liquidity and momentum shifts.
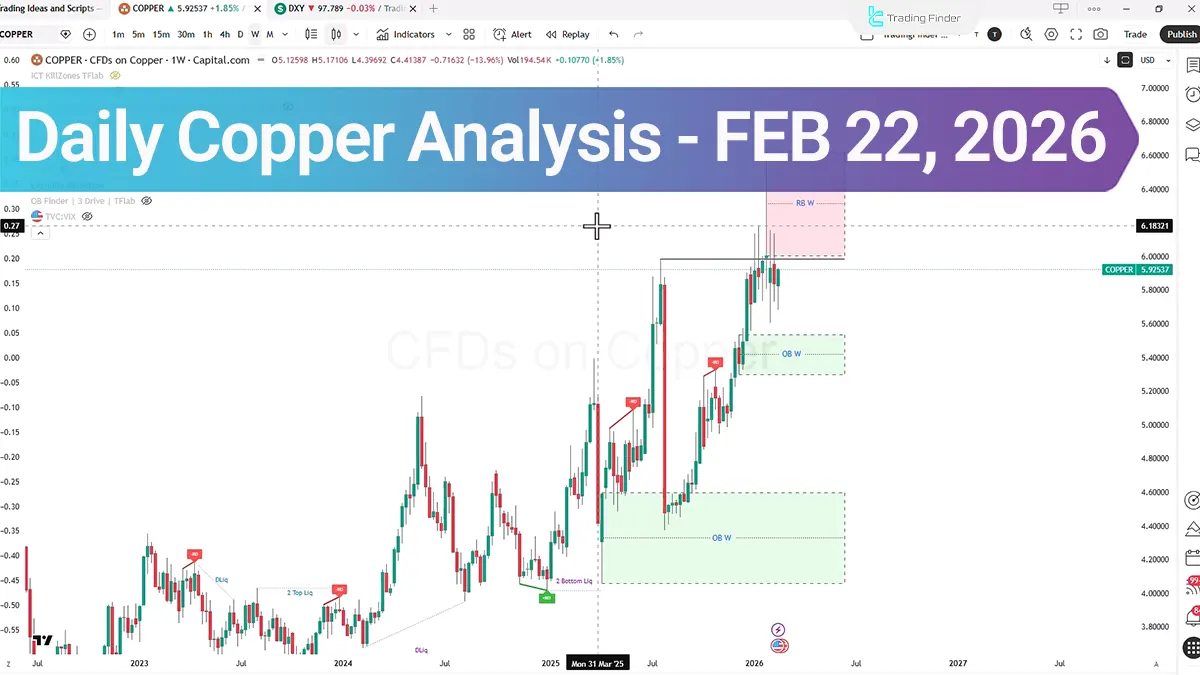
Over the past week, after a liquidity sweep, copper price managed to stabilize once again above the previous weekly Close, which may indicate the preservation of a bullish bias within the market structure.
Conversely, if after collecting Buy Side Liquidity, the price once again closes within the weekly candle range, it may indicate increased selling pressure and the targeting of lower levels in the coming weeks.
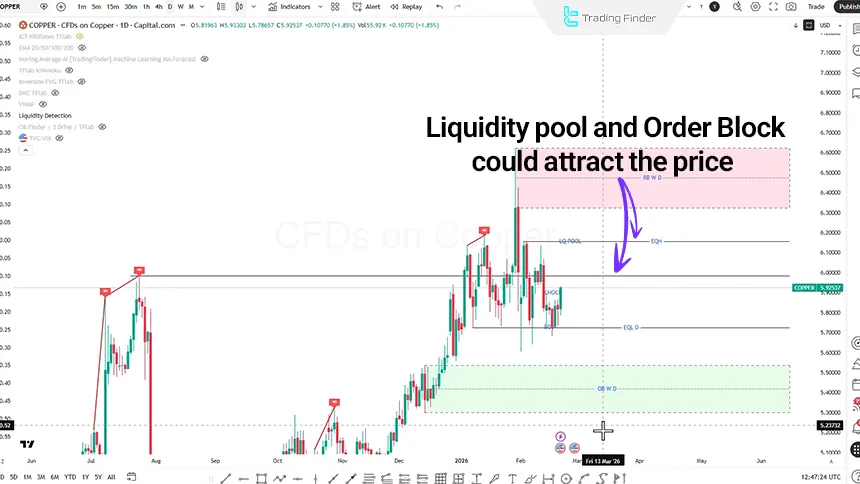
XCUUSD Analysis on the Daily Timeframe
In the daily timeframe, after a strong bearish candle and a Stop Hunt, the price has entered a bullish corrective phase and in the latest candle has managed to record a close above its previous five candles; a factor that may indicate a positive bias in this timeframe.
- The presence of an Order Block zone and a liquidity pool in the upper section may act as a price attractor;
- If the price aligns with the bullish trend and forms a Pin Bar in the candle’s shadow, after a structure break or Change of Character (CHoCH), it would be possible to evaluate a sell position targeting Sell Side Liquidity.
On the other hand: If the price, with positive momentum, breaks the Order Block zone with bullish Displacement and closes back within it, this behavior may be considered as liquidity collection and serve as the basis for entering a sell position targeting the $5.6053 level.
In case of price stabilization above the equal highs zone at the $6.157 level, the probability of entering the optimized weekly rejection block in the daily timeframe will increase.
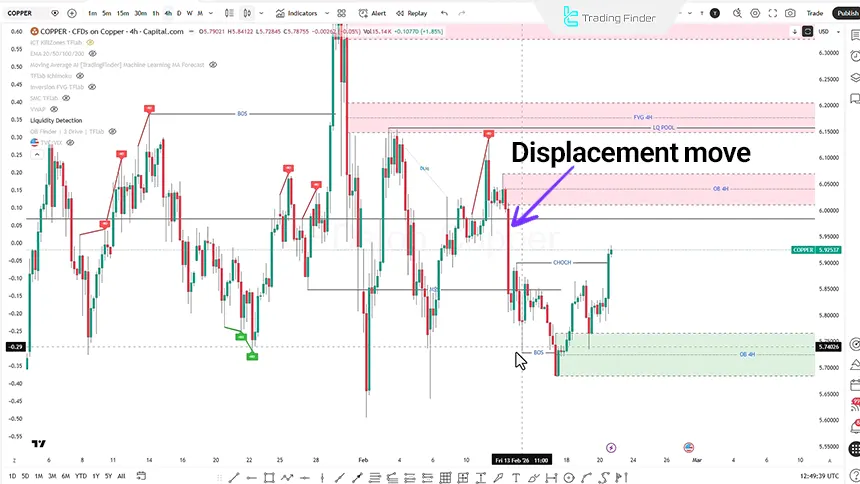
Copper Analysis on the 4-Hour Timeframe (H4)
In the 4-hour timeframe, price movement began with bearish Displacement, which after a Break of Structure (BOS) returned to the zone and resulted in the formation of a Swing Failure Pattern.
- A pullback to the Order Block zone could have provided an opportunity to enter a buy position;
- After that, price moved aggressively upward and successfully broke the Change of Character (CHoCH) level, which may indicate a phase shift from bearish to bullish.
In this condition, in case of a pullback to the Fair Value Gap (FVG) zone or broker block, and upon identifying weakness in the bearish trend along with a candlestick confirmation.
Entry into a buy position with stop loss placed behind the Order Block candle and a risk-to-reward ratio of 1:1 or 1:2 would become feasible.
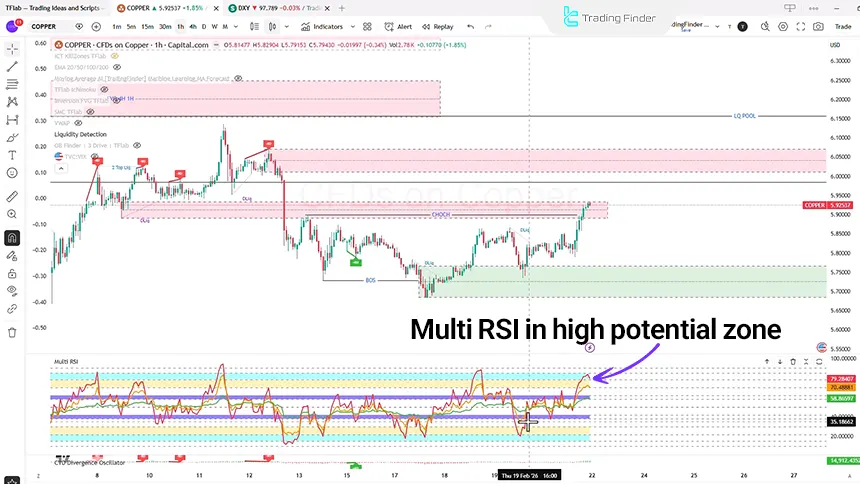
XCUUSD Analysis on the 1-Hour Timeframe (H1)
In the 1-hour timeframe, copper price has entered the Unicorn zone but signs of weakness in the bullish trend are observed.
Analysis of the Multi RSI indicator with 7 and 14 periods shows that both have stabilized in the overbought zone, which may indicate continuation of the bullish trend after a short-term correction.
- Price may enter the Fair Value Gap zone or, with increasing selling pressure, collect Sell Side Liquidity;
- Reaction to the Order Block zone may serve as the basis for continuation of the bullish trend and targeting higher zones including FVG or upper Order Blocks.
Conclusion
The overall structure of the copper market shows a tendency to maintain the upward trend; however, the presence of bearish divergence in the Multi RSI indicator and price positioning within key zones has increased the chances of a short-term correction.
Price reaction to the $6.15, $6.157, and $5.6053 levels may play a key role in determining the next market direction from a momentum and liquidity structure perspective.


