


Key Points:
- Ripple remains in a bearish-leaning market structure across most timeframes;
- On the weekly timeframe, the occurrence of a Liquidity Sweep without a valid close below the swing point, along with price reaction to the MA/EMA 200, indicates price support;
- A weekly close below the EMA 200 could pave the way for price movement toward the weekly Fair Value Gap (FVG) around $0.8564;
- On the daily timeframe, the collection of Sell Side Liquidity and the formation of a Swing Failure Pattern, accompanied by bullish momentum, increases the probability of a bullish correction toward the Order Block around 1.8285;
- On the 4-hour timeframe, despite the lack of a market structure break, increasing selling pressure may drive price toward the daily Order Block, where reactions are expected to provide only short-term trading opportunities with controlled risk;
- On the 1-hour timeframe, failure to stabilize above the MA 100 strengthens the probability of continued bearish movement, and buy scenarios will only be valid if Sell Side Liquidity is collected and confirmed by candle structure.
On February 7, 2026,Ripple’s representative, price behavior across several major timeframes including monthly, (weekly, daily, 4-hour, and 1-hour) has been examined. The overall market structure is still assessed as bearish, however, in some timeframes, signs of buying pressure, liquidity accumulation, and the formation of potential reversal scenarios are observed.
XRP Analysis on the Weekly Timeframe (Weekly)
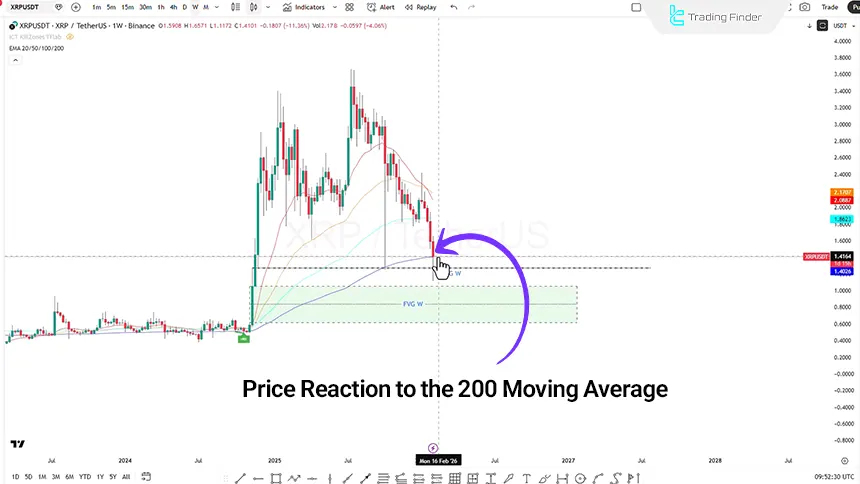
On the weekly timeframe, price action reflects only a liquidity grab or Liquidity Sweep from a Swing Point, without a successful candle close below the swing point area. This price behavior has subsequently been accompanied by buying pressure.
However, analysis of the Relative Strength Index (RSI) on the weekly timeframe shows that the indicator has entered a high-potential zone, which may indicate the continuation of bearish pressure in the market.
On the other hand, the 200 Moving Average (MA 200) has shown a meaningful price reaction in this timeframe and is considered a high-importance support level.
If price closes below the 200 Exponential Moving Average (EMA 200), the bearish scenario will be strengthened, and price may move toward the weekly Fair Value Gap (FVG) at the $0.8564 level. This zone may serve as a potential area for evaluating Buy strategies moving forward.
Ripple Analysis on the Daily Timeframe (Daily)
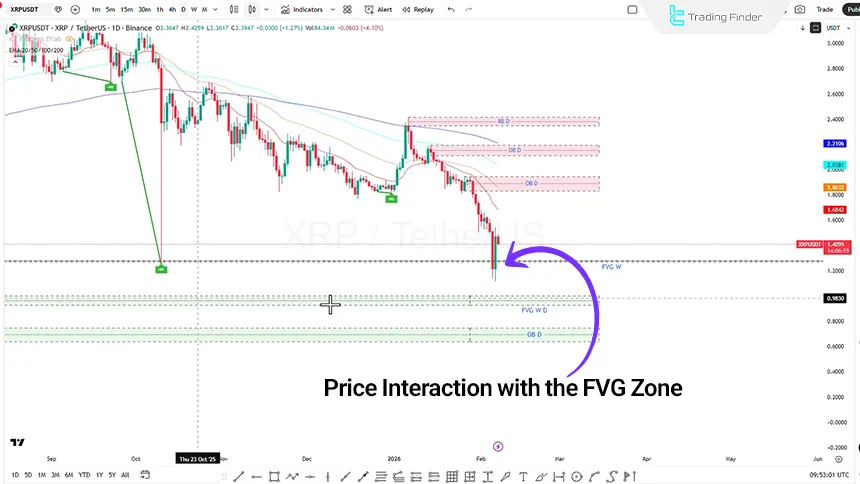
On the daily timeframe, after the collection of Sell Side Liquidity, price failed to stabilize below the targeted level. In the following daily candle, the market showed bullish momentum, which is interpreted as a sign of increasing buying pressure.
Within this structure, a Swing Failure Pattern has formed. If weakness in the bearish trend is identified, this setup can be used as a buy entry scenario. In this scenario:
- Stop Loss is placed behind the swing at $1.1172;
- Price target is considered the Order Block area at $1.8285.
This zone may act as an area for Buy Side Liquidity accumulation. Conversely, if price closes below $1.1122, the bearish scenario will be activated, and price movement may continue toward lower levels.
XRPUSDT Analysis on the 4-Hour Timeframe (H4)
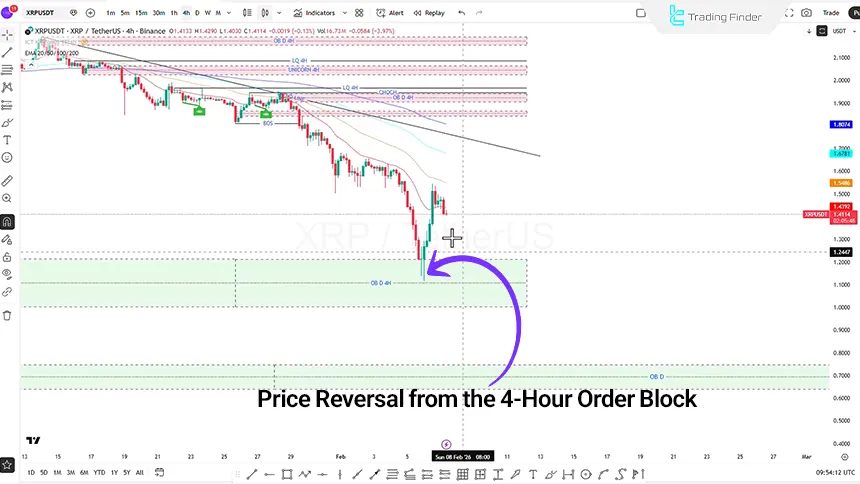
On the 4-hour timeframe, price has failed to break market structure. Despite previous alignment with an uptrend, selling pressure is currently observed in the market. Under these conditions, there is a possibility of price moving downward and entering the daily Order Block zone, which has been optimized on the 4-hour timeframe.
If price reacts to this area, buy positions with a Risk-to-Reward ratio of 1:1 or 1:2 may be considered.
On the other hand, if increased momentum and Buy Side Liquidity collection reveal weakness in the bullish trend, this situation may be considered a short (sell) entry scenario in the direction of the dominant market move.
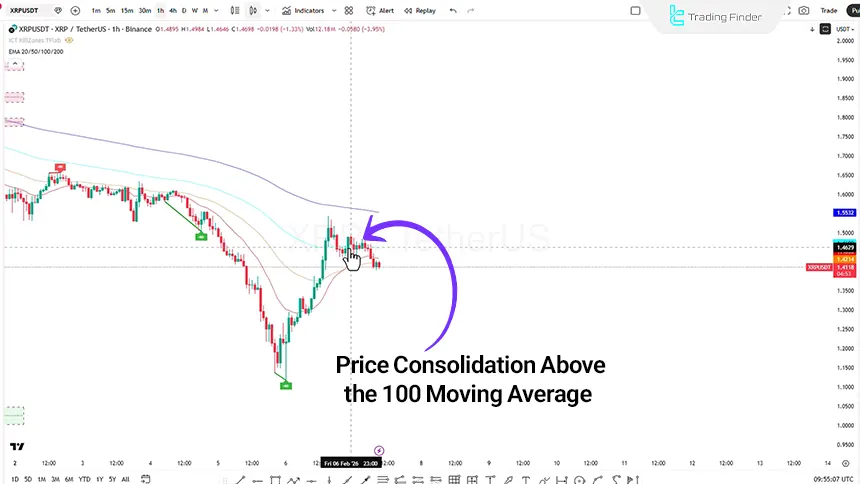
Ripple (XRP) Analysis on the 1-Hour Timeframe (H1)
On the 1-hour timeframe, price failed to stabilize above the 100 Moving Average and eventually closed below this moving average. This price behavior may lead to a continuation of the bearish move and price entering the CP zone.
In an alternative scenario, if selling pressure increases and price reaches the pin-bar candle shadow area, a buy position may be evaluated based on Strategy No. 2. This scenario is defined based on the Ryan Soldier strategy, where after a downward price move, Sell Side Liquidity is collected and price closes within the candle shadow, triggering a buy entry. In this case:
- Stop Loss is placed behind the swing;
- Price targets are determined based on previous swings;
- A Risk-to-Reward ratio of 1:1 or 1:2 is considered.
Conclusion
The overall market structure of Ripple on higher timeframes remains bearish, while on mid and lower timeframes, signs of liquidity accumulation, reactions to key levels, and temporary increases in buying momentum are observed.
Price behavior relative to closing levels, reactions to moving averages, and the condition of the Relative Strength Index (RSI) play a crucial role in activating bullish or bearish scenarios going forward.


