


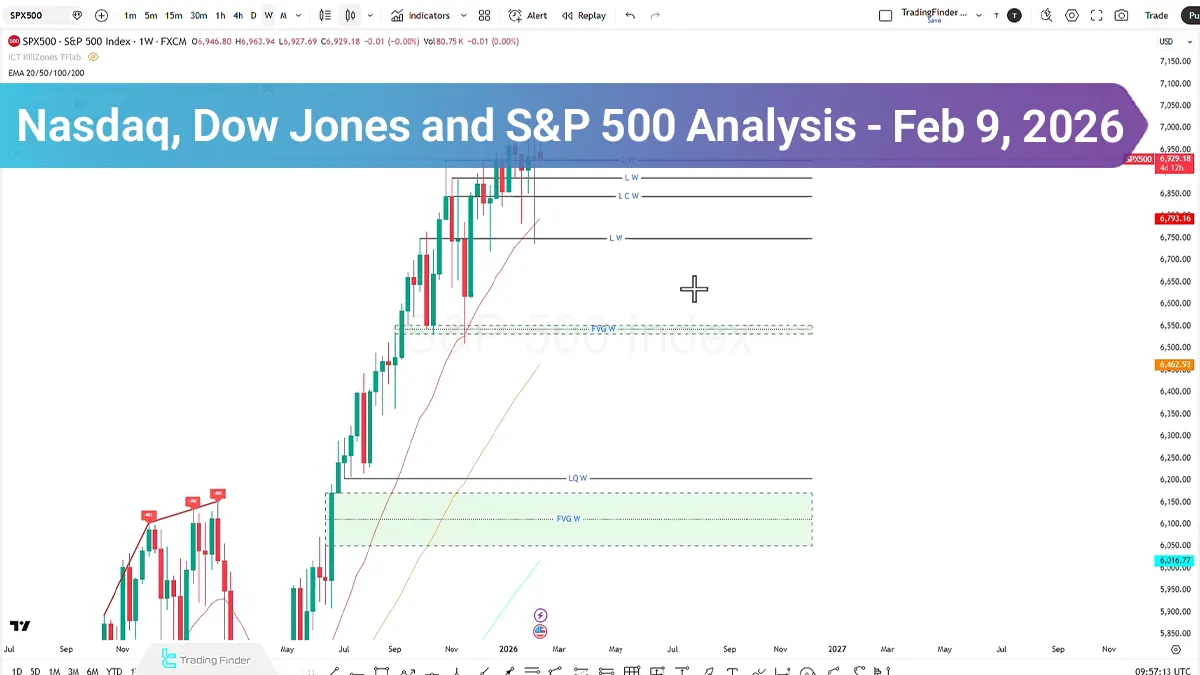
On the weekly timeframe of the S&P 500 index, following a phase of selling pressure and the sweep of sell-side liquidity, price delivered a strong bullish reaction from the key weekly level and the 20-period moving average, subsequently resuming its upward trajectory backed by renewed buying pressure.
Key Points:
- The S&P 500 index on the weekly timeframe, after collecting sell-side liquidity, has shown a positive reaction to the 20-period moving average, and the overall bias remains bullish;
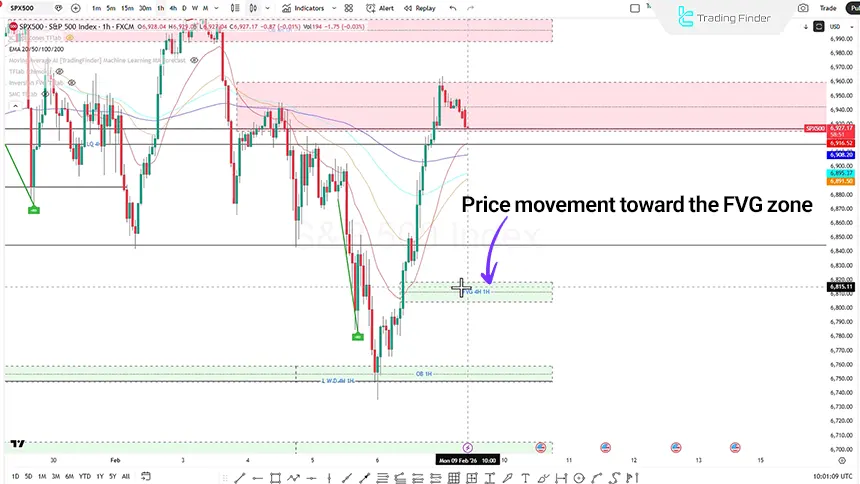
- On the 1-hour timeframe of the S&P 500, a short-term correction toward the FVG zone is likely, followed by a continuation of the bullish move to collect buy-side liquidity;
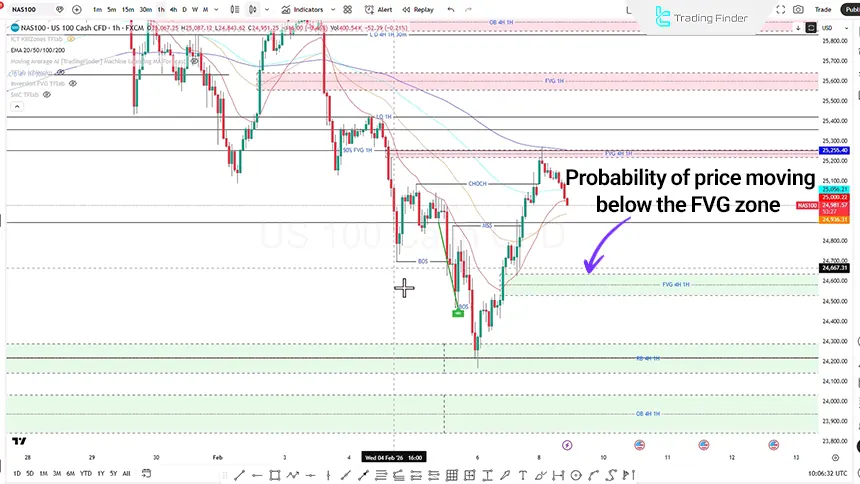
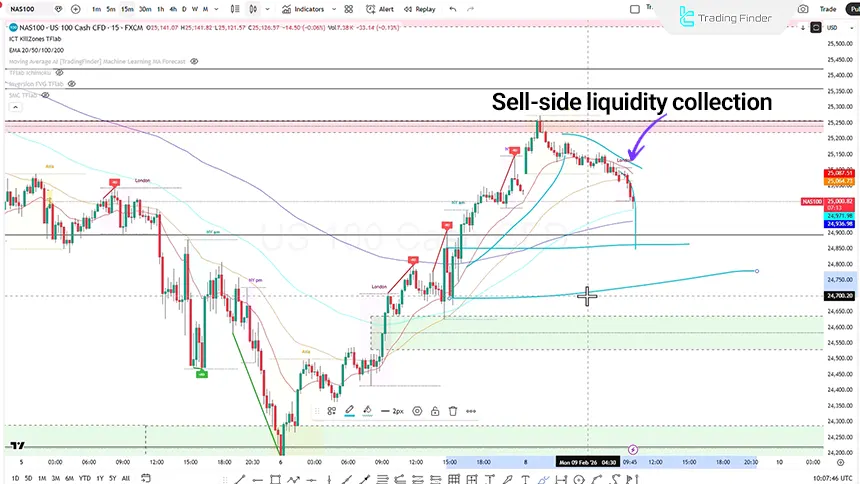
- The Nasdaq symbol has encountered weakening momentum within the FVG zone; a close below $24891 could activate a deeper correction scenario;
- SMT divergence between the S&P 500 (higher high) and Nasdaq (lower high) strengthens the warning of a short-term correction in the U.S. equity market;
- The Dow Jones index remains in an uptrend but with declining short-term momentum; a correction toward the FPG zone at $49636 is considered a probable scenario before further growth.
S&P 500 Index Analysis on the 1-Hour Timeframe
On the 1-hour timeframe, a continuation pattern is currently developing, with a 4-hour FVG zone positioned just below the structure.
Under these conditions, price is likely to perform a short-term bearish correction and afterward resume its bullish movement to collect buy-side liquidity.
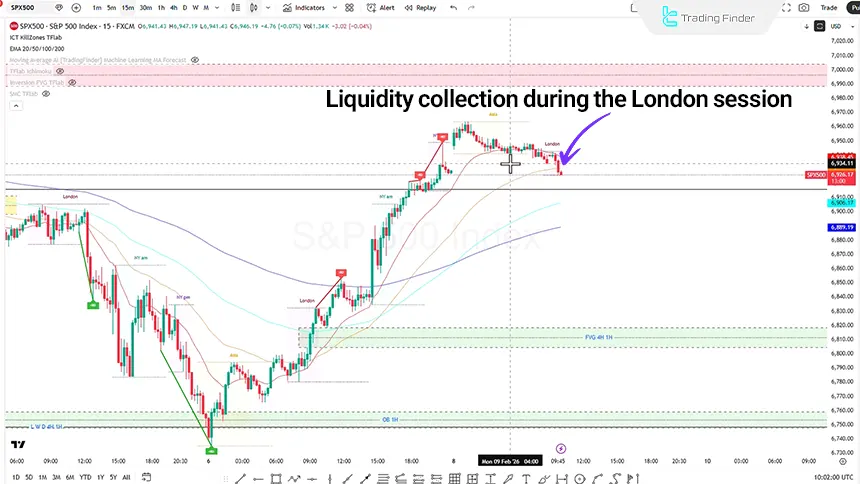
S&P 500 Index Analysis on the 15-Minute Timeframe (15 M)
On the 15-minute timeframe of the S&P 500 index, the price movement is described as an accumulation phase, indicating weakness in both the bullish and bearish trends.
Additionally, price opened on Monday with a Daily Gap. It is expected that the gap will first be filled, then price will enter a short-term bearish correction, and subsequently, the London session will accompany the collection of sell-side liquidity.
Nasdaq Index Analysis on the 1-Hour Timeframe
On the 4-hour timeframe, following a sustained bullish leg, price has rotated into the FVG zone and reacted to this area. The scenarios under consideration are as follows:
- Price entry at the 50% FVG level on the 4-hour or 1-hour timeframe and seeking entry after identifying weakness in the decline;
- In the event of renewed selling pressure, price may retrace into the continuation pattern zone, where trade execution and directional bias can be reassessed from that area.
The condition for activating further decline is a close below the FVG zone at the $24891 level while maintaining bearish momentum.
Nasdaq Symbol Analysis on the 15-Minute Timeframe (M15)
On the 15-minute timeframe, weakness in the bearish trend along with the formation of buy-side liquidity has been observed. The Asia session was in an accumulation phase, and during the London session there is a possibility of sell-side liquidity collection.
The first price reaction zone is in the Order Block area between the levels of $241,860 and $247,000.
In the event of a Market Structure Shift, entering a long position is possible.
SMT Divergence Analysis Between S&P 500 and Nasdaq
In the S&P 500 index, a higher high has been registered compared to previous swings, but in Nasdaq, due to a lack of momentum, a lower high has formed.
This situation is considered SMT divergence and is presented as confirmation for a short-term bearish correction scenario.
This structural misalignment between the two indices can be interpreted within the framework of SMT Divergence. In the context of SMT divergence, when two correlated assets or indices fail to register new highs or lows simultaneously, this divergence is considered indicative of uneven liquidity distribution and a potential rotation of capital across sectors.
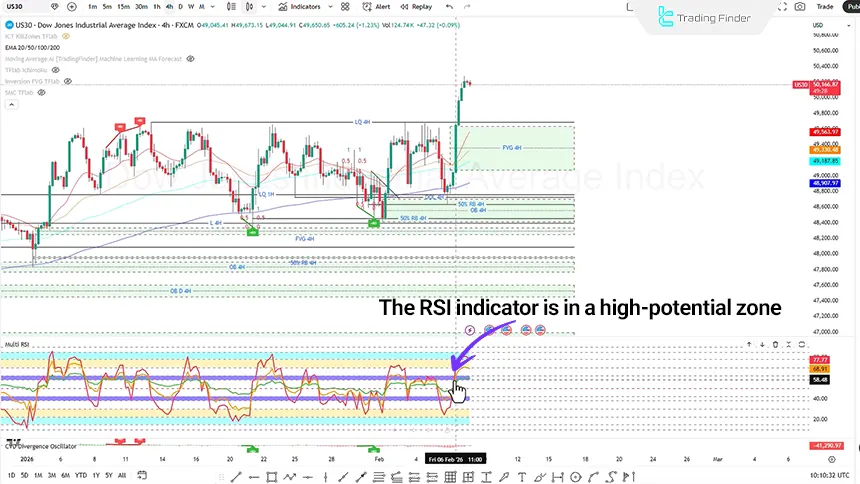
Dow Jones Analysis on the 4-Hour Timeframe (H4)
On the 4-hour timeframe, the primary trend is described as bullish, but price is in a consolidation phase. Moreover, the Relative Strength Index (RSI) is in a high-potential zone, indicating continuation of the bullish trend.
At the same time, a short-term correction toward the all-time high or the 50% FVG level is presented as a probable move before continuation of the uptrend.
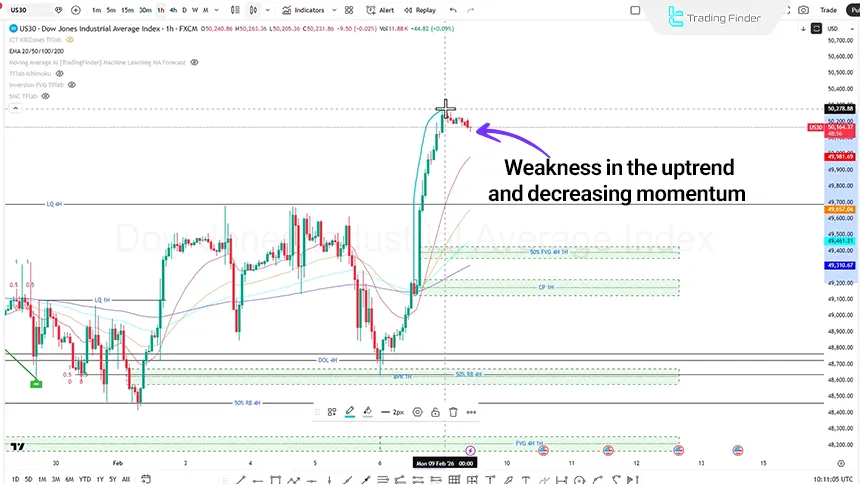
Dow Jones Index Analysis on the 1-Hour Timeframe (H1)
On the 1-hour timeframe, weakness in the bullish trend and declining momentum after an aggressive bullish move have been mentioned.
Accordingly, a short-term bearish correction scenario is price toward the FPG zone at the $49636 level.
Conclusion
Overall, the market across the major U.S. indices is still assessed as bullish, and on most timeframes there are signs of a short-term correction.
The core of the scenarios is based on liquidity collection, price reaction to Order Block zones and Fair Value Gap (FVG), as well as receiving confirmation from weakness in the bearish move.
Meanwhile, observing SMT divergence between the S&P 500 index and Nasdaq can be considered a warning of a potential short-term correction in the market.


