


Key Points:
- The EUR/USD pair has reacted to the BPR zone after collecting Sell Side Liquidity and has entered a decision-making phase;
- In the case of bullish accumulation, the next target could be the Internal Liquidity at the $1.1929 level; otherwise, weakening momentum may activate a selling scenario from the BPR zone;
- On the 1-hour timeframe, the formation of a bullish pin bar signals a temporary shift in momentum to the upside, and Buy Side Liquidity at the highs acts as a price magnet;
- Price behavior relative to the Asian session high and the reaction during the London and New York sessions will determine the short-term market direction;
- The decline in trading volume due to the U.S., Canadian, and Chinese market holidays has weakened the quality of price movements and increased the likelihood of deceptive volatility (Liquidity Grab).
With the United States, Canada, and China markets closed, a noticeable reduction in market liquidity is observed, which may impact the quality of price movements and the depth of fluctuations.
Under these conditions, the EUR/USD pair, after collecting sell-side liquidity, is reacting to the BPR zone. In the following, bullish and bearish scenarios are examined based on price behavior in key areas and lower timeframes.
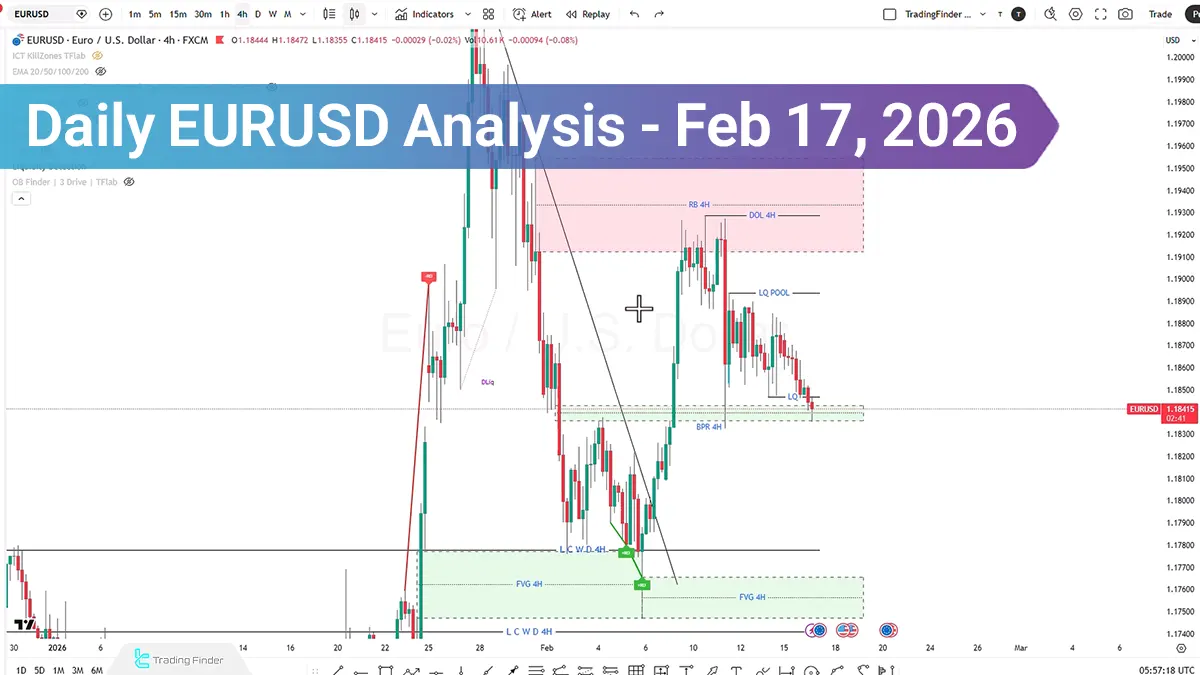
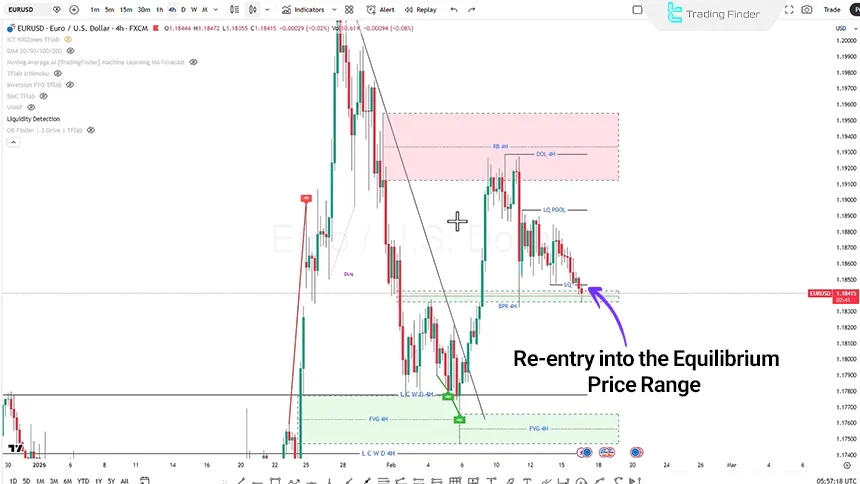
Daily EUR/USD Analysis on the 4-Hour Timeframe (H4)
At the beginning of the week, price completed its primary move and collected sell-side liquidity. The reaction to the BPR zone indicates that the market has entered a decision-making phase.
Currently, two main scenarios can be outlined:
- Price moving upward to collect buy-side liquidity;
- Re-entry into the Balanced Price Range and assessment of trend strength or weakness.
If, after entering the mentioned zone, price shows signs of weakness in the bullish trend, this area may be considered a potential position for entering a Sell position.
However, if the upward movement is accompanied by strong displacement, the probability of trend continuation increases. In this scenario, the next target could be the collection of buy-side liquidity from the internal liquidity zone at the $1.1929 level.
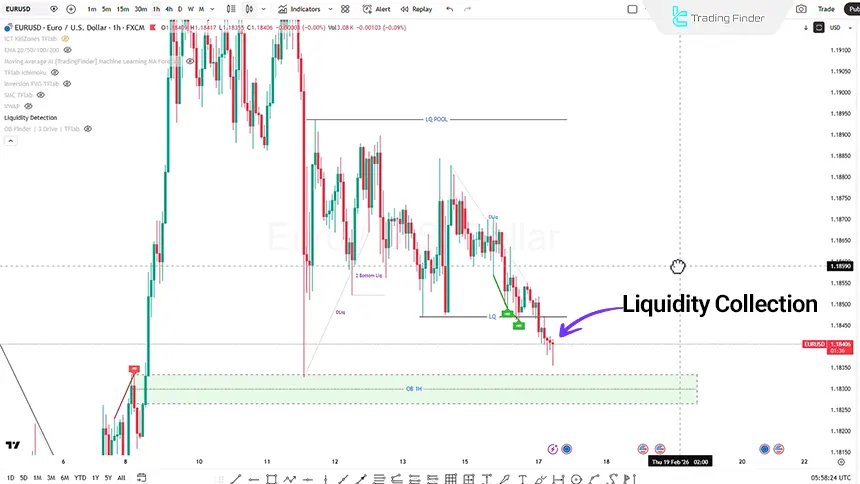
EURUSD Analysis on the 1-Hour Timeframe (H1)
On the 1-hour timeframe, price is in a consolidation phase. Within this zone, the formation of three Pin Bar candles is observed.
This candle may indicate a temporary shift in momentum from bearish to bullish and strengthen the probability of upward price movement. Smart Money and ICT traders, using liquidity identification indicators such as Liquidity Finder, can identify liquidity concentration levels.
Under current conditions, a buy-side liquidity level is positioned above, which can act as a price magnet. If the euro remains relatively stable against the U.S. dollar and related economic variables improve, continuation of the bullish trend toward the 1.2000$ level is also conceivable in the mid-term.
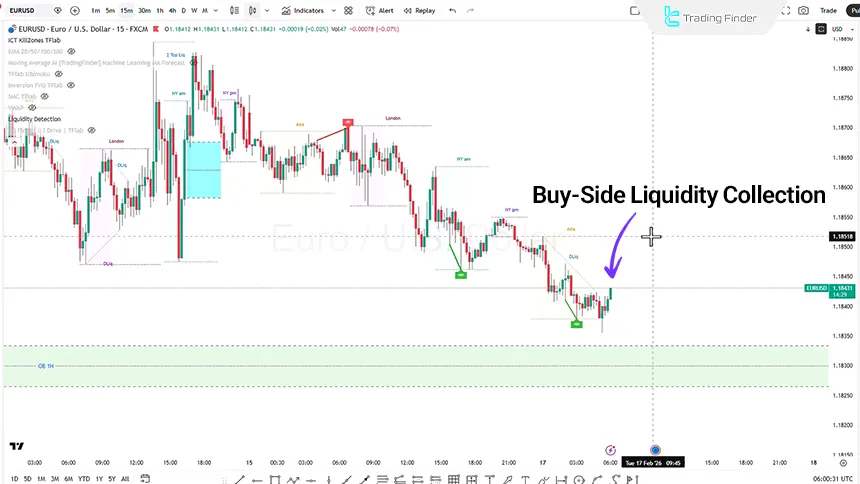
EUR/USD Analysis on the 15-Minute Timeframe (M15)
On the 15-minute timeframe, using analytical indicators, it is possible to identify kill zones and trading sessions.
During the London session, if a manipulation move occurs first and then price moves upward and successfully closes a candle within the accumulation zone, the market may be expected to enter the Distribution phase.
If, after the upward move, price reacts to the Asian high or fails to reach it, the possibility of a bearish move forming during the New York session also exists.
However, if price breaks above the Asian high without significant weakness and is accompanied by positive momentum, continuation of the bullish trend during the New York session will be more likely.
Conclusion
At present, the price structure of EUR/USD indicates that after collecting sell-side liquidity, the market has entered the phase of evaluating buy-side liquidity. In simpler terms, the initial bearish pressure has been absorbed, and the market’s focus is now on higher liquidity zones.
The formation of a bullish pin bar on the 1-hour timeframe may signal strengthening bullish momentum. However, the validity of this scenario is reinforced only when price movement is accompanied by strong displacement and candles close with sufficient quality at key levels.


