


Key Points:
- Across DAX, FTSE, ASX, and Nikkei, recent price action has been driven by Buy Side Liquidity collection followed by a return into Consolidation ranges after aggressive bullish impulses;
- The transition into Accumulation, Manipulation, and Distribution cycles suggests the likelihood of a short-term corrective phase before the potential continuation of the dominant bullish trend;
- Technical reactions to the 20, 50, and 100 Moving Averages, along with emerging CVD and RSI divergences, indicate weakening Momentum and an increased probability of downside retracement toward Order Block zones;
- Failure to close above recent highs (particularly below Pin Bar levels) combined with Market Structure Break signals may activate bearish scenarios targeting key liquidity zones before any renewed upside movement;
In the week ending 8 February, price action across Germany’s DAX, UK’s FTSE, Australia’s ASX, and Japan’s Nikkei indices has been largely influenced by the collection of Buy Side Liquidity and the return of price into consolidation ranges.
In most of these markets, after aggressive bullish impulses, a transition into the cycles of Accumulation, Manipulation and Distribution can be observed, which may first trigger a short-term correction and then resume the dominant trend path.
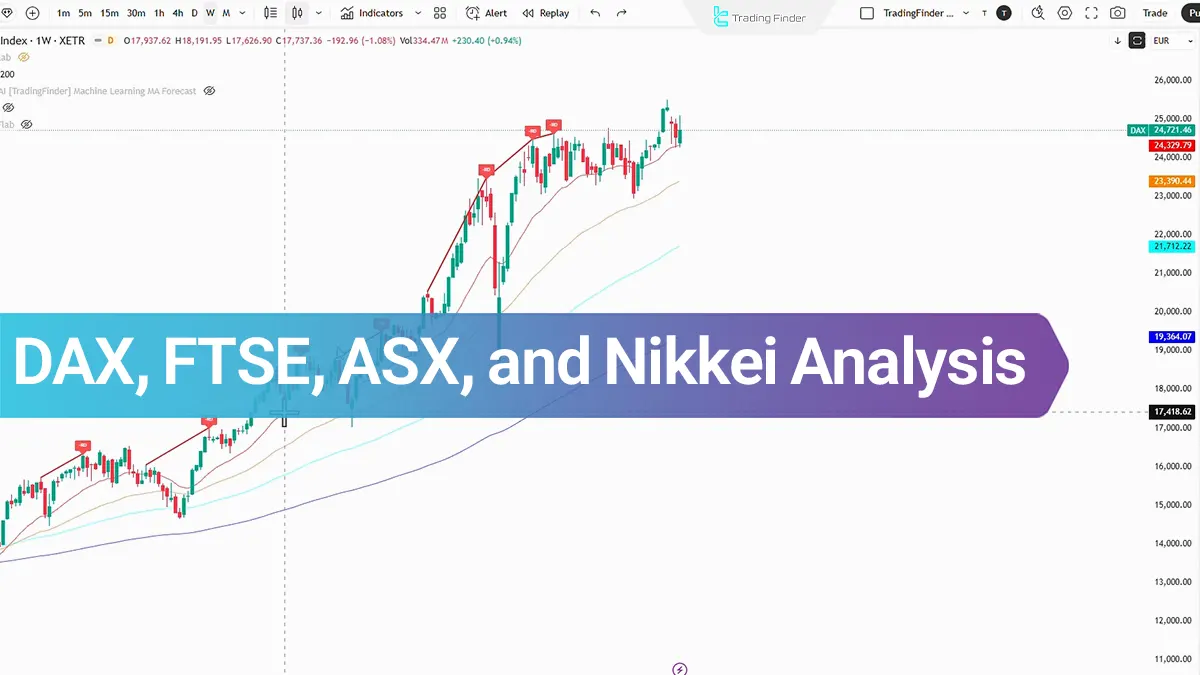
DAX Analysis on the Daily Timeframe
After an aggressive bullish move, price managed to collect Buy Side Liquidity from the previous week and then printed a close within the prior weekly candle.
This suggests the market has entered a consolidation phase; a phase that typically, after completing the Accumulation cycle and Manipulation is accompanied by signs of Distribution.
The review of Moving Averages also shows that during recent swings, price has reacted multiple times to the 20, 50, and 100 moving averages, and after each reaction, it has returned to its bullish path.
In addition, after identifying a CVD divergence, a short-term correction formed down to the 100-period moving average, which was then followed by a rebound to the upside.
However, a return of price into the consolidation range can activate a corrective scenario and put a bearish move toward the Order Block (Order Block) zone at the following levels on the market’s agenda:
- 241865 level
- 231935 level
In this context, a strengthening of hawkish views in the European Central Bank’s monetary policy may also increase the likelihood of price moving toward the 200 moving average.
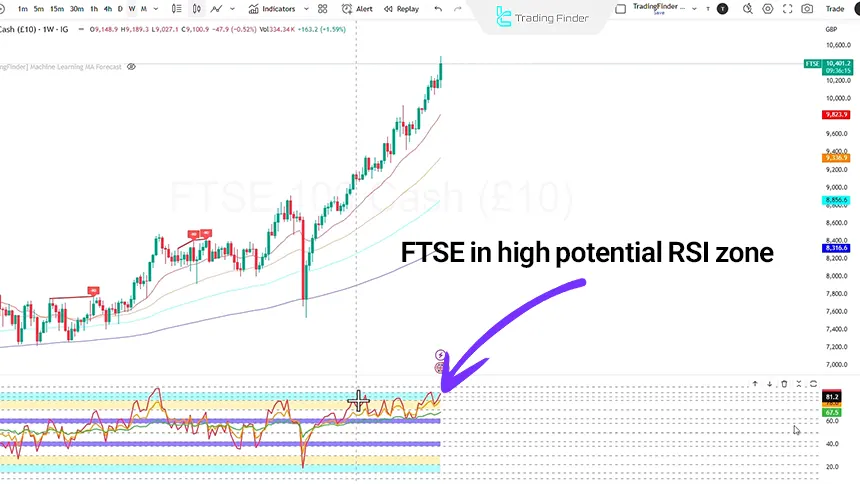
FTSE Analysis on the Daily Timeframe
Last week, price collected Buy Side Liquidity with a wide-range candle and recorded a close above its key level.
This behavior, alongside the Relative Strength Index entering a zone that previously aligned with continued upside movement, indicates the persistence of positive momentum within the market structure.
However, while price is printing higher highs, the formation of lower highs in the Relative Strength Index (RSI) signals a bearish divergence; a pattern that has previously led to a short-term correction before the bullish trend resumed.
If this correction is triggered, price reactions to the 50 and 100 moving averages are likely, and the Order Block (Order Block) zone may be considered as a downside target. Based on the move projection:
- 9909 level
- 9814 level
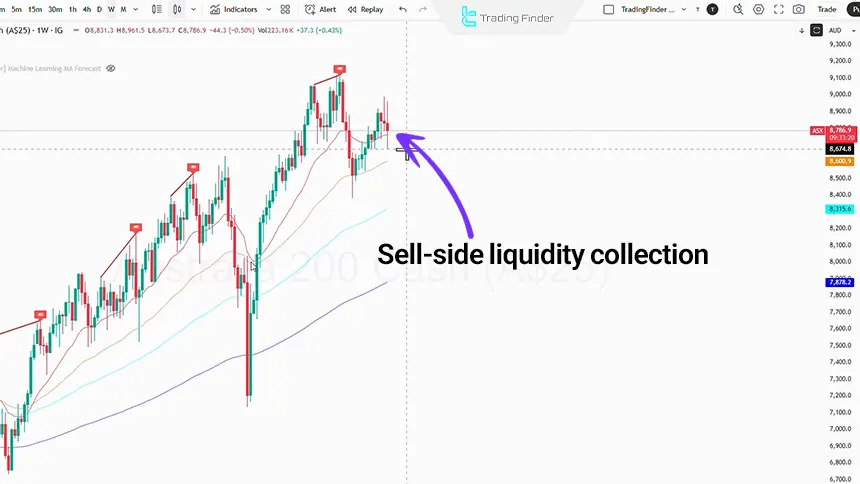
ASX Analysis on the Daily Timeframe
Last week, the price traded in a range and consolidation zone and only collected Sell Side Liquidity.
After forming an all-time high, a CVD divergence appeared in the market structure, which was accompanied by a Market Structure Break.
Next, the price reaction to the 50 moving average led to an entry into the Order Block zone, followed by the formation of a consolidation phase.
On the daily timeframe as well, the formation of a Head and Shoulders pattern is observed, where a break of the neckline at the 8736 level could activate a bearish path toward the 8494 level.
In the short term, the following zones can be considered as potential price move targets:
- 8673 level
- 8642 level
However, recording a bullish close (Close) in the form of a Pin Bar (Pin Bar) indicates that a short-term Displacement to the upside is still plausible.
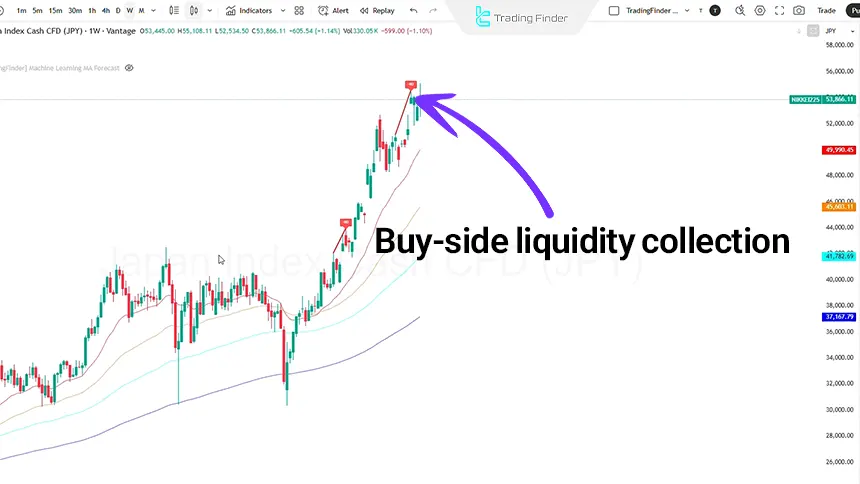
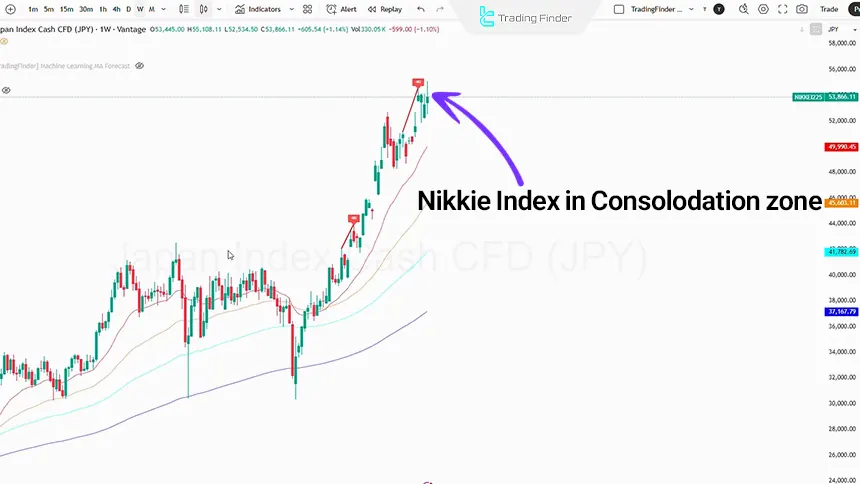
Nikkei Analysis on the Daily Timeframe (Daily)
Over the past four weeks, price has been in a consolidation range and in the most recent week, after collecting Buy Side Liquidity it again recorded a close within this range.
At the same time, observing a bearish divergence in the Relative Strength Index (RSI) can set the stage for a short-term correction in the price structure.
If the bearish scenario is activated, price targets in the following ranges can be assessed:
- 47138 to 46100 levels
- 50550 to 49287 levels
On the daily timeframe as well, price failed to record a close above its all-time high and after two unsuccessful attempts, it closed below the Pin Bar candle.
a behavior that can be interpreted as confirmation of liquidity collection and the activation of a bearish correction toward the Order Block (Order Block) zone, before the bullish trend potentially resumes.
Conclusion
Across most of the reviewed indices, after collecting Buy Side Liquidity, signs of weakening Momentum and a transition into a consolidation phase are visible.
Divergences in the Relative Strength Index (RSI) and repeated reactions to moving averages have increased the probability of a short-term correction.
However, the overall market structure still preserves the potential for a bullish continuation after these corrective moves are completed.


