


Key notes:
- Palladium Price holding above the previous Weekly Close suggests a bullish bias, keeping the move toward Buy Side Liquidity active if supported by Bullish Displacement;
- On the daily timeframe, stabilization above $1844.50 may lead to entry into the Weekly Rejection Block, while a Close within compression could signal selling pressure;
- On H4, failure to close above swing highs after a Stop Hunt raises the possibility of a Market Structure Shift (MSS) and pullback to Order Block or FVG;
- On H1, the Swing Failure Pattern near $1747 and $1676 may guide the next liquidity move, especially if a Continuation Pattern (CP) forms.
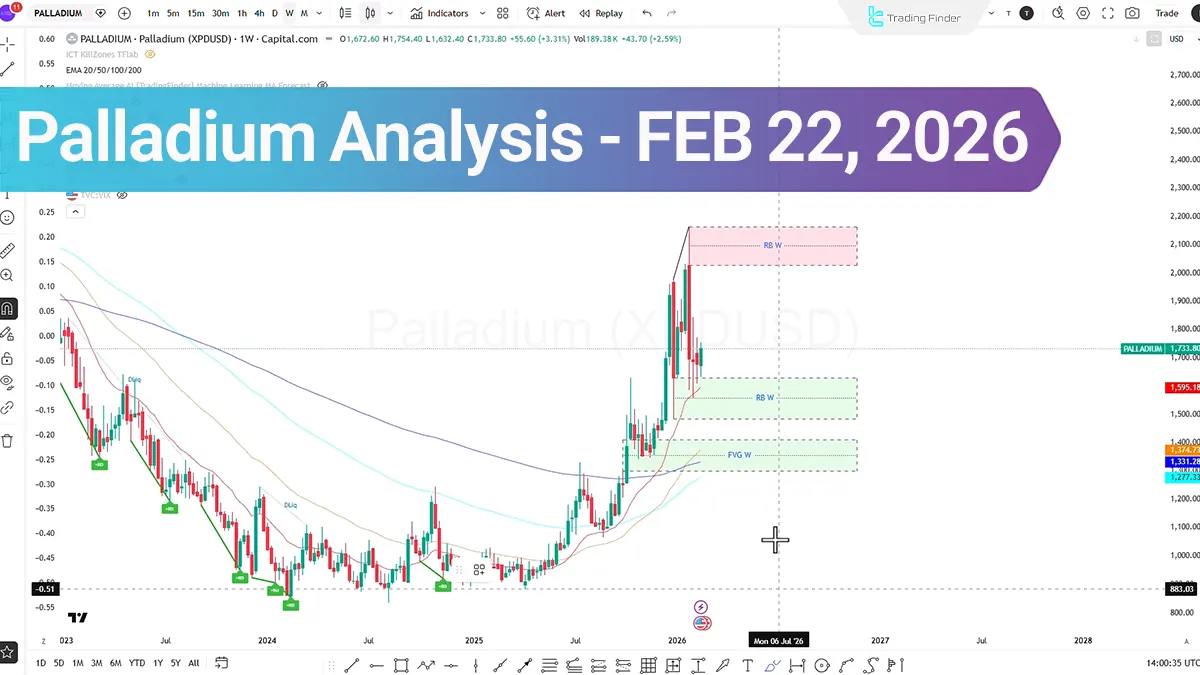
In the past week, the price of palladium stabilized above the previous weekly Close, which may indicate the preservation of a bullish bias within the market structure. If this condition persists, the scenario of moving toward Buy Side Liquidity will remain active; especially if the price movement is accompanied by bullish Displacement.
XPDUSD Analysis on Daily Timeframe
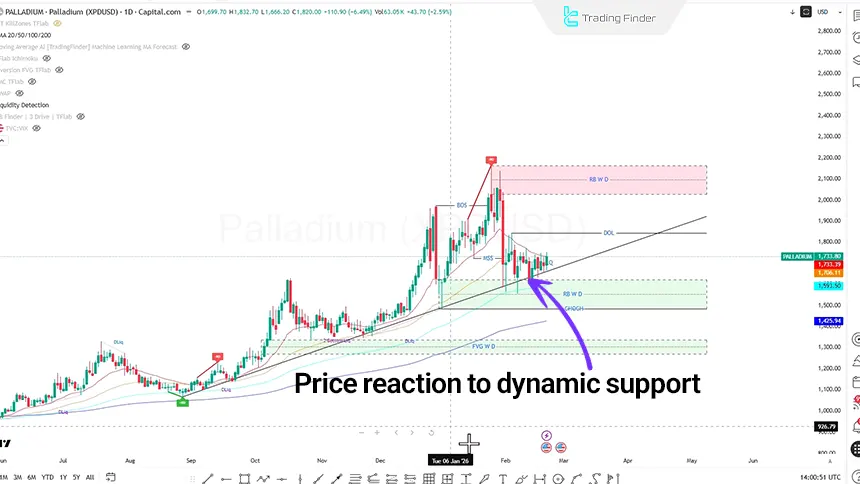
On the daily chart, the price reaction to the ascending trendline is visible; where the market has entered a compression phase, simultaneously forming both Buy Side Liquidity and Sell Side Liquidity within the structure.
- If the price moves upward and collects Buy Side Liquidity, and manages to stabilize above the draw liquidity level around $1844.50, the probability of entering the optimized weekly rejection block in the daily timeframe will increase;
- In contrast, if the price once again records a Close within the compression zone, it may signal increasing selling pressure and the market’s tendency to target lower levels.
Activating this scenario requires price stabilization above the $1844.50 level after collecting Buy Side Liquidity, in which case continuation toward higher zones would be likely.
Recording a close within the compression zone may indicate weakening bullish momentum and the possibility of movement toward lower liquidity zones.
Palladium Analysis on 4-Hour Timeframe (H4)
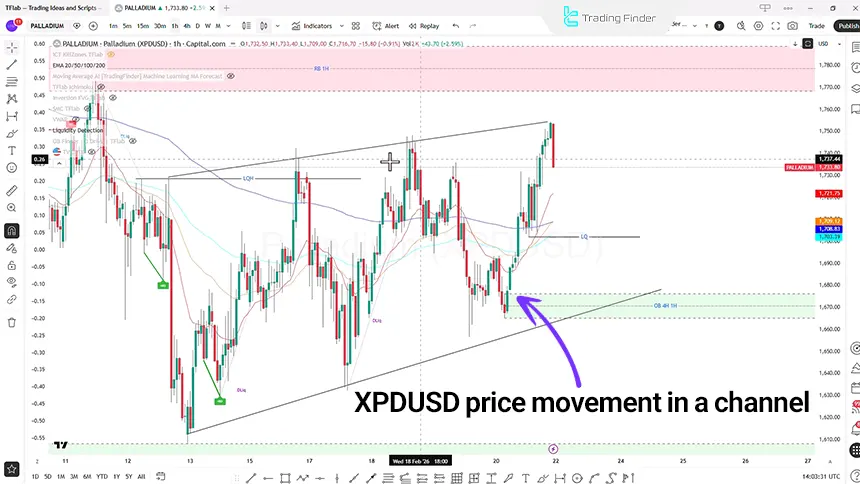
In the 4-hour timeframe, the price is fluctuating within an ascending channel.
However, the attempt to record a close above the swings has only resulted in the collection of Buy Side Liquidity, and after a Stop Hunt, the market has encountered a bearish candle.
- If a bearish move begins at the start of the week and a Market Structure Break or Market Structure Shift (MSS) occurs, entry into the Order Block zone may become available;
- If the price records a Close below the channel line and then pulls back to the Order Block zone or the Fair Value Gap (FVG), the scenario of entering a sell position with a risk-to-reward ratio of 1:1 or 1:2 can be evaluated.
Considering the overall trend, the primary focus is recommended to remain on buy positions in alignment with the dominant market bias.
XPDUSD Analysis on 1-Hour Timeframe (H1)
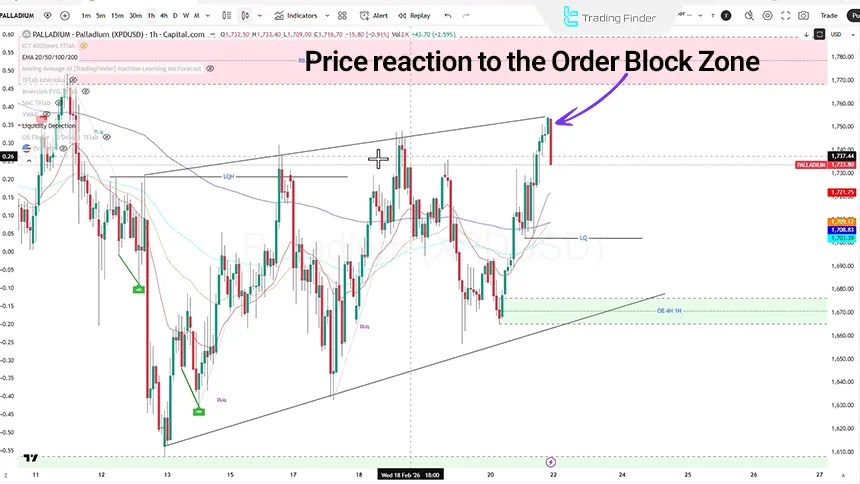
In the 1-hour timeframe, the bullish structure remains intact with the formation of higher highs and higher lows; however, sufficient momentum for price stabilization above the swings is not observed.
- With the break of swings and the return of price to the zone, a Swing Failure Pattern has formed;
- In case of a pullback to the Order Block zone at the 1747 level, it would be possible to evaluate a sell position with the stop placed behind the zone, targeting Buy Side Liquidity.
On the other hand, If the price enters the Continuation Pattern zone and successfully records a close within it, the probability of renewed upward movement will be strengthened.
An increase in bearish momentum may direct the price toward the Order Block zone at the 1676 level; a zone that may act as the basis for reversal and continuation of the bullish trend.
Conclusion
The overall structure of palladium still shows a tendency to maintain an upward trend; however, the presence of price within a compression phase and reduced momentum in lower timeframes has increased the likelihood of two-sided liquidity collection.
The price reaction to the levels of $1844.50, $1747, and $1676 may play a key role in determining the market’s next direction from a momentum and liquidity structure perspective.


